

- Share
Intergenerational Homeownership and Mortgage Distress
Rates of US homeownership have declined in the past two decades, and the decline has been especially pronounced for young adults. Motivated by recent research that explores the ways in which personal experiences can affect financial attitudes and beliefs, we explore whether the negative homeownership experiences of parents during the 2008 financial crisis could have caused their children to view homeownership less favorably. We find that parental mortgage distress negatively correlates with the probability that a child will purchase a home, and we explore various channels through which this link may occur.

The views authors express in Economic Commentary are theirs and not necessarily those of the Federal Reserve Bank of Cleveland or the Board of Governors of the Federal Reserve System. The series editor is Tasia Hane. This paper and its data are subject to revision; please visit clevelandfed.org for updates.
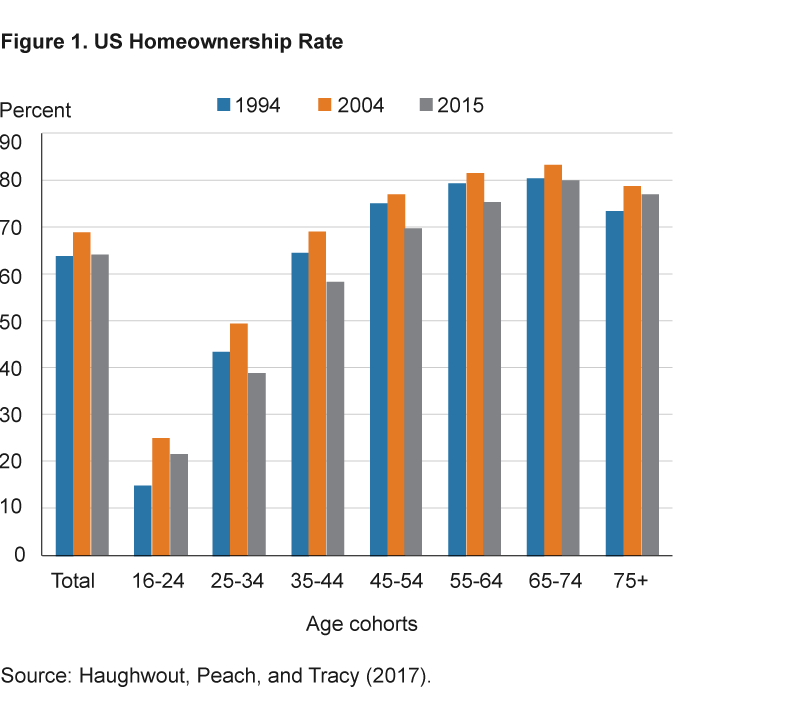
Recent analyses show that rates of US homeownership have declined for most age groups in the past two decades. According to a Federal Reserve Bank of New York report, for example, homeownership rates fell from 1994 to 2015 for people aged 25 to 64, and since 2004, the decline has been especially pronounced among those 25 to 44.1 (See figure 1.) Despite these statistics, few studies have tried to understand what factors might be behind the decline in homeownership among younger generations.
We document a novel correlation between the homeownership rates of young adults and the mortgage experiences of their parents. Motivated by recent research that explores the ways in which personal experiences can affect financial attitudes and beliefs (Malmendier and Nagel, 2011; Brown, Cookson, and Heimer, 2019), we explore whether the negative homeownership experiences of parents during the 2008 financial crisis could have caused their children to view homeownership less favorably. We use a proprietary credit panel data set to compare mortgage-distress outcomes of the adult with homeownership outcomes of the child. We find that parental mortgage distress negatively correlates with the probability that a child will purchase a home.
The negative correlation between parental distress and the homeownership rates of their children suggests that children of parents who have had negative experiences during the housing crisis develop negative views toward homeownership. However, we acknowledge that there are other plausible explanations for this negative relationship, and we seek to disentangle some of these competing explanations. In particular, children may inherit poor financial habits from their parents and as a result not have the necessary credit scores, incomes, or down payment to purchase a home. Furthermore, many parents help their children with down payments, and the loss of wealth caused by the financial crisis may have prevented some parents from assisting their children’s purchases. While we attempt to address some of these issues in our analysis, we acknowledge that we do not cleanly identify the precise channel of mortgage-distress transmission in our data. As a result, our paper should be viewed as providing evidence on a possible explanation.
Data
We examine the correlation between parents’ negative homeownership experiences and their children’s views on homeownership using the Federal Reserve Bank of New York Consumer Credit Panel, Equifax Data (CCP). This is a panel data set at the individual level containing credit and borrowing characteristics of a 5 percent random sample of the population that has a credit history. The data span 1999 to the most recent quarter. This data set is ideal for our study, as it contains detailed data on individual mortgage accounts for a large portion of the population relative to other similar data sets. Our sample spans 1999:Q1 to 2016:Q3. With the data, we can confidently match adult guardians with children using a household identifier and then follow the credit outcomes of both over time. We also incorporate CoreLogic home-price-index data to calculate state-level home-price increases for single-family homes during the period from 2002 to 2006.
For the purposes of this study, we are primarily interested in the amount of time that transpires between the time a child turns 19 and the time he or she gets a mortgage loan, and the mortgage-distress characteristics of the child’s adult guardian. We allow children to enter into our sample if they are between the ages of 19 and 22 during any quarter from 1999 to 2004; then we follow the children and adults until 2017. We end up with a sample of 53,040 unique children. Table 1 shows some basic summary statistics of the data we use.
| Variable | Observations | Mean | Standard Deviation | Minimum | Maximum |
|---|---|---|---|---|---|
| Homeowner | 53,040 | 0.41 | 0.49 | 0 | 1 |
| No distress | 53,040 | 0.51 | 0.50 | 0 | 1 |
| Mild distress | 53,040 | 0.09 | 0.28 | 0 | 1 |
| Severe distress | 53,040 | 0.09 | 0.28 | 0 | 1 |
| Default | 53,040 | 0.06 | 0.23 | 0 | 1 |
| No mortgage | 53,040 | 0.26 | 0.44 | 0 | 1 |
| Moved | 53,040 | 0.18 | 0.38 | 0 | 1 |
| Child risk score | 52,267 | 635.51 | 77.14 | 390.17 | 823.98 |
| Maximum credit card utilization | 45,130 | 0.42 | 0.36 | 0 | 1 |
| Price increase | 52,627 | 0.47 | 0.30 | 0.10 | 1.08 |
| Total observations | 53,040 unique children |
Source: Authors’ calculations based on data from the Federal Reserve Bank of New York Consumer Credit Panel, Equifax Data (CCP).
Preliminary Results
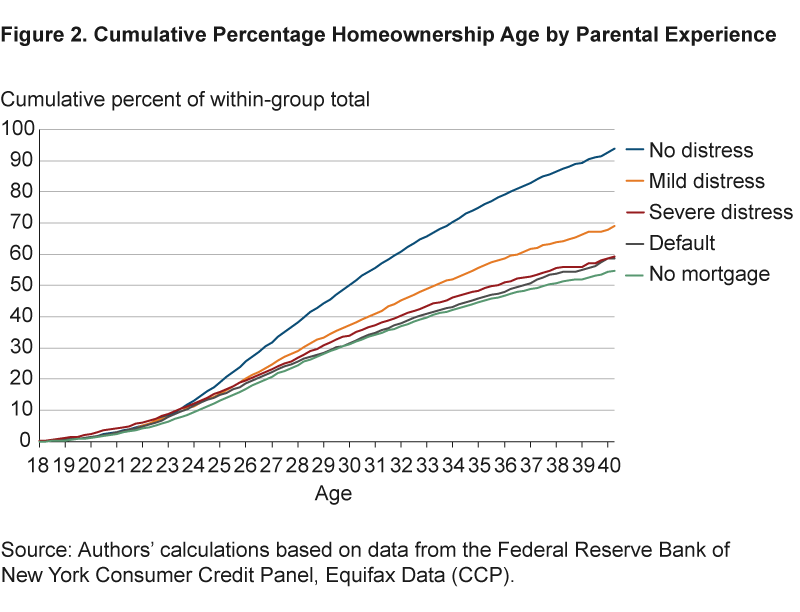
We can begin our investigation by graphing cumulative mortgage starts by the children in our sample over time for the different levels of maximum realized adult mortgage distress (figure 2). Mortgage distress is defined in terms of the number of consecutive missed payments on a first mortgage loan. One to three consecutive missed payments is defined as mild distress, four to five consecutive missed payments is defined as severe distress, and more than five missed payments is defined as default. We monitor the adults for the maximum realized level of mortgage distress, and we monitor the respective children for a mortgage start over the course of their lives that we observe in the data.
A noticeable gap forms around age 25 between children whose parents experienced no mortgage distress and children whose parents experienced at least mild distress. This gap widens as the children age and as levels of mortgage distress increase. By age 30, 50 percent of children from nondistressed households have purchased a home compared to 37 percent of children from households with a mild level of distress.
The Effect of Mortgage Distress on Homeownership Preferences
To quantify these effects more formally, we use regression analysis. Our first task is to estimate the size of the effect from adult mortgage distress on the odds that a child will purchase a home over time. We look at the highest amount of distress observed for an adult at any point in time during our sample period and the amount of time it takes for a child to purchase a home after age 19.
Table 2 shows the regression estimates. The estimate of the effect on child homeownership from adult distress is −0.0041 and statistically significant. This means that a household experiencing any level of mortgage distress is associated with a reduction in the probability of a child becoming a homeowner by 0.41 percent in a given quarter. Unconditional on adult distress, our sample shows the probability that a child will transition into homeownership in any given quarter is 0.58 percent. We can interpret the estimated-distress effect as reducing the odds of a child transitioning into homeownership by 71 percent in a given quarter.
| Homeowner | |
|---|---|
| Any distress | −0.00407*** (−13.49) |
| No mortgage | −0.00417*** (−13.66) |
| Number of observations | 2488756 |
| Adjusted R-square | 0.004 |
| Child age fixed effects | x |
| Calendar date fixed effects | x |
| Child geography fixed effects (county-dynamic) | x |
| Parent geography fixed effects (county-static) | x |
Notes: Errors are clustered by child geography (county-dynamic) and calendar date. In parentheses are t statistics: * p<0.10, ** p<0.05, *** p<0.01.
Source: Authors’ calculations based on data from the Federal Reserve Bank of New York Consumer Credit Panel, Equifax Data (CCP).
Next, we ask: By how much does the level of adult mortgage distress affect child homeownership? We expect that greater levels of distress would have a more negative impact on child homeownership. We estimate the effects of the levels of mortgage distress on child homeownership and present the results in table 3. The estimates of the distress variables are negative and statistically significant. We estimate mild distress, severe distress, and default effects of −0.00302, −0.00504, and −0.00496, respectively. It appears that higher levels of distress have stronger effects, as severe distress and default show the largest negative effect on homeownership, followed by mild distress.
| Homeowner | |
|---|---|
| Mild distress | −0.00302*** (−9.62) |
| Severe distress | −0.00504*** (−14.22) |
| Default | −0.00496*** (−11.41) |
| No mortgage | −0.00417*** (−13.68) |
| Number of observations | 2488756 |
| Adjusted R-square | 0.004 |
| Child age fixed effects | x |
| Calendar date fixed effects | x |
| Child geography fixed effects (county-dynamic) | x |
| Parent geography fixed effects (county-static) | x |
Notes: Errors are clustered by child geography (county-dynamic) and calendar date. In parentheses are t statistics: * p<0.10, ** p<0.05, *** p<0.01.
Source: Authors’ calculations based on data from the Federal Reserve Bank of New York Consumer Credit Panel, Equifax Data (CCP).
Alternative Explanations
These findings could be interpreted as parents’ experiences affecting their child’s preferences toward homeownership. However, other explanations are possible. We explore these alternatives next.
Shared Economic Shocks
One alternative explanation for our results is that parents and children are both affected by local economic shocks that make homeownership less sustainable. For example, a parent and a child could have the same employer. If the employer has layoffs, it could cause the parent to struggle to pay for his or her mortgage and the child to delay homeownership.
We explore this alternative explanation by estimating the relationship between children’s homeownership rates and adults’ mortgage distress for children who no longer reside in proximity to their parents. We split our sample of children into two groups: those who reside in a different state from their parents and those who reside in the same state. We then estimate the same regression as in table 2 separately for movers and nonmovers. Table 4 shows these results. Although the negative effects on homeownership conditional on adult mortgage distress are stronger for nonmovers, the effects on children who move are also statistically significant and negative. This suggests that exposure of parents and children to similar local economic conditions does not fully explain the decline in child homeownership.
| Nonmovers | Movers | |
|---|---|---|
| Mild distress | −0.00331*** (−9.89) |
−0.00160*** (−2.75) |
| Severe distress | −0.00538*** (−13.15) |
−0.00421*** (−8.31) |
| Default | −0.00524*** (−10.58) |
−0.00378*** (−4.29) |
| No mortgage | −0.00445*** (−13.87) |
−0.00294*** (−7.71) |
| Number of observations | 2026559 | 462149 |
| Adjusted R-square | 0.005 | 0.010 |
| Child age fixed effects | x | x |
| Calendar date fixed effects | x | x |
| Child geography fixed effects (county-dynamic) | x | x |
| Parent geography fixed effects (county-static) | x | x |
Notes: Errors are clustered by child geography (county-dynamic) and calendar date. In parentheses are t statistics: * p<0.10, ** p<0.05, *** p<0.01.
Source: Authors’ calculations based on data from the Federal Reserve Bank of New York Consumer Credit Panel, Equifax Data (CCP).
Poor Financial Habits
Another explanation for the correlation between adult mortgage distress and children’s homeownership rates is that parents may pass on bad financial habits, not necessarily attitudes toward homeownership. To investigate this possibility, we make use of the financial crisis, which we view as an unanticipated experience of financial distress that affected parents with both good and bad financial habits. We want to test whether the mortgage distress that occurred only during or after the crisis had a larger effect on children than did mortgage distress experienced before the crisis. This utilizes the unanticipated shock from the housing crisis in an attempt to remove the bias in our estimates from the possibility that some children may inherit poor financial habits from their parents. These habits could have prevented them from becoming homeowners regardless of their preferences.
We start by hypothesizing that the financial crisis led to unanticipated negative homeownership experiences that are not necessarily strongly correlated with the financial acumen of many households. The financial crisis was preceded by a dramatic rise in real estate prices, and the extent to which the rise in prices occurred varied across US states. Adult homeowners living in states that experienced the highest increase in housing prices during the years prior to the crisis were relatively more exposed to declines in local real-estate values when the housing bubble burst. We exploit these state-level differences in the extent of the mortgage bubble to identify the effects of the crisis on children’s homeownership rates from exposure to varying levels of the housing bubble. To calculate the extent of the bubble in different states, we use state-level CoreLogic home-price-index data. We divide states into quartiles based on the percentage increase in home prices2 from 2002 to 2006. We use this time period to capture the rise in housing prices from the period after the 2001 recession to their peak in early 2006. The first quartile comprises areas with the smallest percentage change in house prices and the fourth quartile comprises areas with the largest, so that the states most affected by the housing bubble will be in the fourth quartile.
We split our sample into those who experienced a maximum observed level of mortgage distress before the crisis and those who experienced it during or after the crisis (using January 2009 as the point of transition). We focus on children who moved out of state to remove the bias of exposure to similar local economic conditions, and we estimate the effects of children in home-price-increase quartiles two through four relative to children in the first quartile. Figure 3 presents a graphical view of the estimates for child movers coming from a household with mortgage distress either before the crisis period (“noncrisis group”) or during or after the crisis (“crisis group”) within each quartile.
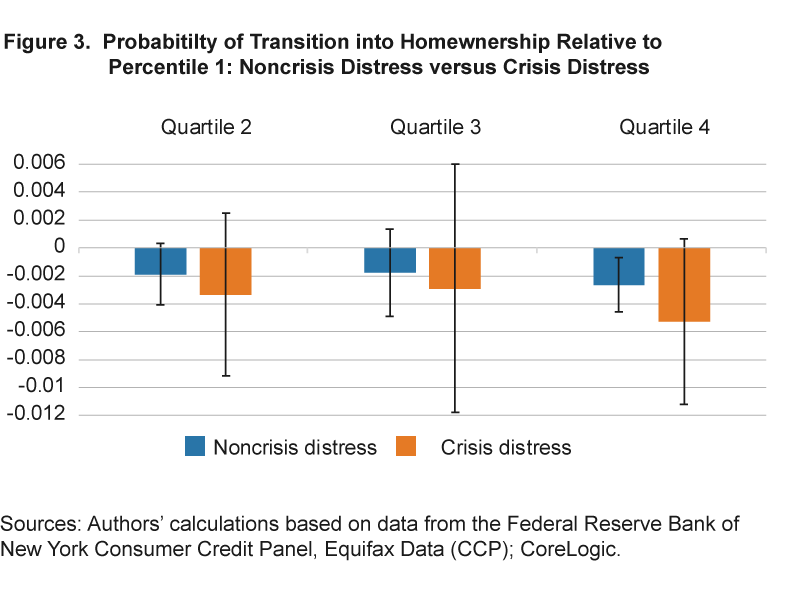
The negative effects of adult mortgage distress are largest in the fourth quartile for both crisis and noncrisis groups. Importantly, the effect is larger for crisis-group children in the fourth quartile of home-price change than for the noncrisis group. The negative effects are similar for both groups for the third quartile. The estimate on the crisis group is weakly statistically significant and is roughly double that of the noncrisis group, and the fourth quartile estimate for the crisis group is statistically significant at the 10 percent level while the other quartiles are not statistically significant at all for the crisis group. These results suggest that the financial crisis did have a greater differential effect on children’s homeownership preferences, and we see a relatively greater negative effect on homeownership for children from states most exposed to the mortgage bubble. Since the crisis may have affected adults’ ability to repay their mortgage regardless of financial acumen, we interpret this finding as evidence that child inheritance of financial habits from their parents does not fully explain the decline in homeownership.
To contextualize the potential economic impact of these results, we use regression analysis to estimate the effect that adult mortgage distress has on the probability of child homeownership by age 30. The estimate is −0.105 and statistically significant. This means that parental distress correlates with a decrease in the odds of a child’s homeownership at age 30 by roughly 10 percent. We want to look at this in terms of unanticipated distress as a result of the crisis. The sample used to estimate this effect contains a total of 52,473 adult homeowners. According to the Census (2012), mortgage delinquency rates were 4.5 percent prior to the financial crisis, and then they peaked in 2009 at 9.4 percent. If we take the difference, we can estimate that roughly 4.9 percent of households experienced unanticipated mortgage distress as a result of the crisis, which comes out to roughly 2,571 households in our data. Our above estimate implies that 270 of these households correspond to a child who will not transition into homeownership by age 30. The Current Population Survey shows that there were 52,884,000 family-owned households in 1999 (corresponding to the first observable quarter of our data; see Census Bureau, 2000). If we assume our data consist of a random sample of all family households in the United States, then we can convert our numbers to a population estimate. The population reduction in child homeownership by age 30 is 272,088 children who do not own a home by age 30 due to unanticipated mortgage distress, roughly equivalent to a 0.5 percent reduction in child homeownership by age 30.
Down Payment Help, Poor Credit Scores, and Wealth Transfers
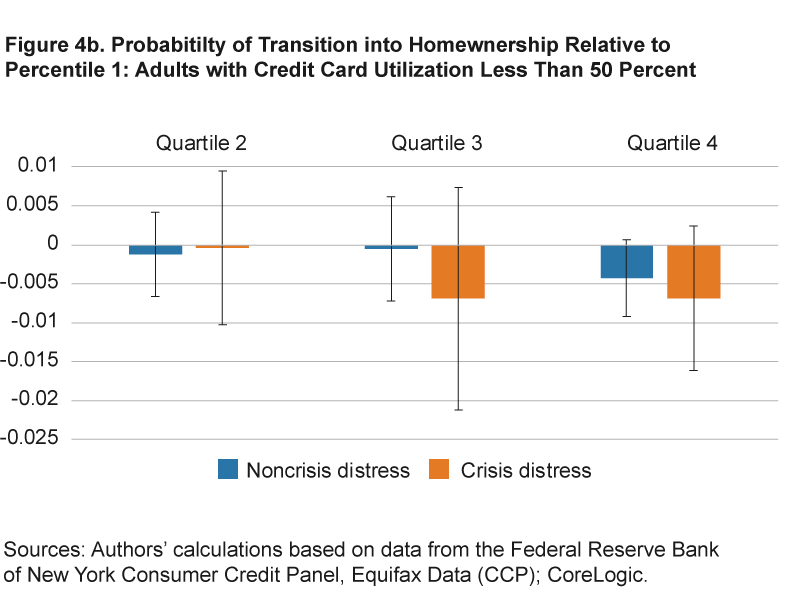
As there are other plausible explanations for a child to delay homeownership, we explore two of these in order to add robustness to our results. One possibility could be that parents who were unable to make their mortgage payments also did not have enough money to help their child with a down payment, and that lack of financial support was enough to prevent the child from buying a home. Another possibility is that the child did not have a sufficiently strong credit score in order to get a mortgage loan approved. We explore these alternative explanations by controlling for the credit constraints of the adult at the time the child is 19 years of age and controlling for the credit score of the child during the sample period. We then estimate the effects of distress on the subsample of children whose adult guardian had a maximum observable credit card utilization rate of less than 50 percent (our measure of adults who are not credit-constrained), as well as the subsample of children with a minimum observable credit score greater than 660. By doing this, we reduce the probability of a child not starting a mortgage because of the parents’ inability to help or because of the child’s poor credit characteristics. We repeat the regression that estimates the effect of the financial crisis on these subsamples, as this is our strongest test. Figures 4a and 4b give a graphical display of our estimates.
Figure 4a displays the results when restricting the sample to children whose risk score is always greater than 660 across the duration of our sample. Overall, the effects on parental mortgage distress on child homeownership are always larger for adults experiencing mortgage distress during or after the crisis. Focusing on the fourth-quartile subsample of home-price increases, the estimate of the effect is −0.136 for the crisis group and −0.00431 for the noncrisis group. The negative effect on movers in the crisis group from the fourth quartile relative to the reference group is roughly 31 times larger than the effect on the noncrisis group. Additionally, the effect is statistically significant only for the crisis group.
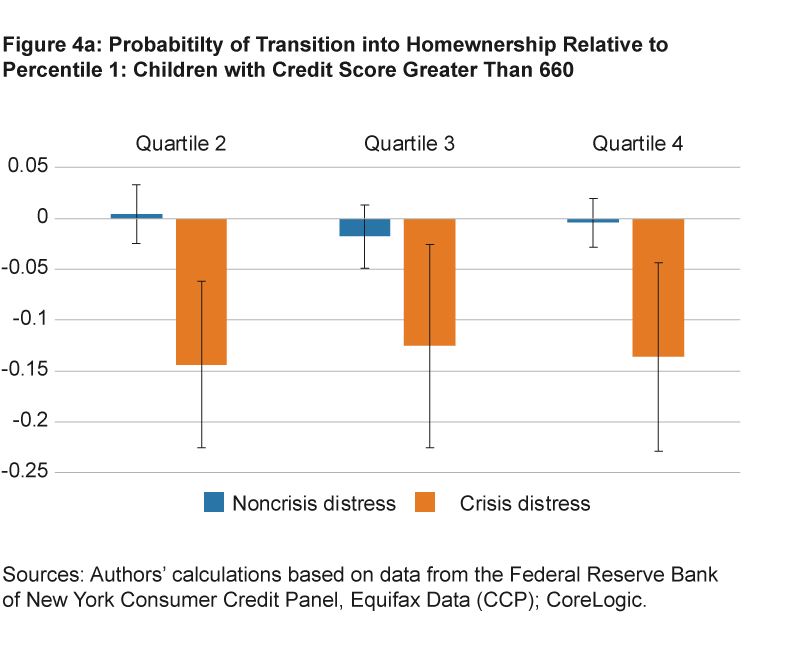
Figure 4b shows the results when restricting the sample to children coming from households in which the adult had a maximum credit card utilization rate of less than 50 percent at the time the child first enters into our data. Although we do not find statistical significance on our estimates for adults experiencing mortgage distress during the crisis, the estimates of the effect on child homeownership for the crisis group are 1.25 times to 1.5 times larger than the estimates for comparable children in the noncrisis group. These tests of adult credit constraints and children’s credit risk provide some robustness to our results.
As mentioned previously, we are not able to address the wealth-transfer channel between adult and child with our data. If the adult experiences mortgage distress, then it is likely that he or she does not have enough cash or home equity to make payments on his or her mortgage loan nor to directly finance the child’s mortgage. While we are able to control for adult credit constraints, our approach does not capture the noncredit wealth of the adult (such as assets owned). Our data do not allow us to control for the possibility that there is a wealth-transfer channel that could be driving our results. We also do not observe the income of the child in our data. If the child has sufficiently low levels of income, he or she might not earn enough to open a mortgage. Future work should attempt to address these issues in order to distinguish between the preferences channel and the wealth-transfer or income channels.
Conclusion
This Commentary documents the negative correlation between adult mortgage distress and their offspring’s homeownership rates. Homeownership has been in a sizable decline over the past decade, and this decline is especially pronounced among young adults from ages 25 to 44. We use a proprietary panel data set to construct households by linking adults and their children. We then follow children beginning at age 19 and track their mortgage loan outcomes conditional on mortgage distress experienced by the adult guardian. We test the effects of this distress on the length of time it takes for a child to transition into homeownership. We attempt to remove the biases of exposure to similar local economic conditions relative to the parent, inheritance of poor financial habits, and borrowing constraints on the child and the parent.
We find a correlation between parents’ experiences and the child’s probability of homeownership. Our results suggest that adult experiences may explain as much as a 0.5 percent decline in the probability of child homeownership by age 30. It is important for policymakers to understand how spillover effects on the preferences of subsequent generations may have implications for the macroeconomy. It is possible that wealth-transfer effects could be driving our results, and future work on this topic should attempt to distinguish between the wealth-transfer effects and preference effects.
Footnotes
- Haughwout, Peach, and Tracy (2017). Return
- We use CoreLogic home-price-index data for single-family detached homes. Return
References
- Bleemer, Zachary, Meta Brown, Donghoon Lee, and Wilbert van der Klaauw. 2014. “Debt, Jobs, or Housing: What’s Keeping Millennials at Home?” Federal Reserve Bank of New York, Staff Report No. 700.
- Brown, James R., J. Anthony Cookson, and Rawley Z. Heimer. 2019. “Growing Up Without Finance.” Journal of Financial Economics, 134(3): 591–616.
- Cesarini, David, Magnus Johannesson, Paul Lichtenstein, Orjan Sandewall, and Bjorn Wallace. 2010. “Genetic Variation in Financial Decision-Making.” Journal of Finance, 65(5): 1725–1754.
- Dettling, Lisa J., and Joanne W. Hsu. 2014. “Returning to the Nest: Debt and Parental Co-Residence among Young Adults.” FEDS Working Paper No. 2014-80. http://dx.doi.org/10.2139/ssrn.2511411.
- Dokko, Jane, Geng Li, and Jessica Hayes. 2015. “Credit Scores and Committed Relationships.” Board of Governors of the Federal Reserve System, Finance and Economics Discussion Series No. 2015-081. http://dx.doi.org/10.17016/FEDS.2015.081.
- Ghent, Andra C., and Marianna Kudlyak. 2016. “Intergenerational Linkages in Household Credit.” Federal Reserve Bank of San Francisco, Working Paper No. 2016-31. http://www.frbsf.org/economic-research/publications/working-papers/wp2016-31.pdf.
- Grawe, Nathan D., and Casey B. Mulligan. 2002. “Economic Interpretations of Intergenerational Correlations.” Journal of Economic Perspectives, 16(3): 45–58.
- Haughwout, Andrew, Richard Peach, and Joseph Tracy, 2017. “A Close Look at the Decline of Homeownership.” Federal Reserve Bank of New York, Liberty Street Economics (February 17). http://libertystreeteconomics.newyorkfed.org/2017/02/a-close-look-at-the-decline-of-homeownership.html.
- Kusisto, Laura. 2017. “Sluggish Housing Recovery Took $300 Billion Toll on US Economy, Data Show.” The Wall Street Journal (March 26). https://www.wsj.com/articles/sluggish-housing-recovery-took-300-billion-toll-on-u-s-economy-data-show-1490526643.
- Malmendier, Ulrike, and Stefan Nagel. 2011. “Depression Babies: Do Macroeconomic Experiences Affect Risk Taking?” The Quarterly Journal of Economics, 126(1): 373–416. https://doi.org/10.1093/qje/qjq004.
- US Census Bureau. 2012. “Mortgage Originations and Delinquency and Foreclosure Rates: 1990 to 2010.” Statistical Abstract of the United States: 2012, Table 1194.
- US Census Bureau. 2000. Current Population Survey, 1999. “Annual Social and Economic Supplement, Table H1. Households, by Type, Tenure, and Race and Hispanic Origin of Householder: March 2000.” Last Revised: April 3, 2017. https://www.census.gov/data/tables/1999/demo/families/families-living-arrangements.html.
Suggested Citation
Fritsch, Nicholas, and Rawley Z. Heimer. 2020. “Intergenerational Homeownership and Mortgage Distress.” Federal Reserve Bank of Cleveland, Economic Commentary 2020-12. https://doi.org/10.26509/frbc-ec-202012
This work by Federal Reserve Bank of Cleveland is licensed under Creative Commons Attribution-NonCommercial 4.0 International

