- Share
The Labor-Market Skills of Foreign-born Workers in the United States, 2007–2017
Various measures of the labor-market skills of foreign-born workers have improved during the past decade. The largest gains are concentrated among immigrants from Mexico, who traditionally have shown the lowest skill levels among foreign-born workers. The data suggest that the apparent increase in skills is the result of a shift in the distribution of immigrants coming to the United States, with increased immigration of workers from Asia and a precipitous decline in immigration of workers from Mexico.
The views authors express in Economic Commentary are theirs and not necessarily those of the Federal Reserve Bank of Cleveland or the Board of Governors of the Federal Reserve System. The series editor is Tasia Hane. This paper and its data are subject to revision; please visit clevelandfed.org for updates.
A recurrent concern in the debate on immigration among economists and in the press is the perception that the labor-market skills of immigrants coming to the United States have deteriorated in recent years.1 The command of English among recent immigrants, mostly from Asia, Central and South America, and Mexico, is said to be poor, as is the average level of educational attainment of immigrants from Central and South America and especially Mexico.2 Low English proficiency and low educational attainment could constrain the earning potential of immigrant workers relative to native workers and consequently impede their successful assimilation into the American labor market.
In this Commentary I analyze data on the foreign-born population to investigate these claims. I use data from the American Community Survey for 2007 and 2017 to calculate the contribution of foreign-born individuals to the growth of the US population and the US workforce (individuals aged 16 to 64 years). I then determine the rates of educational attainment and English proficiency among immigrants by area of origin and estimate the earning potential of these groups relative to native workers.3 The data suggest that, contrary to the common perception, the skills of foreign-born workers, on average, have improved during the past decade.
A potential explanation for the observed improvement in labor-market skills, however, appears to be related to changes in the composition of immigrants who arrived between 2008 and 2017. In particular, a number of factors, including the increase in border enforcement during the past couple of decades, have reduced the immigration of Mexican workers, who traditionally rank lowest among immigrant workers across all of the measures of labor-market skills considered here, consequently improving the average quality of immigrant workers.
Numbers and Origins of Foreign-born Individuals
Analyzing data from the American Community Survey, I first estimate the share of the total US population that is foreign born and assess whether this share has changed during the last decade. I find that in 2017, foreign-born individuals constituted almost 14 percent of the US population of approximately 317.6 million people.4 That share is slightly higher than in 2007, when the share of foreign-born individuals was almost 13 percent of the total US population of about 293.5 million people.5
Although the foreign-born share of the population seems to have increased only slightly, the rate at which this population grew during the decade was nearly double that of the native-born population. From 2007 to 2017, the native-born population grew by 6.9 percent, while the foreign-born population grew by 17 percent. That relatively rapid growth was responsible for 2.2 percentage points of the total US population’s growth of 8.2 percent.
The relevance of the foreign-born population for the US economy is more clearly understood when considering the working-age population (defined as individuals aged 16 to 64 years). In 2017, about 1 in 6 workers, or 17.2 percent of total US workers, were foreign-born individuals. As shown in table 1, this figure represents about 35 million foreign-born individuals of working age. In turn, native-born individuals of working age totaled 168.4 million.
Table 1 further illustrates that most of the foreign-born population consists of working-age individuals: Nearly 80 percent of the foreign-born population is between the ages of 16 and 64, far exceeding the 61.5 percent of the US-born population that is of working age. Moreover, the foreign-born population is concentrated in the prime-working-age range of 25 to 54 years of age (figure 1): About 58 percent of the total foreign-born population is of prime working age, whereas this proportion among the native-born population is only about 37 percent.
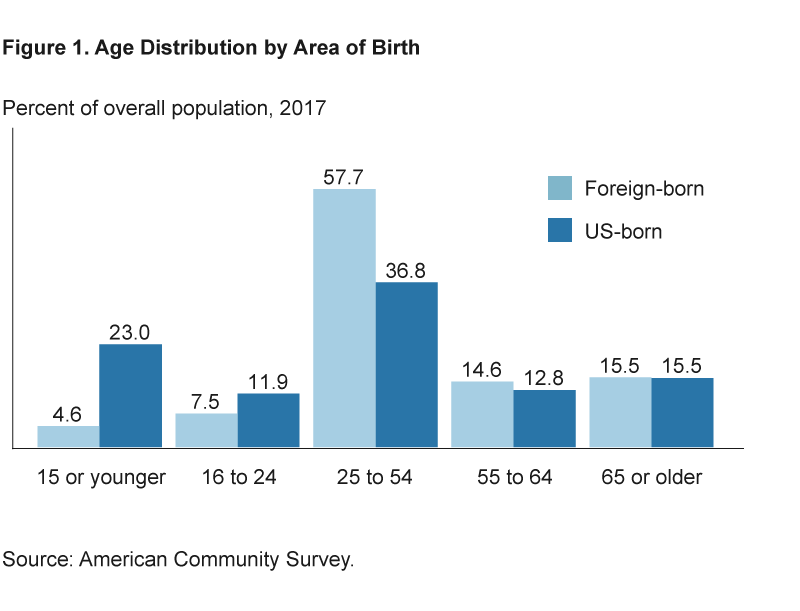
Table 1. Population by Area of Origin
| Total number of people (millions) a 2007 |
Number of working-age individuals (millions) b 2007 |
Share of working-age population (percent) b/a 2007 |
Total number of people (millions) c 2017 |
Number of working-age individuals (millions) d 2017 |
Share of working-age population (percent) d/c 2017 |
|
|---|---|---|---|---|---|---|
| US total population | 293.5 | 192.5 | 65.6 | 317.6 | 203.4 | 64.0 |
| US-born population | 256.1 | 161.8 | 63.2 | 273.9 | 168.4 | 61.5 |
| Foreign-born population | 37.4 | 30.7 | 82.1 | 43.8 | 34.9 | 79.8 |
Note: Working age is 16 to 64 years.
Source: Author’s calculations with data from the American Community Survey.
The population of foreign-born workers grew rapidly from 2007 to 2017 compared to that of native-born workers.6 As can be gleaned from table 1, the population of foreign-born workers increased by 13.7 percent, while the number of native-born workers increased by 4.1 percent. The growth in the number of foreign-born workers contributed 2.2 percentage points to the total US workforce growth of 5.7 percent, while native-born workers contributed 3.5 percentage points.7
Changes in Migration from Mexico and Asia
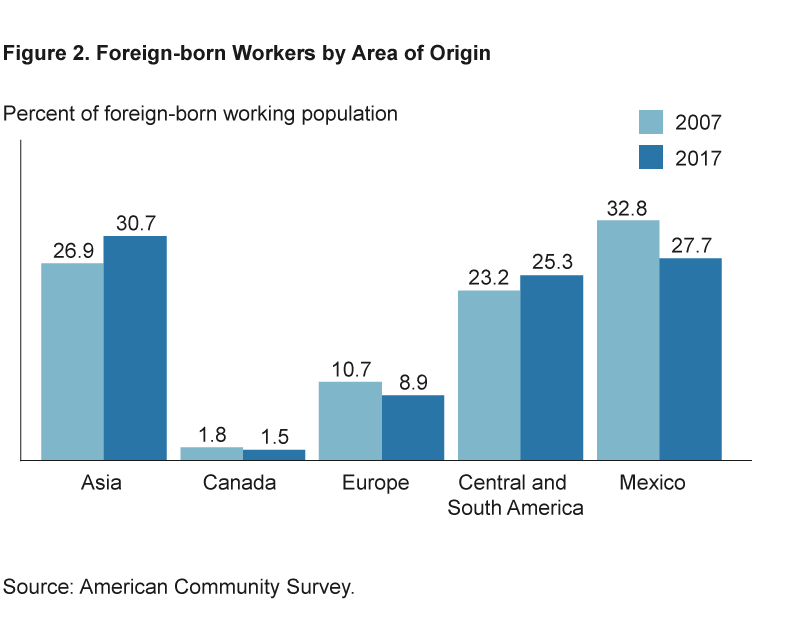
Figure 2 illustrates the distribution of the foreign born by area of origin in 2007 and 2017. As shown in the figure, foreign-born workers in the United States have arrived primarily from Mexico, Asia, and Central and South America. However, from 2007 to 2017 the share of all foreign-born workers arriving from Mexico declined from 33 percent to 28 percent. Meanwhile, the share of working-age immigrants who arrived from Asia increased from 27 percent to 31 percent during the same period. The proportion from Central and South America also increased, albeit more modestly, from 23 percent to 25 percent. The shares of immigrant workers from Europe and Canada changed only slightly during the period and continue to represent a small fraction of the foreign-born working-age population.
Indicators of Labor-Market Skills
To assess the labor-market skills of immigrant workers I focus on three basic indicators: educational attainment, English proficiency, and earning potential. I compare these measures during the past decade and across areas of origin.8
Educational Attainment
Determining the educational attainment of foreign-born individuals poses challenges. We don’t know where foreign-born workers obtained their education, and we cannot guarantee that the educational attainment level they report in the American Community Survey is equivalent to a similar attainment level reported by a native worker. Additionally, I do not control for other characteristics, such as workers’ ages or year of arrival; I simply compare the unconditional averages of the distributions.
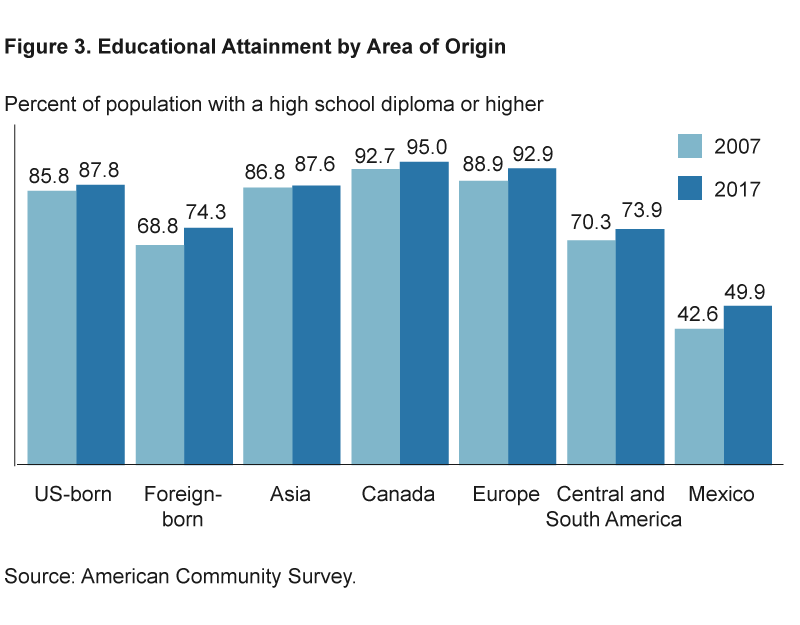
A straightforward measure of educational attainment is the proportion of individuals who have completed at least a high-school education (that is, individuals who have a high-school diploma or better).9 Plotting this measure, figure 3 shows the distribution of educational attainment of native- and foreign-born workers in the United States in 2007 and 2017.
The most salient feature among the foreign-born population is that although the educational attainment of foreign-born workers as a whole is only moderately below that of US-born workers, there is great disparity among workers from different areas of origin.
Almost 88 percent of US-born workers had a high-school diploma or higher in 2017, whereas only about 74 percent of foreign-born workers did. Across different areas of origin, immigrants from Asia, Canada, and Europe exhibit, on average, levels of educational attainment that are similar to or higher than US-born workers, while immigrants from Central and South America and Mexico show considerably lower levels of educational attainment. Immigrant workers from Mexico in particular exhibit the lowest levels of educational attainment, with only about 50 percent of workers having an education of high school or better in 2017.
Figure 3 also shows that between 2007 and 2017, the level of educational attainment increased for both US-born and foreign-born workers, almost uniformly across immigrants from different regions of the world. The educational attainment of foreign-born workers increased by 5.5 percentage points, while the educational attainment of US-born workers increased by 2 percentage points. Interestingly, among foreign-born workers, the largest gains in education occurred among Mexican immigrants, with an increase of 7.3 percentage points.
English Proficiency
A lack of English proficiency is thought to be one of the largest hurdles to assimilating immigrants into the US workforce and broader society, as it may prevent access to better-paying jobs and delay the convergence of an immigrant’s wage and salary earnings to those of native workers.
Figure 4 represents the rate of English proficiency among US-born workers and various groups of foreign-born workers by area of birth. I define the rate of English proficiency as the proportion of people who speak English well or very well or speak only English (as self-reported in the survey).
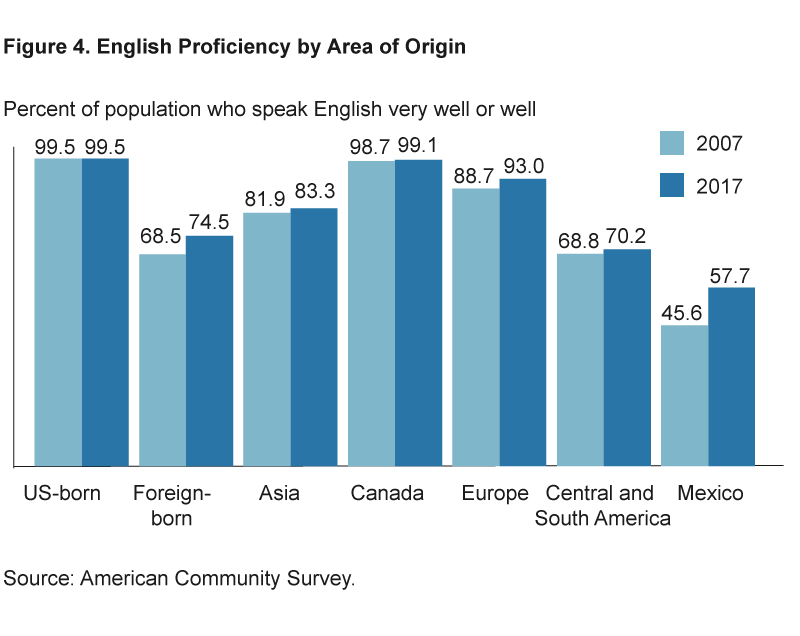
On average, the English proficiency rate of the foreign-born increased from 68.5 percent in 2007 to 74.5 percent in 2017, an increase of 6 percentage points. But there are large differences in the gains attained by immigrants from different parts of the world. The proficiency rate of immigrant workers from Europe increased by 4.3 percentage points, while that of immigrants from Asia and Central and South America had similar modest gains of 1.4 percentage points. Immigrants from Canada, not surprisingly, have sustained a stable and elevated rate of English proficiency of about 99 percent.
Assimilation delays because of poor English proficiency among Mexican-born individuals have been of particular concern among economists (Lazear, 2007). The data indicate, however, that while Mexican-born workers exhibit the lowest rate of English proficiency among foreign-born workers, they showed the largest gains in proficiency, on average, during the last decade, with improvements of 12.1 percentage points.
Earning Potential
Another indicator of workers’ skills is earning potential, which I measure in terms of the median annual wage and salary earnings of foreign-born workers relative to native workers.
Figure 5 plots this measure as the percentage difference between the group of interest and native-born workers. Negative numbers indicate that the median annual earnings of the immigrant group are below those of US-born workers, while positive numbers indicate that their median annual earnings exceed those of US-born workers. For example, in 2007, immigrant workers from Central and South America had median annual earnings that were 16.7 percent below those of US-born workers; in contrast, immigrant workers from Canada had annual earnings that were 50 percent higher than US-born workers.
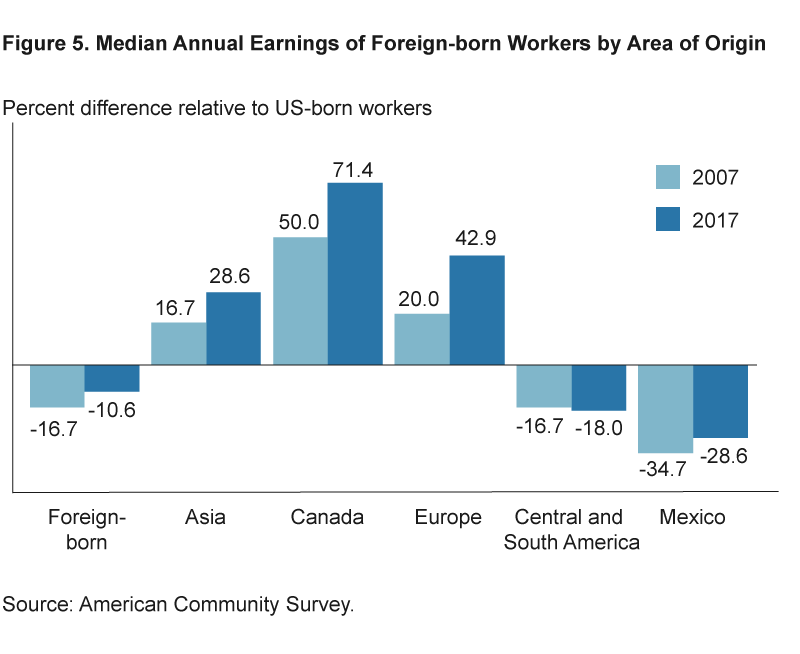
Figure 5 illustrates that foreign-born workers have seen considerable improvements in earning potential. Although in 2017 the median annual earnings of foreign-born workers remained below those of US-born workers, their earning potential had increased by 6.1 percentage points since 2007. Canadian and European workers experienced the largest gains in earning potential, with gains of 21.4 percentage points and 22.9 percentage points, respectively. Immigrants from Asia and Mexico also saw considerable gains of 11.9 percentage points and 6.1 percentage points, respectively. The only group that experienced a deterioration of earning potential was that of immigrant workers from Central and South America: Their earning potential declined by 1.3 percentage points.
What’s behind the Improvement in Immigrants’ Skills?
The results discussed in this Commentary suggest that, on average, the labor-market skills of foreign-born workers have remained stable or improved during the past decade. An improvement in these basic measures of labor-market skills is of considerable importance because such skills facilitate the assimilation of foreign-born workers into the US workforce, especially as aging or retiring native-born workers continue to exit the workforce.
The largest gains in these measures appear to be concentrated in the immigrant population from Mexico. The reason for this improvement, however, seems to be associated with a dramatic decline in the flow of immigrants from Mexico during the past decade (documented, for example, in Passel, Cohn, and Gonzalez-Barrera, 2012). The decline in immigration from Mexico appears to have been a response primarily to two factors, as suggested by Hanson, Liu, and McIntosh (2017) and Villareal (2014): a decline in US demand for Mexican workers following the Great Recession and the increase in border enforcement during the past two decades.
Changes in US Demand for Workers after the Great Recession
Hanson, Liu, and McIntosh (2017) observe that since the onset of the Great Recession (around December 2007), the net inflows of undocumented immigrants, especially from Mexico, have declined in absolute terms. The fact is noteworthy because Mexican immigrants traditionally have been at the bottom of the labor-market-skills distribution. Similarly, Villareal (2014) notes that the rate of Mexican migration to the United States has declined precipitously in recent years, particularly among younger, less-educated workers. Given the large proportion of Mexican-born immigrants among the foreign-born, a decline in the share of people immigrating from Mexico contributes not only to the observed improvement in labor-market skills among those Mexicans who do immigrate to the United States but also to the observed improvement of skills in the overall foreign-born population.
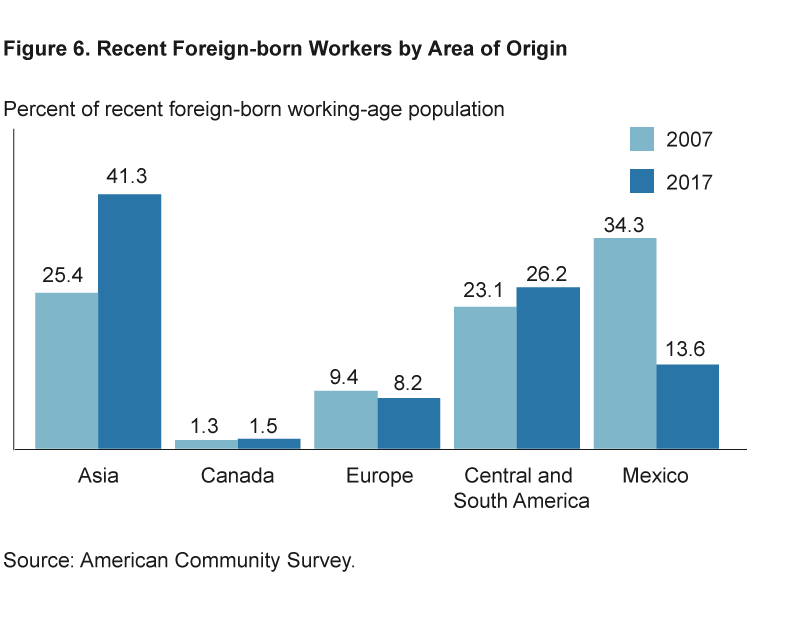
In fact, the number of Mexican-born workers who arrived in the United States between 2008 and 2017 decreased 67.2 percent compared to the number who arrived between 1998 and 2007 (falling from 3.6 million to 1.2 million). Meanwhile, the number of immigrant workers arriving from Asia increased from 2.7 million during 1998–2007 to 3.6 million during 2008–2017. Consequently, the composition of foreign-born workers who arrived during the 2008–2017 decade has shifted in favor of Asia and currently exhibits a dramatically lower proportion of Mexican-born immigrants. This is shown in figure 6, which illustrates proportions of foreign-born workers from different areas relative to the total population of foreign workers who arrived in the decades prior to 2007 and 2017, respectively.10 The share of all foreign-born workers arriving from Mexico declined from about 34 percent in the decade prior to and up to 2007 to about 14 percent in the decade prior to and up to 2017. At the same time, the proportion of working-age immigrants arriving from Asia in the prior decade increased from about 25 percent to about 41 percent.
Villareal (2014) finds that a strongly significant factor behind the decline in immigration from Mexico is a decline in US demand for Mexican workers following the Great Recession, a decline that has been concentrated in sectors that have traditionally employed the largest proportion of Mexican-born workers, such as construction, manufacturing, leisure and hospitality, and professional and business services. He also finds that other factors, namely improvements in the Mexican economy and demographic changes in Mexico, have not significantly affected the migration rate.
Increased Border Enforcement
A second potential explanation behind the change in the composition of immigrants is that during the past two decades, and especially in recent years, immigration enforcement has intensified, particularly along the southwest border, as illustrated by the rise in the number of border patrol agents in this area (see figure 7). Hanson, Liu, and McIntosh (2017) and Villareal (2014) note that an increase in border enforcement tends to reduce the population of undocumented immigrants, and because undocumented workers are predominantly low-skilled, a decline in their numbers relative to the total number of immigrants may also partially explain the apparent gains in the average skills described in this analysis.
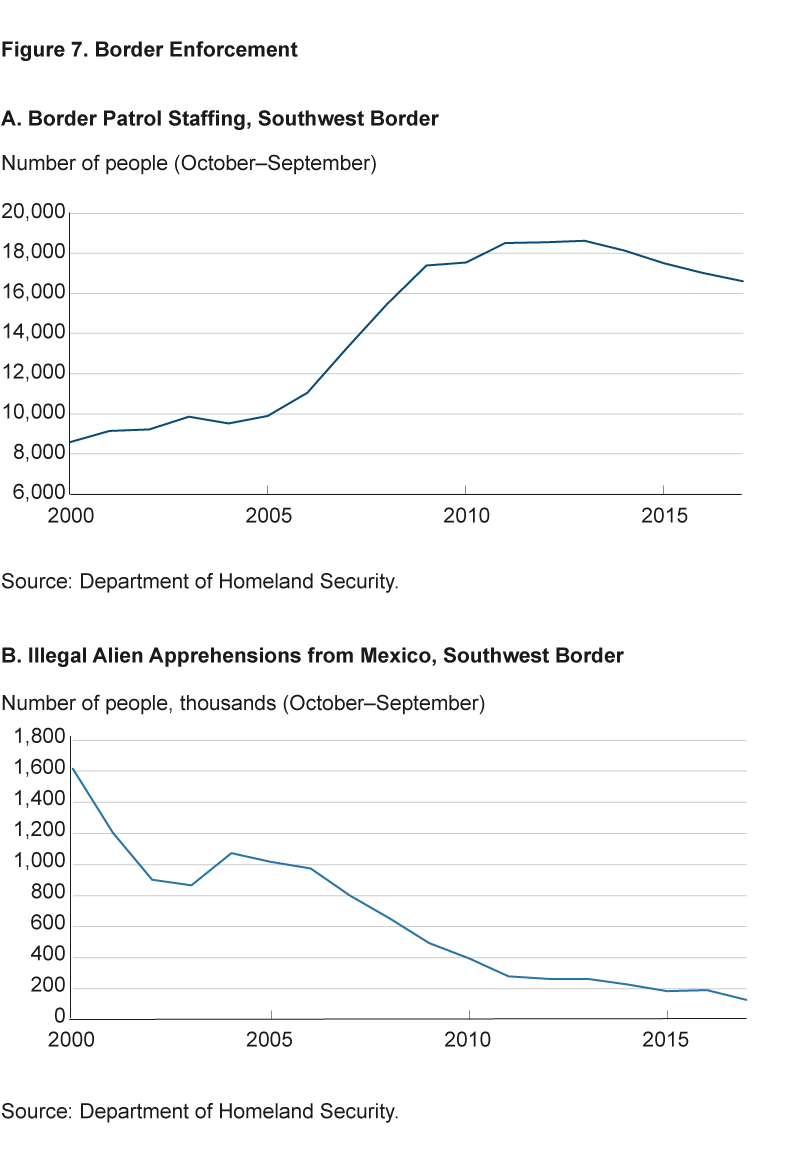
If the decline in immigrants from Mexico was primarily a response to the deterioration in economic opportunities in the United States after the Great Recession, the rate of migration might experience a recovery in the future, Villareal (2014) argues. However, as illustrated in figure 7, the decline in migration from Mexico, reflected in the downward trend in apprehensions of illegal aliens from Mexico along the southwest border, also seems to be a response to the tightening of border enforcement, suggesting that as long as immigration enforcement remains elevated, the rate of migration from Mexico is likely to remain depressed.
Footnotes
- Abramitzky and Boustan (2017) note “the major difference between the past and present is that, circa 1900, typical long-term immigrants held occupations similar to the native born, even upon first arrival, whereas today the average immigrant earns less than natives upon arrival to the United States.” LaLonde and Topel (1991) note that an important concern is that “the typical new immigrant may bring skills (including language, culture, and educational attainment) that are less attuned to the American [labor] market.” Finally, Lazear (2007) notes that “immigrants to the United States from Mexico become assimilated into American society much less rapidly than do other groups.” Return
- These facts are illustrated in figures 3, 4, and 5. Return
- The foreign-born population are people who were born outside of the United States, Puerto Rico, or US territories and were not US citizens at the time of birth. The native-born population are people who were born in the United States, Puerto Rico, US territories, or overseas and were US citizens at the time of birth. Return
- This figure excludes Puerto Rico and other nonstate territories. Return
- In this article I use the 1-year files of the American Community Survey to calculate the various estimates. The most recent data are for 2017 and I compare statistics with 2007. The 1-year files represent a 1 percent sample of the national population, and all statistics are calculated with a margin of error (see Census Bureau, 2017). The focus is on the civilian population not in group quarters. Estimates were calculated in R (version 3.5.0) using primarily the lodown (Damico, 2018b) and survey (Lumley, 2018) packages, which utilize the appropriate replicate weights of the complex survey design to reproduce official estimates. See Damico (2018a) for more details on calculating statistics from a complex survey design. Return
- In this analysis, I use the term workers to refer to individuals of working age. While the American Community Survey contains information about employment status at the time of the survey, it is not possible to determine whether individuals were employed over a span of multiple years. Return
- Growth figures can be calculated from table 1 by calculating the increase between columns (b) and (d). Return
- The information on education, language proficiency, and median annual earnings is based on self-reports to the American Community Survey. Return
- One could consider alternatively the average number of years of formal education as the measure of educational attainment, and the results would be qualitatively similar. Return
- Note that figure 6 differs from figure 2 in that figure 6 includes only the populations of foreign-born immigrants who arrived in the United States during the decades prior to 2007 and 2017, whereas figure 2 compares populations of immigrants who arrived at any time before 2007 and 2017. Return
References
- Abramitzky, Ran, and Leah Boustan. 2017. “Immigration in American Economic History.” Journal of Economic Literature, 55 (4): 1311–45. https://doi.org/10.1257/jel.20151189.
- Census Bureau. 2017. “American Community Survey. Accuracy of the Data.” https://www2.census.gov/programs-surveys/acs/tech_docs/accuracy/ACS_Accuracy_of_Data_2017.pdf.
- Damico, Anthony. 2018a. “Analyze Survey Data for Free.” http://asdfree.com/.
- Damico, Anthony. 2018b. “lodown: Locally Download and Prepare Publicly-Available Microdata.” https://github.com/ajdamico/lodown.
- Hanson, Gordon, Chen Liu, and Craig McIntosh. 2017. “The Rise and Fall of US Low-Skilled Immigration.” Brookings Papers on Economic Activity, 83–151. http://www.jstor.org/stable/90013169.
- LaLonde, Robert J., and Robert H. Topel. 1991. “Immigrants in the American Labor Market: Quality, Assimilation, and Distributional Effects.” The American Economic Review, 81 (2): 297–302. http://www.jstor.org/stable/2006873.
- Lazear, Edward P. 2007. “Mexican Assimilation in the United States.” In Mexican Immigration to the United States. The University of Chicago Press.
- Lumley, Thomas. 2018. “survey: Analysis of Complex Survey Samples.” https://cran.r-project.org/web/packages/survey.
- Passel, Jeffrey, D’Vera Cohn, and Ana Gonzalez-Barrera. 2012. “Net Migration from Mexico Falls to Zero—and Perhaps Less.” Pew Hispanic Center. https://www.pewresearch.org/wp-content/uploads/sites/5/2012/04/PHC-Net-Migration-from-Mexico-Falls-to-Zero.pdf.
- Villareal, Andrés. 2014. “Explaining the Decline in Mexico-US Migration: The Effect of the Great Recession.” Demography, 51 (December): 2203–28. http://doi.org/10.1007/s13524-014-0351-4.
Suggested Citation
Hernández-Murillo, Rubén. 2020. “The Labor-Market Skills of Foreign-born Workers in the United States, 2007–2017.” Federal Reserve Bank of Cleveland, Economic Commentary 2020-10. https://doi.org/10.26509/frbc-ec-202010
This work by Federal Reserve Bank of Cleveland is licensed under Creative Commons Attribution-NonCommercial 4.0 International


