

- Share
12 Facts about Temporary Urbanists
Urban areas seem to be enjoying a renaissance of sorts due in part to the many young professionals who have moved into central neighborhoods since the 2000s. Many of these young professionals are thought to move back out after they have started families, but the details of these migration patterns are not well-known. I analyze data from the Federal Reserve Bank of New York/Equifax Consumer Credit Panel to answer 12 questions about these temporary urbanists—those who choose to move into an urban neighborhood and spend part of their early adulthood there.

The views authors express in Economic Commentary are theirs and not necessarily those of the Federal Reserve Bank of Cleveland or the Board of Governors of the Federal Reserve System. The series editor is Tasia Hane. This paper and its data are subject to revision; please visit clevelandfed.org for updates.
In the collective imagination, many young American professionals are temporary urbanists. These young adults, as the popular view would have it, move into a dense central neighborhood of some major city after college, enjoy a short commute and urban amenities, establish their careers, and find a spouse. As they reach their early 30s, their priorities change, and they leave the inner city for the suburbs in search of larger houses and high-achieving schools for their children. We think of these individuals not just as “urbanites,” a word for anyone living in an urban neighborhood, but as “urbanists,” which implies they have knowledge of, affection for, and a willingness to advocate for urban areas. This assumption is reasonable considering that most of these young professionals could afford housing elsewhere, so their choosing to live in urban neighborhoods suggests they value that experience.
While many of us could name several people we know who fit this pattern, it is more difficult to attach hard numbers to the phenomenon. We would like to be able to answer questions such as how many temporary urbanists are there? How long do they stay in urban neighborhoods? Do they own homes while they are in those neighborhoods, or do they become first-time buyers only when they leave? The answers to these types of questions could shape public and private investment and strategies for engaging the current and former residents of urban neighborhoods.
To identify temporary urbanists, you must be able to observe them moving into and out of an urban neighborhood. Most publicly available demographic data, including census data, are cross-sectional, which means temporary urbanists cannot be distinguished from other young adults, and so we have very little quantitative information about them. One of the few data sources that can identify temporary urbanists is the Federal Reserve Bank of New York/Equifax Consumer Credit Panel (CCP). In this Commentary, I use the CCP to answer 12 questions about temporary urbanists.
Data and Definitions
The Federal Reserve Bank of New York/Equifax Consumer Credit Panel (CCP) is a 5 percent sample drawn from a database of 220 million Americans’ credit records. The CCP reports the census tract individuals were living in each year along with their ages and the balances on their mortgages and other debts.
To identify temporary urbanists, I first select from the CCP everyone who was between the ages of 23 and 32 from 1999 to 2018. These people were born between 1976 and 1985. I then designate the census tracts in which those individuals have lived during the sample period as urban or nonurban and find anyone who began the period living in a nonurban census tract, moved at some point into an urban tract, and then moved back out to a nonurban tract.
For the purpose of this analysis, I designate two types of tracts as urban. The first is one in which the majority of the housing stock was built before World War II (WWII) and the population density is above 2,000 people per square mile. Tracts developed before WWII were usually designed for pedestrians, so walkable commercial districts were placed amid small residential parcels. The second type of tract that I designate as urban is one that was developed after WWII and that has a population density above 7,000 people per square mile—as high as that of the largest cities in the prewar era. These very dense tracts with newer housing could also support amenities people would associate with an urban environment, such as walkable retail and frequent public transit. Finally, I require that both types of tracts be in a metro area with a population of at least 500,000.
The individuals in this analysis are placed in urban or nonurban tracts based on the addresses reported to Equifax by their student loan servicers, credit card providers, and other lenders. Ideally, we would like to know if people grew up in a nonurban area, but unfortunately, people who grew up in the suburbs and started their credit usage after they moved to “the city” cannot be distinguished from people who grew up in the city. However, the large sample in the CCP enables us to observe more than 184,000 people who fit the definition of a temporary urbanist, allowing us to get a good sense of their characteristics.
1. How many temporary urbanists are there?
An estimate based on CCP data places the number of temporary urbanists in urban neighborhoods in a given year during the study period at 1.1 million. Because temporary urbanists live in nonurban neighborhoods both before and after their urban years, there are actually more of them in the suburbs. A CCP-based estimate suggests there are approximately 2.5 million temporary urbanists in nonurban neighborhoods during a typical year in the study period. The temporary urbanists in urban neighborhoods lived alongside millions of other 23 to 32 year-olds with other migration patterns. There are 1.5 million people who moved into an urban area and are not observed leaving. Three million young adults between the ages of 23 and 32 are observed always in urban neighborhoods. There are urban exiters who are first observed in an urban neighborhood, who move to a suburban neighborhood, and who remain there past age 32. Their population averaged 1.1 million during the study period. Finally, urban neighborhoods also have 644,000 “temporary suburbanites” who start and finish in an urban neighborhood but who spend some time living in a suburban neighborhood. Altogether, the credit panel data suggest there were 7.3 million people between the ages of 23 and 32 living in urban neighborhoods in an average year, and temporary urbanists were 15 percent of this total. Temporary urbanists are approximately 2 percent of urban residents of all ages, and 9.3 percent of each birth cohort.
2. Which metro areas have more temporary urbanists?
The highest counts of temporary urbanists are found in the nations’ most populous metro areas, such as New York, Los Angeles, and Chicago. If measured by temporary urbanists per million residents, some small and medium-sized metro areas are among those with the highest shares. These include Provo, Honolulu, Salt Lake City, and Denver.
There are few temporary urbanists relative to the population in places such as Atlanta, Nashville, and Charlotte because these metro areas have very few urban neighborhoods.
3. What cities attract temporary urbanists from other parts of the country?
The metro areas that have the highest per capita representation of in-migrant temporary urbanists are listed in table 1. Seven of the destination cities are on either the East or West Coast with the remainder in the Mountain West. The table is limited to metro areas with populations over 1 million (see the online appendix for a complete list). Smaller metro areas with high in-migration of temporary urbanists include Provo, Honolulu, Madison, Albany, and Colorado Springs.
| Top major metro origins | Out-migrant temporary urbanists per million residents | Top major metro destinations | In-migrant temporary urbanists per million residents | |
|---|---|---|---|---|
| Rochester, New York | 3,626 | San Diego, California | 8,265 | |
| Hartford, Connecticut | 3,246 | San Francisco, California | 7,997 | |
| Virginia Beach, Virginia | 2,957 | Washington, DC | 7,016 | |
| Austin, Texas | 2,421 | Denver, Colorado | 6,492 | |
| Providence, RhodeIsland | 2,419 | Boston, Massachusetts | 6,314 | |
| Riverside, California | 2,401 | Las Vegas, Nevada | 6,094 | |
| San Diego, California | 2,399 | San Jose, California | 5,324 | |
| Sacramento, California | 2,391 | Virginia Beach, Virginia | 5,280 | |
| Richmond, Virginia | 2,316 | Salt Lake City, Utah | 5,268 | |
| Orlando, Florida | 2,204 | Seattle, Washington | 5,003 |
Notes: Origin individuals are first observed living in a nonurban neighborhood of the metro area named in column one. They leave to live in an urban neighborhood in a different metro area. Destination individuals arrive from other metro areas and live in an urban neighborhood in the metro area named in column three. The data include people born between 1976 and 1985 and observed from 1999 to 2018.
Sources: Federal Reserve Bank of New York /Equifax Consumer Credit Panel, 2010 Decennial Census, American Community Surveys, and author’s calculations.
4. Which regions send off the most temporary urbanists to other metro areas?
If measured by population counts, the biggest sources of out-migrant temporary urbanists are, again, the very populous regions. These include New York, Washington (DC), Los Angeles, and Philadelphia. Table 1 reports the top metro areas by the number of temporary urbanists they produced per million residents. After scaling, the top sources are primarily less urbanized medium-size metro areas, such as Hartford (17 percent urban), that are in the same region as larger, highly urbanized areas, such as New York (62 percent urban). Smaller metro areas that also feed the destination regions include Syracuse, Portland (Maine), Durham, Worcester, and Bridgeport.
5. What share of temporary urbanists comes from local suburbs, rural areas, or a different major metro area?
Fifty-one percent of temporary urbanists move from the suburbs of a major metro area into an urban neighborhood in the same metro area. Nineteen percent arrive from rural areas or small metro areas with populations below 500,000. Twenty-six percent move from the suburbs of one large metro area to an urban neighborhood in a different large metro area.
6. Do temporary urbanists come from more advantaged backgrounds?
Yes, it appears they do. Table 2 shows that temporary urbanists are first observed in tracts that have higher median incomes than those of other young adults. The median income of the census tract that the temporary urbanists are living in before they move into an urban neighborhood is $63,232. Permanent urbanists—those who move from a nonurban to an urban tract and haven’t left by the time they’re 33—come from neighborhoods that are very similar to the origins of the temporary urbanists in terms of income. People who do not live in an urban neighborhood between the ages of 23 and 32 live in neighborhoods with a median income of $60,783.
7. What are the income levels of the urban neighborhoods that temporary urbanists live in?
When controlling for age and metro area, temporary urbanists (and permanent urbanists) tend to live in higher-income urban neighborhoods. Table 2 shows that temporary urbanists live in urban neighborhoods with a median income of $54,142, while permanent urbanists live in neighborhoods with an average median of $54,124. Young adults who are always observed in the urban areas of these same cities live in neighborhoods with average median incomes of just $46,739.
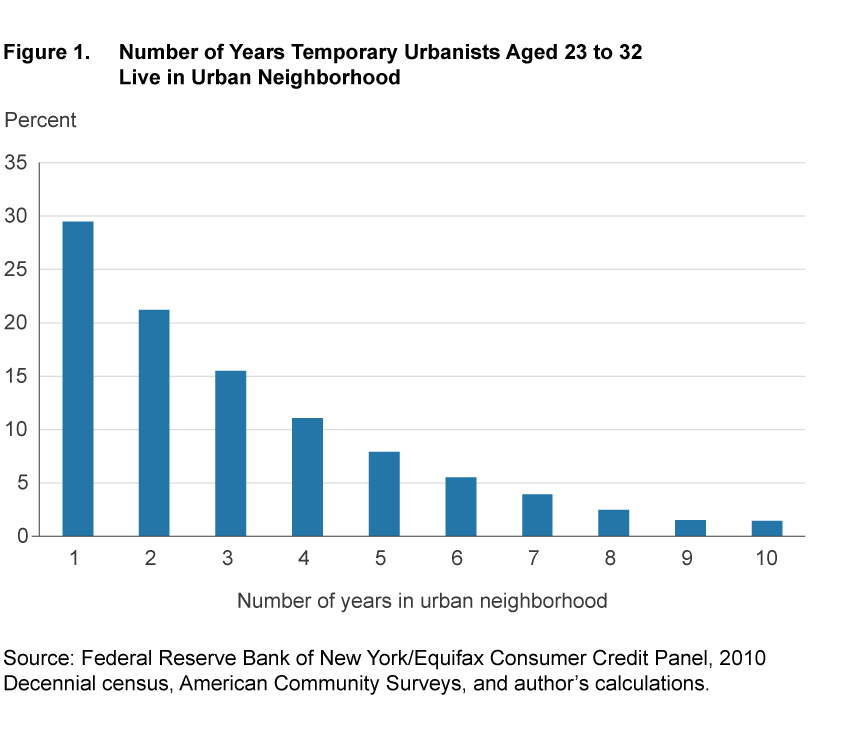
8. How long do temporary urbanists stay in urban neighborhoods?
On average, temporary urbanists spend 3.1 years living in urban neighborhoods. Figure 1 shows the complete breakdown of years spent in the city. Stays of just one year are the most common, but 22.8 percent stay five years or more.
9. Do temporary urbanists own homes while they are in the city?
In table 2, we see that 11 percent of temporary urbanists are homeowners while they are living in an urban neighborhood. The permanent urbanists are more likely to purchase a home (13.5 percent), which probably reflects their intent to stay in the urban neighborhood longer or indefinitely. Temporary urbanists are more likely to purchase homes than comparable young adults who have always lived in an urban area.
| Neighborhood median income (dollars) | Homeownership (percent) | ||||
|---|---|---|---|---|---|
| Migration pattern | Share of 1976–1985 cohorts | Origin | Urban | Urban | Nonurban |
| Temporary urbanist—moves nonurban to urban, returns to nonurban by age 33 | 9.3 | 63,232 | 54,142 | 11.0 | 27.6 |
| Permanent urbanist—moves nonurban to urban, stays past age 32 | 7.9 | 62,925 | 54,124 | 13.5 | 10.9 |
| Always urban | 10.2 | 42,938 | 46,739 | 7.3 | |
| Urban exiter—moves urban to nonurban, does not return to urban by age 33 | 8.1 | 43,985 | 49,270 | 7.3 | 24.9 |
| Temporary suburbanite—moves urban to nonurban, returns to urban by age 33 | 2.6 | 44,556 | 50,879 | 10.7 | 13.2 |
| Never urban | 61.8 | 60,783 | 23.3 | ||
Notes: Because income and homeownership depend strongly on age and local house prices, I use weights to make the other groups comparable to the temporary urbanists. I calculate means for groups of people defined by their migration pattern, age, metro area, and year of the observation. I reweight the means by the number of temporary urbanists in the equivalent age-metro-year group and report the weighted average.
Sources: Federal Reserve Bank of New York /Equifax Consumer Credit Panel, 2010 Decennial census, American Community Surveys, and author’s calculations.
10. Do temporary urbanists buy homes when they leave?
After leaving, temporary urbanists’ homeownership rate more than doubles to 27.6 percent (table 2). When compared to similarly aged people in the same metro areas, temporary urbanists are more likely to own homes than people who began in an urban neighborhood and moved out (24.9 percent) or people who never lived in an urban neighborhood (23.3 percent).
11. How many urbanists stay permanently?
Among all of the people observed moving from a nonurban to an urban neighborhood, 46 percent stay into their mid-thirties. Almost 8 percent of the cohorts observable in the CCP data appear to become permanent urbanists. A similar share of each cohort moves in the opposite direction—8.1 percent of individuals first observed in an urban neighborhood appear to move permanently to a nonurban neighborhood. These are the “urban exiters” in table 2.
12. Where do temporary urbanists go when they leave?
Thirty-two percent of temporary urbanists stay attached to the same metro area in which they are first observed through their urban years and when they move back to the suburbs. Twenty-three percent move to a different region when they move into an urban neighborhood and then move on to a third region when they exit. Another 23 percent move to different region when they enter an urban neighborhood and then settle in a suburb of the metro area where they spent their urban years. Twelve percent of temporary urbanists “boomerang” back to the metro or rural area where they were first observed after having spent their urban years in a different metro area. Finally, 10 percent of temporary urbanists move into an urban neighborhood in their original metro area but move to a different region when they are finished with urban living.
The temporary urbanist phenomenon is associated with both stepping down and stepping up in the urban hierarchy. Among temporary urbanists who depart for a different metro area when they are finished living in urban neighborhoods, 29 percent of the time they are moving to a smaller, and likely more affordable, region (table 3). Only 7 percent head to a substantially larger metro area when they transition from an urban to a nonurban lifestyle. However, the metro areas in which the temporary urbanists end up are usually larger than those in which they originally began. Twenty-eight percent of temporary urbanists are last observed in a metro area that is larger than the metro area in which they started (this remains true if college towns are excluded). Only 15 percent settle in a metro area that is smaller than where they began.
Percentage of temporary urbanists observed in origin–transition, transition–destination, and origin–destination metro-area pairs of various population sizes |
||||
|---|---|---|---|---|
|
|
|
Population of metro area, during urban years | ||
| Population of origin area |
|
500,000–2 million | 2 million–5 million | 5 million–19 million |
| Less than 500,000 or rural |
|
7.9 | 10.4 | 9.5 |
| 500,000–2 million |
|
15.6 | 4.5 | 5.1 |
| 2 million–5 million |
|
2.4 | 17.7 | 4.2 |
| 5 million–19 million |
|
1.9 | 2.5 | 18.4 |
|
|
|
|
|
|
| Population of metro area, after exiting urban neighborhood | ||||
| Population of metro area, during urban years | Less than 500,000 or rural | 500,000–2 million | 2 million–5 million | 5 million–19 million |
| 500,000–2 million | 5.14 | 18.35 | 2.92 | 1.83 |
| 2 million–5 million | 6.22 | 4.01 | 22.83 | 2.26 |
| 5 million–19 million | 4.87 | 4.48 | 4.24 | 22.85 |
|
|
|
|
|
|
| Population of metro area, after exiting urban neighborhood | ||||
| Population of origin area | Less than 500,000 or rural | 500,000–2 million | 2 million–5 million | 5 million–19 million |
| Less than 500,000 or rural | 9.2 | 6.33 | 6.81 | 5.46 |
| 500,000–2 million | 2.83 | 15.46 | 3.73 | 3.18 |
| 2 million–5 million | 2.42 | 2.64 | 16.77 | 2.45 |
| 5 million–19 million | 1.78 | 2.4 | 2.68 | 15.85 |
Sources: Federal Reserve Bank of New York /Equifax Consumer Credit Panel, 2010 Decennial census, American Community Surveys, and author’s calculations.
Conclusion
Anecdotally, regional policymakers, corporate recruiters, and marketers have long known about temporary urbanists. Now we have some quantitative evidence of the phenomenon and a better understanding of who the temporary urbanists are. We have confirmed that most are from relatively advantaged backgrounds and are more likely than their peers to become suburban homeowners. Many temporary urbanists downshift to a smaller metro area when they move out of an urban neighborhood, but they are more likely to settle in a more populous area than where they grew up.
While the data show that many of these people I am calling “urbanists” live in urban neighborhoods only temporarily, that does not necessarily mean that their attitudes toward urban places change when they leave. People often forgo things they value and enjoy when they believe family obligations require them to. Urban policymakers could view the former residents akin to an alumni network. Assuming the temporary urbanists had a positive experience, they should be more likely to return to urban neighborhoods as customers, encourage junior colleagues to live where they did, and support pro-urban state and federal policies.
Suggested Citation
Whitaker, Stephan D. 2019. “12 Facts about Temporary Urbanists.” Federal Reserve Bank of Cleveland, Economic Commentary 2019-07. https://doi.org/10.26509/frbc-ec-201907
This work by Federal Reserve Bank of Cleveland is licensed under Creative Commons Attribution-NonCommercial 4.0 International

