

- Share
Monetary Policy and Inequality
This Commentary examines the link between monetary policy and income and wealth inequality by reviewing the theoretical channels that have been proposed and examining the empirical evidence on their importance. The analysis suggests that the magnitude of any redistributive consequences of conventional monetary policy seems to be small. Evidence that unconventional monetary policies have led to increases in inequality is still inconclusive.
The views authors express in Economic Commentary are theirs and not necessarily those of the Federal Reserve Bank of Cleveland or the Board of Governors of the Federal Reserve System. The series editor is Tasia Hane. This paper and its data are subject to revision; please visit clevelandfed.org for updates.
In the aftermath of the financial crisis and the Great Recession, inequality has received a great deal of public attention.1 Following the Federal Reserve’s response to the economic downturn, some of that attention turned to the relationship between monetary policy and inequality. The Federal Reserve took unprecedented steps in the form of facilities designed to guarantee liquidity and stability in financial markets, raising the question of the effects of these unconventional monetary policies on inequality.
Addressing inequality is not a direct object of the Fed’s monetary policy. Its objectives are, according to the Federal Reserve Act, maximum employment, stable prices, and moderate long-term interest rates. As reflected in these statutory objectives, monetary policy is commonly thought of at the macroeconomic level, responding to and affecting variables such as aggregate employment, inflation, and long-term interest rates. Nonetheless, in pursuing macroeconomic objectives, the tools used by the Fed have the potential to affect inequality. To the extent that household characteristics—like age, type of income, and portfolio composition—are correlated with income or wealth levels and interact with monetary policy changes, they create channels through which monetary policy may affect inequality.
I examine the link between conventional monetary policy and inequality by reviewing some of the theoretical channels that have been proposed and examining the empirical evidence on their importance. I argue that the more meaningful changes in inequality occur over longer periods of time than the horizon at which monetary policy operates and are most likely the result of structural changes like demographic and technological changes. While monetary policy may have some redistributive consequences, their magnitude seems to be small. Finally, I also examine the claim that unconventional monetary policies have led to increases in inequality. Here, I argue that the evidence is still inconclusive.
Trends in Inequality
I will take inequality to mean the uneven dispersion of wealth or incomes across the whole distribution of households in the United States. I do not address how those outcomes vary by personal characteristics, like race, education, or gender.2
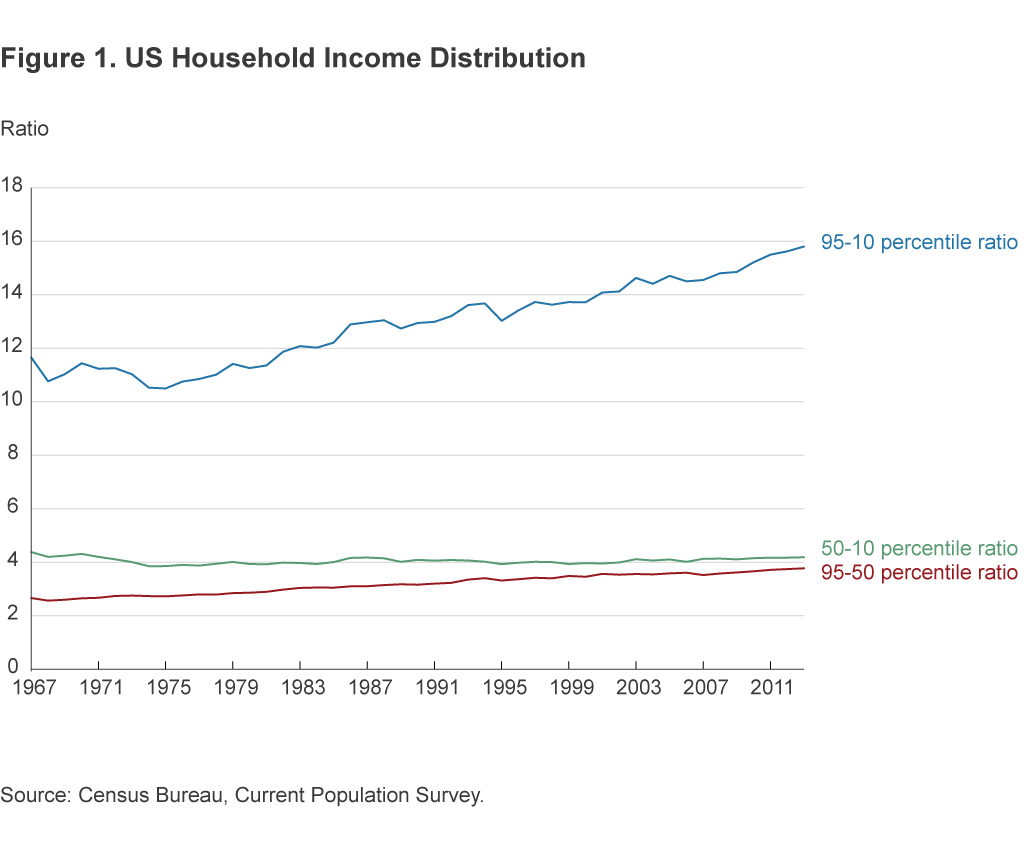
Income inequality has been rising in the United States since the late 1970s. Figure 1 shows income ratios between households at different points in the income distribution as measured by the Census Bureau’s Current Population Survey (CPS). Around 1975, households that were richer than 95 percent of US households had an income that was roughly 10.5 times higher than those that were richer than only 10 percent of all households. By 2013 this number had gone up to 16. The figure also shows that most of the increase in inequality was driven by the top part of the distribution, as the gap between the median household and the 10 percent richest households stayed more or less constant through the whole period.
Wealth, defined as net worth—the value of a household’s assets minus its liabilities—is much more concentrated than income. The Federal Reserve Board’s Survey of Consumer Finances (SCF) shows that in 2013, while the top 3 percent of households with the most income received roughly 30 percent of all income, the top wealthiest 3 percent of households held about 54 percent of all wealth.3
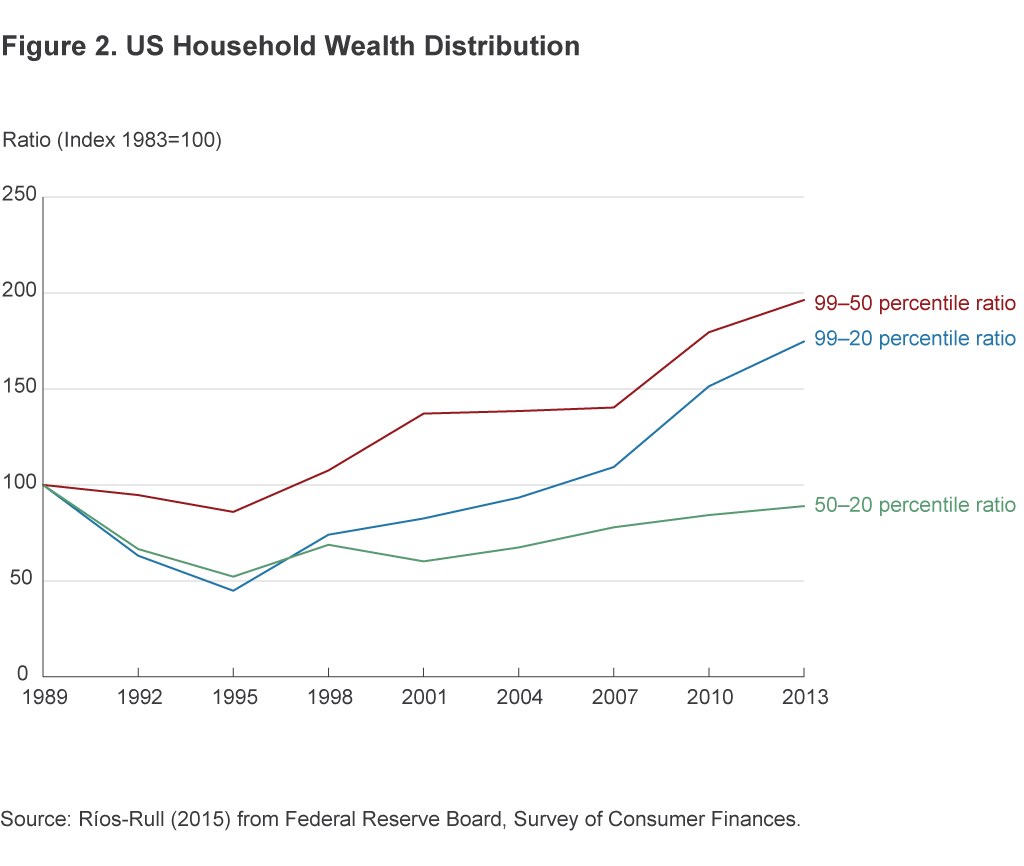
Most measures of wealth inequality from the SCF exhibit decreases until the mid-1990s. After that, they have been on an increasing trend. Figure 2 shows how much selected ratios of percentiles of the wealth distribution have changed since the late 1980s. Note that all of the increase in overall inequality lies in the upper part of the distribution. To infer about wealth inequality before the 1980s one has to indirectly estimate wealth either from estate tax returns, as in Piketty (2014), or by capitalizing annual capital income from income tax returns, as in Saez and Zucman (2014). Although these sources are somewhat at odds regarding the very top wealth shares, they both point to a decline in overall wealth inequality from the 1920s to the 1980s.
The Relationship between Monetary Policy and Inequality: Theory and Empirics
Conventional monetary policy refers to open market operations, through which the Federal Reserve buys and sells short-term treasuries (T-bills), in order to move the federal funds rate up or down in response to macroeconomic developments. A number of theoretical channels have been proposed by which conventional monetary policy might affect inequality. No one by itself provides a clear picture of the relationship; crucially, each depends on the distribution of population characteristics and the ways in which these are associated with different types of income as well as assets and liabilities.
Income sources, reported in table 1, include labor income (wages and salaries), capital or financial income, business income (from proprietorships), and transfer income (such as unemployment benefits). Household net wealth results from subtracting households’ liabilities (mortgages, car loans, credit card debt, etc.) from assets (not only financial assets, but also business assets, and crucially, housing) as shown in table 2.
Table 1. Income Sources as a Share of Household Income
|
|
Income quintiles | ||||
|---|---|---|---|---|---|
| Income source | 1st | 2nd | 3rd | 4th | 5th |
| Labor | 30.9 | 53.4 | 67.2 | 75 | 60.4 |
| Capital | −0.5 | 0.6 | 1.3 | 1.7 | 12.3 |
| Business | 3.1 | 3.8 | 5.2 | 5.5 | 18.1 |
| Transfer | 57.5 | 38.9 | 24.6 | 16.5 | 7 |
| Other | 8.9 | 3.2 | 1.7 | 1.3 | 2.3 |
| Average income | 13,100 | 28,300 | 47,100 | 78,400 | 265,100 |
Source: Kuhn and Ríos-Rull (2015) from the 2013 SCF.
Table 2. Assets/Liabilities as a Share of Household Net Wealth
|
|
Wealth quintiles | ||||
|---|---|---|---|---|---|
| Assets/liabilities | 1st | 2nd | 3rd | 4th | 5th |
| Housing and cars | −180.6 | 280.2 | 140.9 | 83.6 | 23.4 |
| Business and nonfinancial | −15.3 | 10.6 | 12.1 | 13.4 | 36.1 |
| Financial assets | −23.8 | 48.6 | 36.5 | 41.5 | 48.5 |
| Collateralized debt | 301.5 | −27.8 | −86.2 | −36.9 | −7.6 |
| Uncollateralized debt | 18.2 | −11.6 | −3.2 | −1.5 | −0.3 |
| Average wealth | −17,800 | 17,100 | 85,000 | 258,500 | 2,298,100 |
Source: Kuhn and Ríos-Rull (2015) from the 2013 SCF.
The main channels that have been suggested by which conventional monetary policy might affect inequality include the following:
- Inflation tax channel. Increases in expected inflation disproportionately erode the purchasing power of households that rely more on cash to conduct their transactions. Lower-income households tend to use more cash as a percentage of their total expenditures.4 Erosa and Ventura (2002) find that expected inflation acts as a regressive consumption tax, increasing inequality.
- Savings redistribution channel. Increases in unexpected inflation lower the real value of nominal assets and liabilities, making borrowers better off at the expense of lenders, as the real value of nominal debts decreases. The effect on inequality depends on the way those assets and their different maturities are distributed across households. Doepke and Schneider (2006) map asset holdings from the SCF into age and wealth categories and study the effects of a sustained surprise increase in inflation. They show that the group that would experience larger net wealth increases is middle-aged, middle-class households. This is because these households tend to hold long-term nominally denominated debt in the form of fixed-rate mortgages. On the other hand, older, richer households would lose the most, as they tend to be net savers with deposits and short-term denominated debt. This channel implies that expansionary monetary policy is likely to decrease inequality.
- Interest rate exposure channel. Auclert (2016) studies this channel, which relates to redistribution resulting from changes in real interest rates. A fall in real interest rates increases financial asset prices, to the extent that the interest rate used to discount future dividends decreases. But to understand how much different households benefit or lose, one must look at both their assets and liabilities, and importantly, at their respective durations. Net savers whose wealth is concentrated in short-duration assets (like CDs or T-bills) and net borrowers whose liabilities are of relatively long duration (like fixed-rate mortgages) benefit from expansionary monetary policy, to the extent that it decreases real interest rates. They do so at the expense of net savers whose wealth is concentrated in long-duration assets (like Treasury bonds) and of net borrowers whose liabilities are of relatively short duration (like adjustable-rate mortgages). Of course, one would have to know more about how such assets and liabilities are distributed across the population to be able to infer about what would happen to inequality with a change in monetary policy.
- Earnings heterogeneity channel. Changes in monetary policy have the potential to affect labor earnings differently, depending on where a household is in the earnings distribution. Heathcote, Perri, and Violante (2009) show that while earnings at the top of the distribution are mainly affected by changes in hourly wages, earnings at the bottom are mainly affected by changes in hours worked and the unemployment rate. To the extent that monetary policy affects these forces differently, it will produce redistributive income effects. For example, if expansionary monetary policy reduces unemployment to a larger extent than it increases hourly wages, it will result in decreased income inequality. Carpenter and Rodgers (2004) find that increases in the federal funds rate disproportionately increase the unemployment rates of less-skilled workers and racial minorities, demographic groups that are overrepresented in the lower part of the income distribution. This channel would thus predict that expansionary monetary policy reduces inequality.
- Income composition channel. Households obtain their incomes from different sources, each of which may respond differently to changes in monetary policy. As table 1 shows, at the low end of the income distribution households tend to rely more on transfer income (like unemployment benefits and food stamps), while households close to the median will rely on labor income and those at the upper tail of the income distribution will rely relatively more on business and capital income. Following a change in monetary policy, the implications for inequality stemming from this channel are not clear cut. If a fall in interest rates stimulates economic activity, expansionary monetary policy may result in increased wages and decreased unemployment, thereby increasing inequality at the lower end of the distribution, as transfer income will vary little with economic activity. On the other hand, lower interest rates decrease interest income (mostly accruing to wealthier households), and inequality at the top of the distribution may decrease.
Gornemann, Kuester, and Nakajima (2012) consider the importance of the earnings and income composition channels in the context of a model in which households differ in their employment status, earnings, and wealth. They find that the redistributive effects of monetary policy are such that contractionary monetary policy shocks increase inequality. The unemployed, in particular, are made worse off by monetary policy tightening, as a contractionary shock tends to prolong their unemployment spell, as firms reduce labor demand.
Empirical Evidence
No clear implication on the effects of conventional monetary policy emerges from the consideration of these channels in theory. One needs to measure these effects in the data. To do so, two measurement issues need to be addressed. One is distinguishing between causation and correlation, and the other is dealing with the frequency mismatch between monetary policy changes, which occur numerous times within a year, and the yearly data available from the CPS or the triennial data from the SCF.
A recent study by Coibion et al. (2016) attempts to address both measurement issues. To deal with the first, they isolate the true surprise component in the fed funds rate change, using a measure of monetary policy shocks developed by Romer and Romer (2004). To deal with the second, their measures of inequality come from the Bureau of Labor Statistics’ Consumer Expenditure Survey (CEX), from which they obtain quarterly data on labor earnings, total income (labor earnings plus financial, business, and transfer income), and consumption and total expenditures (consumption plus health, education, rent, and mortgage expenditures) from 1980 to 2008.
They find statistically and economically significant effects of surprise monetary policy changes on inequality. Specifically, they estimate that a surprise increase in the fed funds rate of one percentage point would increase pre-tax income inequality, as measured by the Gini coefficient, by roughly 0.007, but only after three to five years.5
To assess how large the effect of monetary policy is relative to long-term changes in income inequality note two things. First, the Gini coefficient on pre-tax income has increased 0.05 percentage points, from 0.44 to 0.49 since 1980. Second, one must understand that a surprise federal funds rate shock is not the same as a change in the federal funds rate, but is an unforecasted change, using the Romer and Romer (2004) model. According to Coibion et al. (2016), there has not been a one percentage point increase since the 1980s, and the recent large negative shocks would go in the direction of decreasing inequality. Another way to gauge the magnitude of the effect is to ask how much did monetary policy shocks contribute to the overall variance in inequality measures. This contribution is less than 4 percent for earnings inequality at all horizons, less than 5 percent for income inequality at horizons shorter than 3 years, and about 10 percent at longer horizons.6
In trying to discern which of the channels described above may be more active, the fact that labor earnings inequality seems little affected by monetary policy points to a small role for the earnings heterogeneity channel. On the other hand, the income composition channel seems to be important. In particular, the fact that labor earnings are a much higher fraction of total income at upper quintiles, compared to the bottom quintiles, where transfer income is more prevalent, seems to be of particular importance in accounting for changes in inequality following monetary policy shocks.
It is important to emphasize that the movements in inequality look like the product of long-term, low-frequency forces. Monetary policy, on the other hand, changes more frequently, moving from contractionary to expansionary with the business cycle. In sum, I do not mean to argue that monetary policy has no effect on inequality, but whatever that is, it is likely to be small, at least relative to the effect of more fundamental forces, like education, globalization, demographics, technological change, or corporate trends in compensation.
Unconventional Monetary Policy and Inequality
To mitigate the effects of the financial crisis and stimulate the recovery after the Great Recession, the Fed has enacted policy measures that are very different from its traditional open-market operations. It has lowered the federal funds rate to a lower bound very close to zero, it has signaled how long the rate would stay at this lower bound, and it has bought, and kept on its balance sheet, large amounts of assets it did not use to hold, like longer-term treasuries and mortgage-backed securities, through its Large-Scale Asset Purchase (LSAP) program. These unconventional monetary policy measures have been pointed to by some as being inequality increasing.7
Such asset purchases decrease the interest rates and increase the prices not only of the securities that are bought, but also of securities that are substitutable enough, through a portfolio effect. Gagnon et al. (2011) argue that the LSAP program decreased longer-term interest rates on a variety of securities (including securities not purchased), and Rosa (2012) argues that this program had significant effects on US asset prices.
The effects of the LSAPs on income inequality come about through some of the same channels outlined above, as they cause a fall in interest rates. Holding portfolios constant, households see decreases in debt servicing and in interest income. The effect of these decreases on inequality depends on who is holding interest-sensitive assets and liabilities. Most of the action will take place along the age dimension. Younger households tend to hold more interest-sensitive liabilities, while older households tend to hold more interest-sensitive assets. Since richer households also tend to be older and depend more on interest income, one would expect income inequality to drop.8 But this is only the first-round effect. As households adjust their portfolios and firms take advantage of reduced debt burdens and cheaper credit, aggregate real activity improves and affects other types of income, like wages and salaries, so that the final effect on income inequality is ambiguous.
Because asset prices are affected, one would expect wealth inequality to be impacted as well—exactly how will depend on the relative price changes in each asset class and the distribution of different types of assets and liabilities across different wealth groups.
While there is an abundance of opinion pieces and anecdotal evidence on the effect of LSAPs on wealth and income inequality, there are very few studies, and most concentrate only on the first-round effects of the drop in interest rates and increases in asset prices, given the different wealth groups’ portfolio compositions.
Domanski, Scatigna, and Zabai (2016) analyze surveys of household finances for five European countries as well as the United States and find that the main drivers of the changes in wealth inequality since the start of the Great Recession have been changes in equity valuations and changes in house prices. Because the lion’s share of total assets in the bottom 80 percent of the wealth distribution in the United States is in the form of real estate, while financial assets are relatively more important for the very top of the distribution, increases in house prices will tend to be inequality decreasing, while increases in other asset prices will tend to be inequality increasing.
On the other hand, poorer households tend to be more leveraged, as they borrow more to finance assets, mostly in the form of housing. As asset prices change, these households’ net wealth changes proportionately more than the net wealth of richer, less leveraged households. Finally, net wealth is also affected by the distribution of liabilities and how the changes in interest rates and prices impact the value of these liabilities (e.g., adjustable-rate mortgages vs. fixed-rate mortgages). Overall, Domanski, Scatigna, and Zabai (2016) find these changes in asset prices and interest rates have increased wealth inequality in the United Sates. But O’Farrell, Rawdanowicz, and Inaba (2016), using a similar methodology, find insignificant effects.
Importantly, none of these studies compares the effects of the LSAPs on inequality to a counterfactual outcome. Bivens (2015) takes this route and argues that compared to the alternative of no stimulus, the LSAP program has reduced inequality significantly, mainly through its effects on output stabilization.
Conclusion
The complexity of the mechanisms linking monetary policy and inequality stems from the fact that they depend not only on economic variables that constantly change for reasons other than monetary policy, but importantly, also on the distributions of income and wealth themselves, which are in turn heavily influenced by demographics. Theoretically, it is cumbersome to develop models that can reflect all the relevant heterogeneity, and empirically, it is hard to control for all the endogeneity. Nonetheless, an examination of the literature and the evidence seems to point to a modest influence at best.
Footnotes
- See, for example, Bernanke (2015), Bullard (2014), Mersch (2014), and Yellen (2014). See also Nakajima (2015) for an earlier analysis. Return to 1
- That is a subject where there is a lot of ongoing research also. See Thompson and Suarez (2015), for example. Return to 2
- See Bricker et al. (2014). Return to 3
- See Avery et al. (1987). Return to 4
- The effects are smaller for earnings inequality and larger for consumption and total expenditures inequality. The Gini coefficient is a measure of income inequality, which ranges from 0 (perfect equality) to 1 (all income is earned by a single household). Return to 5
- The contributions to consumption and expenditure inequality are higher, ranging between 8 percent and 20 percent at horizons longer than 3 years. Return to 6
- See Cohan (2014) and Wolf (2014) for examples in the business press. Return to 7
- Dobbs et al. (2013) estimates that the household sector as a whole, being a net saver, was a net loser from the direct impact of the interest rate reduction, while nonfinancial corporations and the federal government, as net borrowers, benefited. Return to 8
References
- Auclert, A., 2016. “Monetary Policy and the Redistribution Channel,” unpublished manuscript, Stanford University.
- Avery, R., G. Elliehausen, and A. Kennickell, 1987. “Changes in the Use of Transaction Accounts and Cash from 1984 to 1986,” Federal Reserve Bulletin, 73:3: 179–195.
- Bernanke, B., 2015. “Monetary Policy and Inequality,” Brookings Blog, June 1.
- Bivens, J., 2015. “Gauging the Impact of the Fed on Inequality during the Great Recession,” Hutchins Center on Fiscal and Monetary Policy at Brookings, WP12.
- Bricker, J., L. Dettling, A. Henriques, J. Hsu, K. Moore, J. Sabelhaus, J. Thompson, and R. Windle, 2014. “Changes in US Family Finances from 2010 to 2013: Evidence from the Survey of Consumer Finances,” Federal Reserve Bulletin 100(4).
- Bullard, J., 2014. “Income Inequality and Monetary Policy: A Framework with Answers to Three Questions.” Speech delivered at the C. Peter McColough Series on International Economics, Council on Foreign Relations.
- Carpenter, S., and W. Rodgers III, 2004. “The Disparate Labor Market Impacts of Monetary Policy,” Journal of Policy Analysis and Management, 23(4): 813–30.
- Cohan, W., 2014. “How Quantitative Easing Contributed to the Nation’s Inequality Problem,” Dealbook, New York Times, October 22.
- Coibion, O., Y. Gorodnichenko, L. Kueng, and J. Silvia, 2016. “Innocent Bystanders? Monetary Policy and Inequality in the U.S.,” unpublished manuscript, University of Texas-Austin.
- Dobbs, R., S. Lund, T. Koller, and A. Shwayder, 2013. “QE and Ultra-low Interest Rates: Distributional Effects and Risks,” McKinsey Global Institute Discussion Paper.
- Doepke, M., and M. Schneider, 2006. “Inflation and the Redistribution of Wealth,” Journal of Political Economy, 114(6): 1069–97.
- Domanski, D., M. Scatigna, and A. Zabai, 2016. “Wealth Inequality and Monetary Policy,” BIS Quarterly Review (March).
- Erosa, A., and G. Ventura, 2002. “On Inflation as a Regressive Consumption Tax,” Journal of Monetary Economics, 49(4): 761–795.
- Gagnon, J., M. Raskin, J. Remache, and B. Sack, 2011. “The Financial Market Effects of the Federal Reserve’s Large-Scale Asset Purchases,” International Journal of Central Banking, 7(1):3–43.
- Gornemann N., K. Kuester, and M. Nakajima, 2012. “Monetary Policy with Heterogeneous Agents,” Federal Reserve Bank of Philadelphia, Working Paper no. 12-21.
- Heathcote, J., F. Perri, and G. Violante, 2009. “Unequal We Stand: An Empirical Analysis of Economic Inequality in the United States, 1967–2006,” Federal Reserve Bank of Minneapolis, Research Department Staff Report no. 436.
- Kuhn, M., and J-V Ríos-Rull, 2015. “2013 Update on the US Earnings, Income, and Wealth Distributional Facts: A View from Macroeconomics,” Federal Reserve Bank of Minneapolis, Quarterly Review, 37(1).
- Nakajima, M., 2015. “The Redistributive Consequences of Monetary Policy,” Federal Reserve Bank of Philadelphia, Business Review, Q2: 9–16.
- Mersch, Y., 2014. “Monetary Policy and Economic Inequality.” Speech delivered at the Corporate Credit Conference, Zurich.
- O’Farrell, R., L. Rawdanowicz, and K. Inaba, 2016. “Monetary Policy and Inequality,” OECD Economics Department, Working Paper no. 1281.
- Piketty, T., 2014. Capital in the Twenty-First Century, Belknap Press of Harvard University Press, Cambridge, Massachusetts.
- Rosa, C., 2012. “How ‘Unconventional’ Are Large-scale Asset Purchases? The Impact of Monetary Policy on Asset Prices,” Federal Reserve Bank of New York, Staff Report no. 560.
- Romer, C., and H. Romer, 2004. “A New Measure of Monetary Shocks: Derivation and Implications,” American Economic Review, 94(4): 1055–1084.
- Saez, E., and G. Zucman, 2014. “Wealth Inequality in the United States since 1913: Evidence from Capitalized Income Tax Data,” National Bureau of Economic Research, Working Paper no. 20625.
- Thompson, J., and G. Suarez, 2015. “Exploring the Racial Wealth Gap Using the Survey of Consumer Finances,” Board of Governors of the Federal Reserve System Finance and Economics Discussion Series no. 2015-76.
- Wolf, M., 2014. ‘’Why Inequality Is Such a Drag on Economies,” Financial Times, September 30.
- Yellen, J., 2014. “Perspectives on Inequality and Opportunity from the Survey of Consumer Finances.” Speech delivered at the Conference on Economic Opportunity and Inequality, Federal Reserve Bank of Boston.
Suggested Citation
Amaral, Pedro S. 2017. “Monetary Policy and Inequality.” Federal Reserve Bank of Cleveland, Economic Commentary 2017-01. https://doi.org/10.26509/frbc-ec-201701
This work by Federal Reserve Bank of Cleveland is licensed under Creative Commons Attribution-NonCommercial 4.0 International

