

- Share
Income Inequality Matters, but Mobility Is Just as Important
Concerns about rising income inequality are based on comparing income distributions over time. It is important to remember that such distributions are snapshots of a single year, and that the same households do not necessarily appear year after year in the same quintile of the distribution. Paying attention to mobility, as well as inequality, gives us a richer picture of the income possibilities for households over time. We document changes in a measure of income mobility over the past 40 years, a period in which income inequality has increased. We find a modest level of movement through the distribution, particularly across generations. Nevertheless, the income quintile of one’s parents still has a sizeable effect on how just how high one is likely to rise or how low one may fall.

The views authors express in Economic Commentary are theirs and not necessarily those of the Federal Reserve Bank of Cleveland or the Board of Governors of the Federal Reserve System. The series editor is Tasia Hane. This paper and its data are subject to revision; please visit clevelandfed.org for updates.
The distribution of income has received considerable attention in recent years. This is not surprising given the high and rising levels of income inequality; but of equal importance is how frequently households change places within the distribution. What is the likelihood, for instance, of a household in the bottom 20 percent of the income distribution rising into the top 20 percent over a given period of time? What about the likelihood that a person’s children will grow up to belong in the top quintile? Questions of this nature are focused on income mobility, which is different than income inequality. Income inequality compares the position of one household to another household at the same point in time. In contrast, income mobility compares the position of one household to itself at different points in time.
Having a sense of the amount of income mobility in a society is critical because it affects how we interpret inequality. The distribution of income could be very unequal, but if people move throughout that distribution over their lifetime, perhaps because they start out relatively poor and then become richer as they age, then income inequality may be more tolerable. On the other hand, a highly unequal distribution of income could be associated with low mobility, meaning that the poor today will remain poor in the future, which implies large lifetime differences in income. In addition, if mobility is also low between generations, then the children of poor households have little prospect for improvement, and so the same families tend to remain poor over time.
In this Commentary, we document changes in a measure of income mobility over the past 40 years, a period in which income inequality has increased. We find a modest level of movement through the distribution, particularly across generations. Nevertheless, the income quintile of one’s parents still has a sizeable effect on how just how high one is likely to rise or how low one may fall.
The Rise in Income Inequality
That income inequality has been rising is well documented. Work by Thomas Piketty and Emmanuel Saez has highlighted that since the early 1980s an increasing share of the total income in the US is held within the top 1 percent of the income distribution. Heathcoate, Perri, and Violante (2010) report that the Gini coefficient on income (a broad measure of inequality based over the entire distribution) has increased by roughly 25 percent from 1967 to 2005 (figure 1).
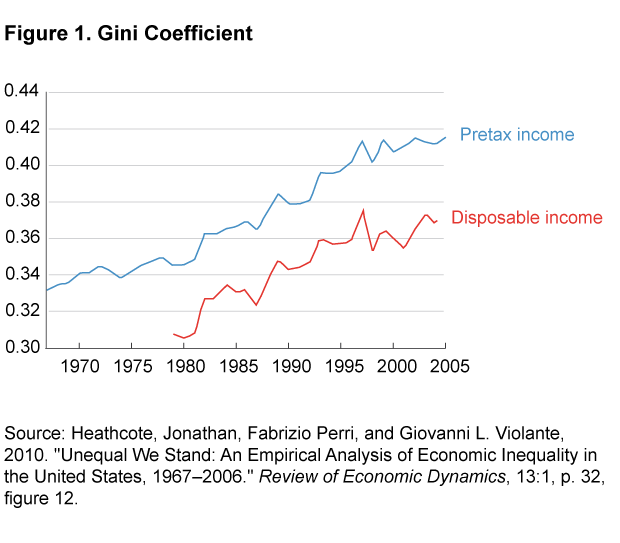
Facts like those above often give rise to the statement that “the rich are getting richer and the poor are getting poorer.” In one sense this is true. It requires more income than in the past (even in real dollar terms) to belong to a top percentile group; but rising income inequality does not necessarily imply that the same rich individuals are getting richer and the same poor are getting poorer. It is possible for the distribution to spread out, becoming more unequal, while households within the distribution churn through it more rapidly as long as mobility is high.
In this article, we consider two types of mobility: intragenerational and intergenerational. The first type asks how likely it is that a household in one income quintile will still be in that quintile after a fixed number of years; the second asks how likely is it that the child of a household will grow up to belong in the same quintile that his or her parents did.
Mobility within a Generation
The mobility of a household through the income distribution is affected by many factors. First, there is the level of education and career choice of those in the household. And there is the accumulation of job experience, resulting in different earnings as people age. Then there is the formation and dissolution of households. When individuals pair with or separate from one another, total household income can change considerably. All of these factors take effect over a household’s lifetime.
Using the Panel Study of Income Dynamics (PSID) between 1968 and 2013 we construct a transition matrix that indicates the frequency with which households in one quintile were located in another quintile after a period of years. Because of large changes over the sample period in the female labor supply as well as social norms concerning head-of-household status, we restrict our sample to male-headed households. Additionally, to avoid large swings in income from retirees, we limit age to between 18 and 65.
Table 1 shows an example of a 10-year transition matrix calculated from 2003 to 2013. The rows are associated with the quintile where a household was in 2003. Reading across the row, each cell indicates the fraction of households from that row’s quintile that are observed in that column’s income quintile in 2013. In this case, about 64 percent of households that were in the bottom quintile in 2003 were there in 2013. Meanwhile, 1 percent of them had moved up to the top quintile.
| Original quintile (poorest to richest) |
Quintile 10 years later | ||||
|---|---|---|---|---|---|
| 1 | 2 | 3 | 4 | 5 | |
| 1 | 0.64 | 0.24 | 0.08 | 0.03 | 0.01 |
| 2 | 0.23 | 0.45 | 0.24 | 0.07 | 0.02 |
| 3 | 0.08 | 0.20 | 0.46 | 0.23 | 0.04 |
| 4 | 0.04 | 0.07 | 0.19 | 0.54 | 0.18 |
| 5 | 0.03 | 0.04 | 0.06 | 0.16 | 0.72 |
Note: The sum of a row may not equal one due to rounding.
Source: Panel Study of Income Dynamics, 1968–2013.
In order to get a sense of how much mobility has changed over time, we compare mobility matrices across different time periods using the Shorrocks index (Shorrocks 1978). The Shorrocks index captures the “stickiness” of the income quintiles using the diagonal elements of the matrix (bolded in table 1), which denote the probability that households observed in a particular quintile will be observed again in that same quintile later. A Shorrocks index of 1 means that there is complete mobility. At this extreme, every household, regardless of its current position in the income distribution, has a 20 percent chance of being in any other position at the end of the measured period. In the other extreme, under complete immobility, every household has a 100 percent chance of remaining in its original quintile. In this case, the Shorrocks index would be 0. The matrix in table 1 has a Shorrocks index of 0.55, suggesting mobility is far from complete. This lack of mobility is especially pronounced at the bottom and top quintiles, which maintain approximately 70 percent of their occupants even after ten years.
We examine how mobility has changed in the past 40 years, measured over both 10-year and 20-year windows. The results for the 10-year and 20-year cases are displayed in figure 2. The dates are the end of each 10-year and 20-year window. Mobility decreased during the 1980s, rose throughout the 1990s, and then decreased somewhat over the last decade. This suggests that although households are more spread out in the income distribution, they are only somewhat less fixed in their positions within it.
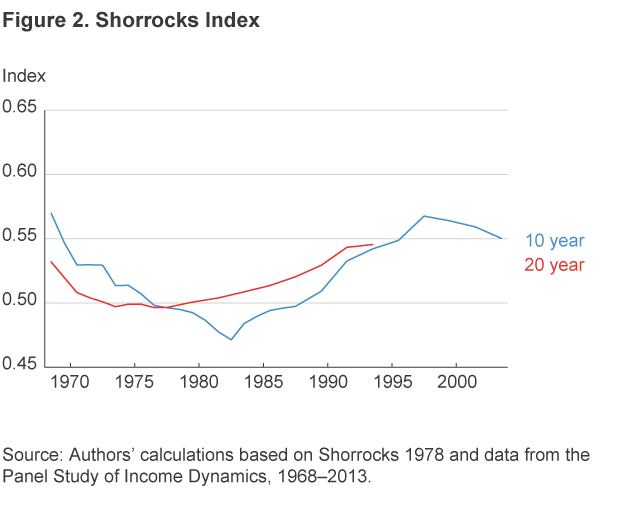
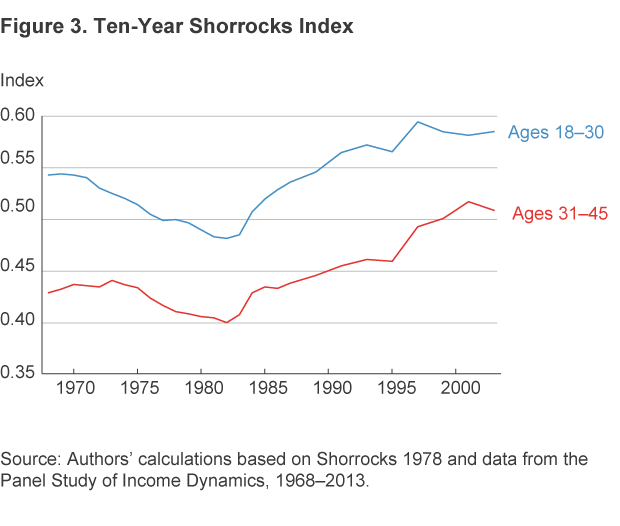
Curiously, changing the time window from 10 years to 20 years has only a very small effect on the Shorrocks measure, meaning that the probability of changing quintiles in the next 10 years depends upon whether you changed quintiles in the previous 10 years. If instead the probabilities were independent, then the Shorrocks index should increase with the time window. Our findings are consistent with a situation in which households are mobile when they are young, perhaps because of education or marriage, and then their position in the distribution becomes more solidified as they age. To check this, we divided households into two groups: those between the ages of 18 and 30 and those between the ages of 31 and 45.
Figure 3 shows the Shorrocks indexes of both age groups for a 10-year window. The picture supports our suspicion that mobility declines after an early age. While the two mobility measures move together over time, the younger group has considerably more income mobility than their older cohorts.
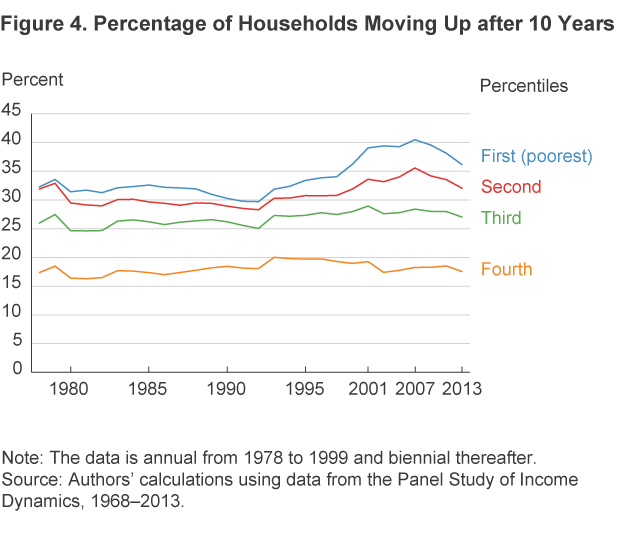
In the analysis above, we have considered only how likely a household is to stay in its current income quintile. Another aspect of mobility that is of interest is how frequently a household moves up to a higher quintile. Figure 4 plots the fraction of households that move up after 10 years, conditional on their current quintile. While there has been a small increase in upward movement for the poorest groups over time, for most income quintiles the fraction is roughly flat.
Mobility across Generations
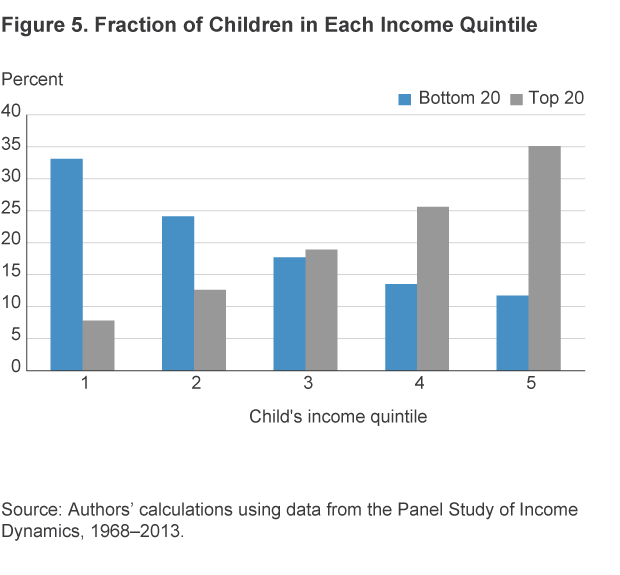
The second type of mobility we consider, intergenerational mobility, concerns how likely it is for a household’s children to move out of their parents’ income quintile. Beyond just inheritable traits which affect income, intergenerational mobility embeds factors such as parents’ input to education (both pecuniary and nonpecuniary), residential choice (which affects public school quality and crime), social connections, and income from inherited wealth. It is not feasible to compare intergenerational mobility over time in the way we have done for intragenerational mobility. Unfortunately, it requires far more reliable data than is available now. We can, however, look at a recent snapshot.
Chetty, Hendren, Kline, and Saez (2014) estimate a matrix of parent income to child income for the years 1980-1985 using data on taxpayers in the Statistics of Income. The Shorrocks index for the matrix is 0.905, suggesting that intergenerational income mobility is quite high; however, while children are likely to belong to a different income quintile than their parents did, they are unlikely to move very far away. While distant movements are observed in the data, they are far less common. Figure 5 shows that for the children of parents in the first quintile of income, only about 25 percent end up in the fourth or fifth quintiles. Contrast that with children of fifth-quintile parents, where the same statistic is over 60 percent.
Thus in the United States, children born into families with higher-than-average income have a sizeable advantage over their less fortunate peers. Against the backdrop of rising inequality, this suggests that intergenerational mobility could be reduced as advantage breeds further advantage over time. Evidence from international data supports this story. In a study of developed countries, Corak (2013) plots income inequality and a measure of intergenerational earnings mobility, the so-called “Great Gatsby Curve” (figure 6).
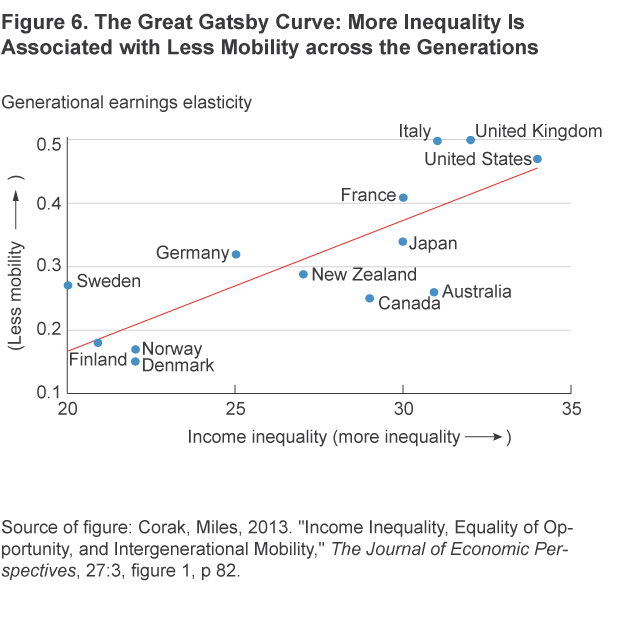
While not a perfect relationship, the upward slope of the curve indicates a negative correlation between income inequality and mobility. Developed countries with low levels of income inequality tend to also have more mobility within the income distribution across generations.
Conclusion
Much attention is paid to changes in the distribution of income. It is important to remember that these are cross-sections, snapshots of a single year. Any quintile of the distribution is not composed of exactly the same households year after year. Instead, households shuffle and sort as they age, marry, move up in the labor market, and encounter good and bad luck. Paying attention to mobility, as well as inequality, gives us a richer picture of the income possibilities for households over time. Data on mobility suggest a modest level of movement through the distribution, particularly across generations. Nevertheless, the income quintile of one’s parents still has a sizeable effect on just how high one is likely to rise or how low one may fall.
[Editor’s note: Two names were misspelled in the text when this article was first posted: “Heathcote” and “Shorrocks.” They were spelled correctly in the references. The text was updated on July 25, 2016, to correct these errors.]
References
- Chetty, Raj, Nathaniel Hendren, Patrick Kline, and Emmanuel Saez, 2014. “Where Is the Land of Opportunity? The Geography of Intergenerational Mobility in the United States,” Quarterly Journal of Economics,129:1553-1623.
- Corak, Miles, 2013. “Income Inequality, Equality of Opportunity, and Intergenerational Mobility,” The Journal of Economic Perspectives, 27.3: 79-102.
- Heathcote, Jonathan, Fabrizio Perri, and Giovanni L. Violante, 2010. “Unequal We Stand: An Empirical Analysis of Economic Inequality in the United States, 1967–2006,” Review of Economic Dynamics, 13.1: 15–51.
- Shorrocks, Anthony F., 1978. “The Measurement of Mobility,” Econometrica: Journal of the Econometric Society, pp. 1013–1024.
Suggested Citation
Carroll, Daniel R., and Anne Chen. 2016. “Income Inequality Matters, but Mobility Is Just as Important.” Federal Reserve Bank of Cleveland, Economic Commentary 2016-06. https://doi.org/10.26509/frbc-ec-201606
This work by Federal Reserve Bank of Cleveland is licensed under Creative Commons Attribution-NonCommercial 4.0 International

