

- Share
Neighborhood Poverty and Quality in the Moving to Opportunity Experiment
Researchers suspect that some of the disparities that exist in such outcomes as health, employment, and education might be attributable to inequality of opportunity as determined by neighborhood environments. We study census data to identify neighborhood characteristics in addition to poverty that might help to explain these disparities. We focus on the Moving to Opportunity housing-relocation experiment and show that because program participants typically moved from one predominately black neighborhood to another, their new low-poverty neighborhoods may have provided little to no change in neighborhood quality. These circumstances are helpful in understanding how results from the Moving to Opportunity program should inform views of neighborhood effects.
The views authors express in Economic Commentary are theirs and not necessarily those of the Federal Reserve Bank of Cleveland or the Board of Governors of the Federal Reserve System. The series editor is Tasia Hane. This paper and its data are subject to revision; please visit clevelandfed.org for updates.
Important outcomes such as health, employment, and income continue to exhibit major disparities across racial groups in the United States. These disparities are especially salient between blacks and whites and include many other outcomes such as educational attainment or achievement.
Because outcomes are related to race so strongly, it is widely suspected that these differences result to some important extent from inequality of opportunity. And because equality of opportunity is such a foundational American ideal, researchers have devoted considerable effort to understanding the mechanisms maintaining racial disparities in outcomes.
A basic question is the following: How could there still be inequality of opportunity between blacks and whites after recent years’ data have shown such a drastic decline in racial discrimination, both in legal terms and in terms of individuals’ attitudes (Bobo, Charles, Krysan, and Simmons, 2012)? A natural place to begin is to look at additional drivers of opportunity: families and neighborhoods.1
Neighborhoods might influence an individual’s opportunities through many pathways such as schools, personal security, employment networks, access to public resources, and types of individuals with whom one interacts. The evidence indicates that blacks and whites have continued to live in very different neighborhoods since the end of legal discrimination, and Wilson (1987) proposed that researchers investigate how these differences shape opportunity. For example, Wilson found that between 1970 and 1980, neighborhoods emerged in Chicago with poverty and unemployment rates much higher than had previously been seen. Wilson focused attention on residential sorting as a driver of neighborhood formation, and related work has shown the importance of racial segregation in maintaining unequal environments of blacks and whites Sampson and Sharkey, 2008).
In this Economic Commentary we investigate how different characteristics might be used to characterize neighborhood environments, and how these characteristics relate to neighborhood poverty.
Evidence of Neighborhood Effects
While it might seem self-evident that neighborhood environments play an important role in individuals’ development, the existence of such neighborhood effects is very difficult to test for using data. The problem is something called self-selection: To illustrate, consider individuals who drop out of high school. Are they more likely to drop out because they are influenced by their neighborhoods, or do people who are likely to drop out of high school simply choose to live near one another? Because people have some choice in where they live, it is very difficult to distinguish between these explanations with the available data.
Housing mobility programs are a departure from the standard way households sort into neighborhoods and therefore provide some of the best evidence on neighborhood effects. One of the first examples was the Gautreaux program in Chicago, which found evidence of neighborhood effects on educational and employment outcomes. Inspired by Gautreaux, researchers and policymakers followed up with another program, Moving to Opportunity (MTO). Conducted in five U.S. cities, MTO was a social experiment in which volunteering households receiving public-housing assistance and living in high-poverty neighborhoods were randomly given the additional assistance of a housing voucher that could be used toward rent in a low-poverty neighborhood (see NBER/MTO for a general summary). While MTO did have some positive effects, it did not reproduce the effects on children’s educational outcomes and parents’ labor-market outcomes observed in Gautreaux.
Thus, while Gautreaux provided evidence in favor of neighborhood effects, MTO has been interpreted as evidence against the existence of neighborhood effects. The statistical methodology justifying this interpretation of MTO has been a subject of debate (Aliprantis, 2015; Clampet-Lundquist and Massey, 2008; Ludwig et al., 2008; and Sampson, 2008). In nontechnical terms, one criticism of viewing MTO as evidence concerning neighborhood effects is that doing so interprets neighborhood poverty as equivalent to neighborhood quality.
We investigate the relationship between neighborhood poverty and other neighborhood characteristics, focusing on the cities in MTO.2 We find that a low-poverty neighborhood can look like a high-poverty neighborhood in other important neighborhood dimensions such as unemployment, educational attainment, and household structure. We also find evidence that moving to a lower-poverty neighborhood through MTO did not automatically change these other important neighborhood characteristics, especially since moving to a low-poverty black neighborhood did not automatically change other characteristics as much as moving to a low-poverty white neighborhood.
Neighborhood Poverty and Neighborhood Characteristics
In order to test whether moving individuals to a lower-poverty neighborhood necessarily improves the other neighborhood characteristics they are exposed to, we study the characteristics of census tracts in the five MTO cities—Baltimore, Boston, Chicago, Los Angeles, and New York—in the year 2000 (13,551 tracts total; see table 1).
Table 1. Characteristics of Census Tracts Studied
| City | Number of tracts | Population | Number of tracts above 40% poverty | Population |
|---|---|---|---|---|
| Boston | 1263 | 6,055,452 | 27 | 65,496 |
| Chicago | 2072 | 9,210,598 | 130 | 254,111 |
| Los Angeles | 3383 | 16,477,685 | 166 | 651,034 |
| New York | 5139 | 21,358,143 | 303 | 1,104,391 |
| Baltimore | 1694 | 7,631,042 | 64 | 16,942 |
Source: 2000 US Census data.
We sort all the tracts of the five cities into nine groups by poverty level and then compare these groups in terms of a number of characteristics. We begin by showing characteristics using box-and-whisker plots, which display the distribution of neighborhoods for a given poverty rate (the horizontal lines represent the 10th, 25th, 50th, 75th, and 90th percentiles of the distributions). When we look at educational attainment, we see the expected negative correlation between poverty and attainment: On average, as neighborhood poverty increases, educational attainment decreases (figures 1 and 2). However, we also find that this relationship is not perfect. There are some low-poverty neighborhoods that look like some high-poverty neighborhoods in terms of educational attainment. This appearance is true of both high school graduation rates and bachelor’s degree attainment rates.
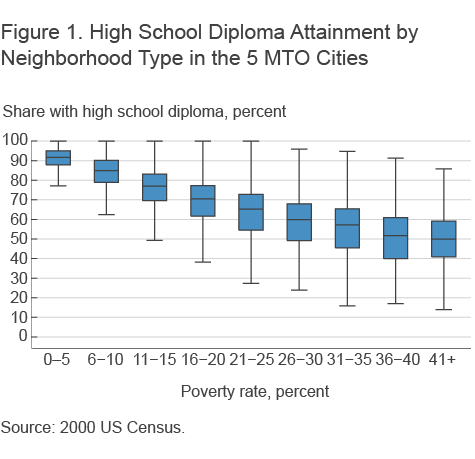
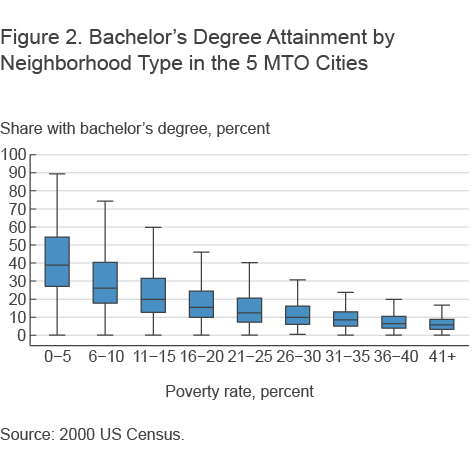
We see that this pattern is also true of additional characteristics one might think of as contributing to a neighborhood’s quality such as the share of single-headed households, the unemployment rate, or median household income (measured at an annual frequency). (See figures 3, 4, and 5.) Now we see that being in a low-poverty neighborhood essentially rules out the worst-case scenarios possible in high-poverty neighborhoods. There are no low-poverty neighborhoods with extremely high unemployment rates or shares of single-headed households.
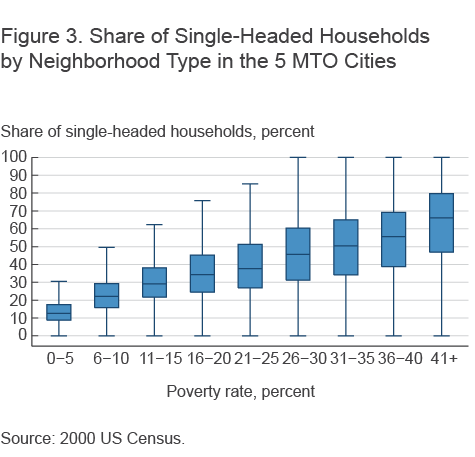
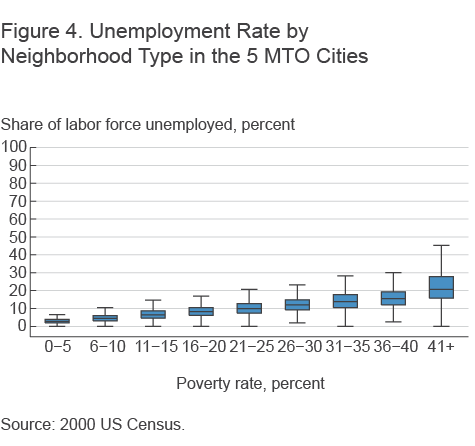
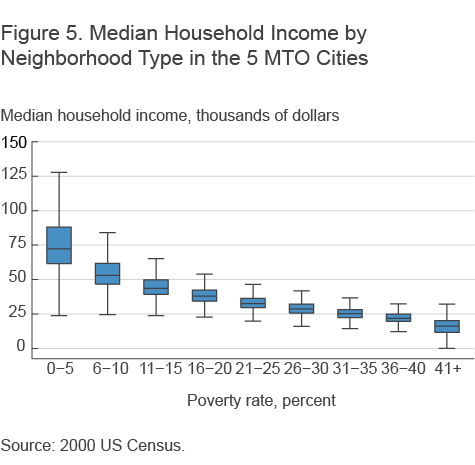
However, moving to a low-poverty neighborhood does not always represent an improvement in these neighborhood characteristics. There are plenty of high-poverty neighborhoods with low unemployment rates and low shares of single-headed households. The data on household income drives these points home. While there are no very-low-income, low-poverty neighborhoods, there are some high-poverty neighborhoods whose median household incomes are similar to the median household incomes in some low-poverty neighborhoods.
To summarize the basic point we take from these data, one could have moved from a high-poverty neighborhood to a low-poverty neighborhood without experiencing a change in other characteristics that determine neighborhood quality.
Neighborhood Poverty, Neighborhood Characteristics, and Racial Segregation
The preceding evidence leaves open several possibilities for the typical change in neighborhood characteristics experienced by MTO participants who moved to lower-poverty neighborhoods. We now investigate a potential clue for understanding whether moving an individual to a lower-poverty neighborhood changed other neighborhood characteristics for participants in the MTO program. One point made in the literature on MTO is that program participants tended to move to segregated neighborhoods comprising African Americans almost entirely. Racial segregation matters in this context because of its history in the United States: Neighborhoods with different poverty rates might appear relatively similar along other dimensions if their racial composition is similar. We find this to be the case in the five MTO cities.
Next we break neighborhoods into high- and low-poverty neighborhoods in which the cutoff is determined by the MTO experiment: low-poverty is less than 10 percent, and high-poverty is 10 percent and greater3 We consider a neighborhood to be predominately white if greater than 80 percent of its residents are white, and we consider a neighborhood to be predominately black if greater than 80 percent of its residents are black.
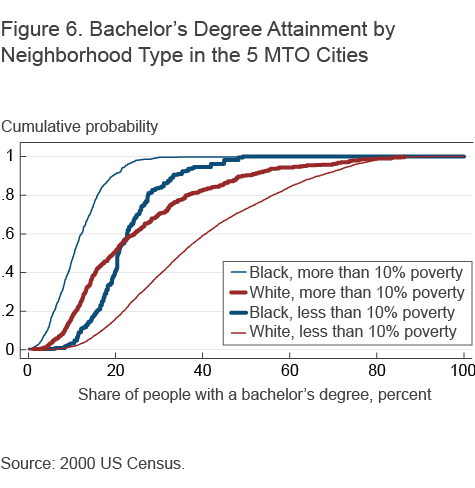
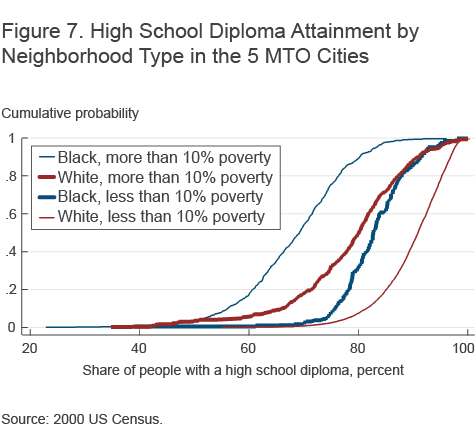
We see again that not all low-poverty neighborhoods are created equal: For several of the important characteristics that determine neighborhood quality, black low-poverty neighborhoods are more comparable to white high-poverty neighborhoods than to white low-poverty neighborhoods. In figures 6 and 7, lines shifting to the right indicate people who are living in neighborhoods with higher levels of educational attainment. We see that for bachelor’s degree attainment, black low-poverty and white high-poverty neighborhoods are comparable. For high school diploma attainment, black low-poverty neighborhoods fare better than white high-poverty neighborhoods but are still not comparable to white low-poverty neighborhoods. Black high-poverty and white low-poverty neighborhoods are shown in these figures for reference, particularly to demonstrate that the most comparable groups of neighborhoods across these racial groups are black low-poverty and white high-poverty neighborhoods.
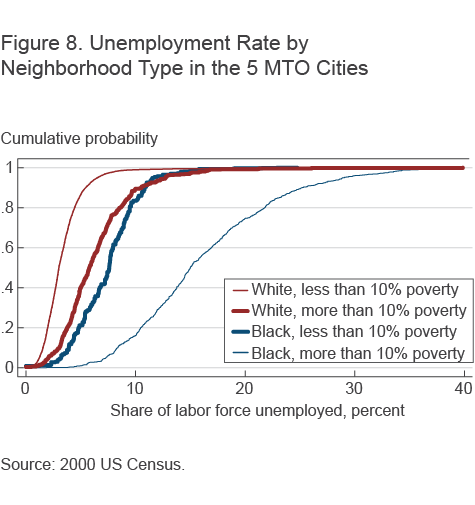
In figures 8 and 9, lines shifted to the left indicate populations living in neighborhoods with better outcomes (lower unemployment rates and lower numbers of single-headed households). For these outcomes, it is not only the case that black low-poverty neighborhoods are comparable to white high-poverty neighborhoods. Even more striking is that black low-poverty neighborhoods do not fare as well in these characteristics as do white high-poverty neighborhoods.
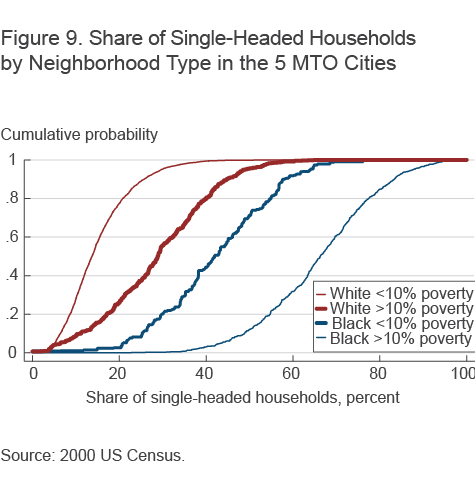
Because visual tests can be misleading, we also test and confirm that these impressions hold up to more formal statistical tests.4 The basic point we take from this part of the analysis is that the neighborhood poverty rate has a different relationship with other neighborhood characteristics in majority-black neighborhoods than it does in majority-white neighborhoods.
Conclusion
Although neighborhood effects are crucial for our understanding of the persistence of racial inequality in the United States, conclusive evidence on their nature remains elusive. Housing mobility programs such as the Moving to Opportunity experiment provide some of the best evidence on neighborhood effects but are still far from conclusive.
In this article we have studied census data important for understanding the changes in neighborhood characteristics experienced by MTO program participants. We presented evidence that program participants could have moved from high-poverty to low-poverty neighborhoods without changing neighborhood quality. We also showed that the moves typically made by MTO program participants—from one predominately black neighborhood to another—were less likely to change neighborhood characteristics than were moves to white low-poverty neighborhoods.
These results are helpful for understanding the types of changes in neighborhood environments experienced by MTO program participants and, therefore, for understanding how the results from MTO should inform our view of neighborhood effects.
Footnotes
- We think of opportunity in terms of the outcomes one receives in return for a given level of effort and ability. Alternatively, we could think of equality of opportunity in terms of equal access to the determinants of outcomes such as education and health care. Return to 1
- There are many ways to define a neighborhood’s quality. In this analysis, we adopt a statistical definition to help us measure and think about neighborhoods. Several important neighborhood characteristics are omitted from our definition of quality such as ties to family and friends, personal security, and social efficacy. Return to 2
- Note that “high-poverty” typically means greater than 40 percent poverty. See the discussion in chapter 1 of Paul Jargowsky (1997). Here we are focused on comparing neighborhoods across two racial groups. Return to 3
- We estimated quadratic regression equations for each neighborhood characteristic on poverty for black and white neighborhoods. We find that the coefficients for black neighborhoods are different than for white neighborhoods. Return to 4
References
- Aliprantis, Dionissi (2015). “Assessing the Evidence on Neighborhood Effects from Moving to Opportunity.” Federal Reserve Bank of Cleveland, working paper no. 15-06.
- Bobo, Lawrence D., Camille Z. Charles, Maria Krysan, and Alicia D. Simmons (2012). “The Real Record on Racial Attitudes,” in P. V. Marsden, ed., Social Trends in American Life: Findings from the General Social Survey since 1972. Princeton: Princeton University Press, pp. 38-83.
- Clampet-Lundquist, Susan, and Douglas S. Massey (2008). “Neighborhood Effects on Economic Self-sufficiency: A Reconsideration of the Moving to Opportunity Experiment,” American Journal of Sociology, vol. 114 (1), pp. 107–143.
- Jargowsky, Paul (1997). Poverty and Place. New York: Russell Sage Foundation.
- Ludwig, Jens, Jeffrey B. Liebman, Jeffrey R. Kling, Greg J. Duncan, Lawrence F. Katz, Ronald C. Kessler, and Lisa Sanbonmatsu (2008). “What Can We Learn About Neighborhood Effects from the Moving to Opportunity Experiment?” American Journal of Sociology, vol. 114 (1), pp. 144–188.
- NBER/MTO, “Moving to Opportunity (MTO) for Fair Housing Demonstration Program,” webpage.
- Sampson, Robert J. (2008). “Moving to Inequality: Neighborhood Effects and Experiments Meet Social Structure,” American Journal of Sociology, vol. 114 (1), pp. 189–231.
- Sampson, Robert J., and Patrick Sharkey (2008). “Neighborhood Selection and the Social Reproduction of Concentrated Racial Inequality,” Demography, vol. 45 (1), pp. 1-29.
- Wilson, William Julius (1987). The Truly Disadvantaged: The Inner City, the Underclass, and Public Policy. Chicago: University of Chicago Press.
Suggested Citation
Aliprantis, Dionissi, and Daniel Kolliner. 2015. “Neighborhood Poverty and Quality in the Moving to Opportunity Experiment.” Federal Reserve Bank of Cleveland, Economic Commentary 2015-04. https://doi.org/10.26509/frbc-ec-201504
This work by Federal Reserve Bank of Cleveland is licensed under Creative Commons Attribution-NonCommercial 4.0 International

