

- Share
Are Households Saving Enough for a Secure Retirement?
The recent rise in the personal saving rate has been interpreted as a sign that consumers are paying down their debt and repairing the damage done to their nest eggs. But a close analysis suggests that many people are falling short of saving what they will need to maintain their standard of living in retirement. A growing body of research in behavioral economics, a branch of economics that studies the choices people make at the individual level, offers explanations for why that is, as well as new approaches to the problem.
The views authors express in Economic Commentary are theirs and not necessarily those of the Federal Reserve Bank of Cleveland or the Board of Governors of the Federal Reserve System. The series editor is Tasia Hane. This paper and its data are subject to revision; please visit clevelandfed.org for updates.
The recent rise in the personal saving rate has been interpreted as a sign that consumers are paying down their debt and repairing the damage done to their nest eggs. But a close analysis suggests that many people are falling short of saving what they will need to maintain their standard of living in retirement. A growing body of research in behavioral economics, a branch of economics that studies the choices people make at the individual level, offers explanations for why that is, as well as new approaches to the problem.
After steadily declining for many years, the personal savings rate began to reverse course in mid-1999, rising moderately as households struggled to rebuild their net worth in the wake of two events (figure 1). The first was the sharp decline in the stock market, which had a disproportionately larger impact on wealthier households. The second event was the bursting housing bubble, which had a disproportionately larger impact on households in the middle to lower end of the wealth distribution. Many of these households had borrowed heavily during the heady years leading up to the crisis.
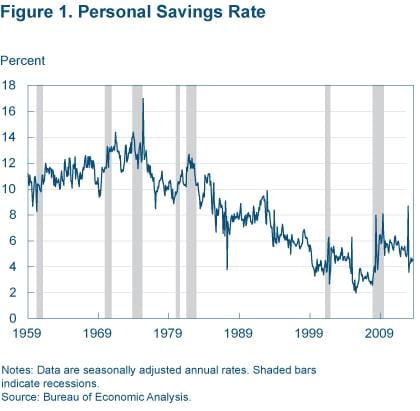
Notes: data are seasonally adjusted annual rates. Shaded bars indicate recessions.
Source: bureau of Economic Analysis.
Analysts have interpreted the increases in the savings rate since the crisis as a sign that consumers are paying down their debt and repairing the damage done to their nest eggs. But are they saving enough? This Commentary examines this issue in the context of the standard economic theory of saving. It finds that many households, if not most, are at risk of not having sufficient savings to retire. I offer several explanations for this shortfall.
Theory of Household Saving
The personal savings rate is a ratio of two measures—personal savings and personal disposable income (take-home pay). Personal savings equals the amount of disposable income not spent on consumer goods and services (consumption). The measured personal savings rate is aggregated across households of different means and at different stages of their lives. For example, those in the formative stages of their households have more time to adjust to the impact of the recent crisis than those in or near retirement. The younger households can assume greater investment risk in hopes of earning higher returns. To more fully appreciate how such factors influence savings, it is helpful to work with a theory that identifies how behavior differs across one’s lifetime.
The life-cycle hypothesis (LCH) is the most basic theory of household saving. It is based on the premise that households, or individuals more generally, make spending and saving decisions based both on their expected earning capacity over their lifetimes and on the investment returns they receive at different stages of life. A fundamental behavioral assumption of the theory is that households prefer to smooth their spending on goods and services over time. Figure 2 depicts a version of this theory that captures its key implications.
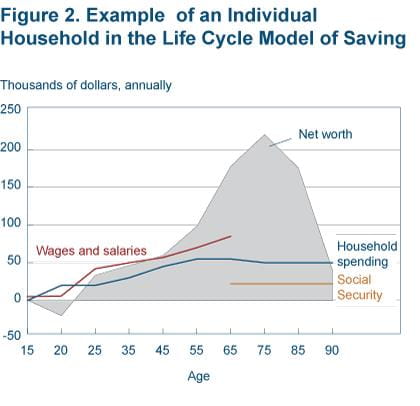
Note that the depicted household builds up net worth (wealth) relative to its income during the working stage of its life. Later on during retirement, if all goes as planned, they use the income derived from their accumulated wealth to support their anticipated lifestyle. Most often, at retirement they must also begin to sell from the stock of assets they acquired during their working lives. Depending on the household, they may wish to have some wealth when they die to bequeath to their children. This extra savings also provides a buffer if they live longer than expected. In the example presented in figure 2, the household plans to live to be at least 90 years old and have some remaining wealth to bequeath.
Figure 2 illustrates a case where a college-aged individual with few assets takes out student loans to pay for an education to increase his future earnings. Economists call the value of the education human capital or human wealth. The spending on education is an investment that is expected to yield higher wages and salaries during one’s working life.
Since human wealth is not easily measured, it is not included in most wealth measures (assets less debt). However, human wealth is eventually revealed in wealth, as the additional assets households can acquire with higher earnings over time. Because the student loan is not initially offset by this subsequent increase in total wealth, the loan can lead to temporary negative household net worth—measured as assets less the student debt. Car loans and mortgages have typically been collateralized by the value of the asset purchased and hence have no measured effect on net worth. (The net value of the asset is offset by the loan.)
Aggregate savings depends on fluctuations in the market value of household assets, like homes. For example, some of the decline in the personal savings rate no doubt reflected households’ perceptions that the sharp increase in the net equity value of their homes during the housing boom was permanent. This would explain the decline in the measured savings rate during the boom. It is now widely understood that mortgage lenders enabled a spending spree by liquefying houses with cash-out refinancing loans, allowing households to spend more that their disposable income.
Also, the desired stock of wealth at retirement will be related to expected lifespans—the longer one expects to live, the more one will need to save to retire on a given date, or the longer one will need to work.
Are Households Prepared for Retirement?
The most important implication of the LCH is that households should have accumulated enough wealth to secure their desired standard of living in retirement. That means they save so that they can maintain their lifestyle by living off the combination of pension income—including social security—and by drawing down on their wealth and the income it provides.
The LCH may explain the general pattern of saving and wealth accumulation during people’s working years. However, it is much more difficult to determine the appropriate level of wealth at the household’s expected retirement date many years in advance. In assessing the preparedness of households for retirement, Munnell (2012) argues that the wealth-to-income ratio is a good gauge for assessing how well households are prepared. Figure 3 compares this ratio for four age cohorts at three different points of time. The data are based on selected releases of the triennial Survey of Consumer Finances. The three profiles capture the contour predicted by the theory; that is, wealth rises relative to income over the working years of households.
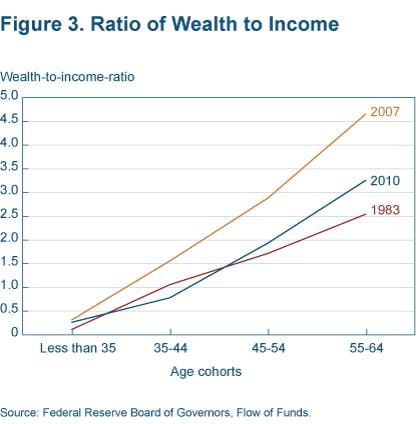
Source: Federal Reserve Board of Governors, Flow of Funds.
When comparing the wealth ratio of the oldest cohort in 2010 to the corresponding ratio in 1983, one should not conclude that those near retirement in the 2010 period are better prepared for retirement than the earlier cohort. Such a comparison ignores two important factors. First, people are living longer. Since 1983, the average life expectancy at age 65 increased 3.5 years for men and 1.8 years for women. The LCH predicts that households would need to accumulate greater wealth relative to income to maintain their living standard over the extra years.
Munnell offers another reason why households need a higher wealth-to-income ratio today. In 1983 most retirees could count on defined-benefit pensions that offered healthy income supplements to social security. The value of defined-benefit plans is not counted in measures of wealth. Households with defined-benefit retirement plans do not have to be as attentive to their retirement planning since the savings and attendant risk is assumed by the employer. As Munnell notes, since that time, defined-benefit plans have largely been replaced by defined-contribution plans, which are counted in the wealth measures, suggesting improvement where there is none.
Another bit of bad news for wealth holders today is that interest rate yields on safe assets such as CDs and government bonds are near record-low levels and likely to remain low in the near future. This is particularly bad for households that are in or near retirement and do not hold riskier assets that provide higher yields. Kopcke (2013) finds that retired households that live off of wealth held in short-term, low-risk assets have seen their retirement incomes fall the most sharply. They have little choice but to accept a lower standard of living than they had planned on. Retirees in 1983 could invest in safe short-term deposits yielding more than 5 percent.
What is particularly noteworthy about figure 3, however, is the sharp drop in the wealth-to-income ratio, especially for older cohorts, from 2007 to 2010, which is related to the financial crisis and the consequent Great Recession. Figure 4 illustrates the sharp, persistent downward shift of aggregate household net worth relative to its trend.
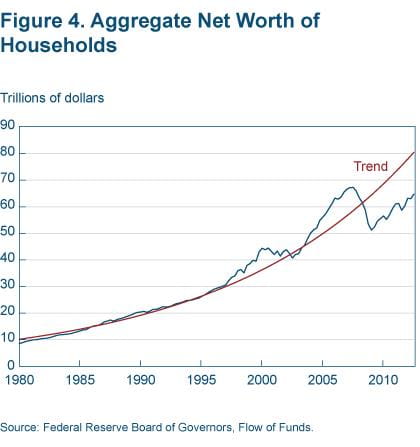
Source: Federal Reserve Board of Governors, Flow of Funds.
This downward shift in the trend level of household net worth is especially pernicious because it is largely driven by the collapse in housing prices. Unlike the value of equities, which have rebounded to near-1997 levels, housing prices have continued to fall until recently and remain well below their peak levels. For most households, their house is their single largest asset.
An associated downward shift in the trend in household spending is a key contributing factor to the slow recovery of the economy and to the longer spells of unemployment. Many households are struggling to rebuild funds depleted by unemployment spells. Longer spells of unemployment are consistent with a one-time downward shift in the level of net worth.
It should be clear that there is great dispersion across households regarding household preparedness for retirement. Munnell, Webb, and Golub-Sass calculate a measure that accounts for this variation. The National Retirement Risk Index illustrated in figure 5 estimates the percentage of households whose retirement may be at risk. Based on the 2010 Survey of Consumer Finances, this index shows that over half of households may be unable to maintain their standard of living in retirement. While the value of assets, including equities and housing, have rebounded some, the index will likely remain near its recent high when the Survey of Consumer Finances (2013) is made available in 2014.
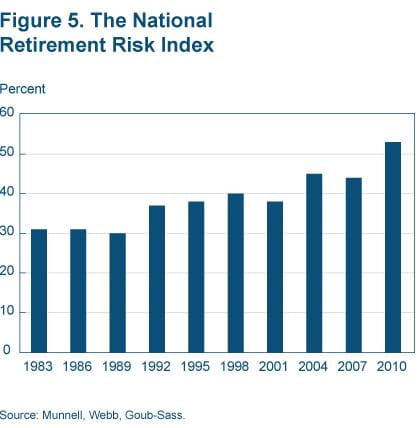
Source: Munnell, Webb, Goub-Sass.
Why Are So Many Households So Ill-Prepared?
Above I have alluded to several possible answers: an unanticipated increase in households’ lifespans, the decline in defined-benefit pensions, and a sharp unanticipated decline in household assets, hastened by the worst financial crisis since the Great Depression.
It seems unlikely that households do not realize that advances in modern medicine and auto safety, along with healthier lifestyles, continue to increase life expectancy. The decline in defined-benefit pensions is not a satisfactory explanation either: The details of the new plans were not secret. On closer inspection, these explanations are inconsistent with the basic LCH assumptions that households are rational and forward-looking and that they take changing trends into account when planning for retirement.
One explanation—bad luck—is at least consistent with the theory. It is not unrealistic to assume that households could not have anticipated the timing and magnitude of the financial crisis or its impact on their net worth. This explanation does not account for the steady rise in the National Retirement Risk index since 1983, however, though it is more consistent with the rise in defined-contribution plans, which leave an increasing number of households to make savings and investment decisions on their own.
A different sort of explanation is provided by a growing body of research in behavioral economics. This literature has shown that the LCH does not explain the saving behavior of many, if not most households, for a variety of reasons. Most households do not pay enough attention to financial planning. It may be because the decisions that need to be made are just too complex for the typical household. Many are aware of this and seek the advice of a financial planner. Others may not be able to afford such advice.
Benartzi and Thaler reviewed the behavioral research on household savings and argue that with a few changes to defined-contribution plans, the majority of households could be better prepared for retirement. First they propose that everyone should be given access to an employer-provided, salary-based defined-contribution plan. Then they identify three other ingredients essential to enforcing the discipline that households need in order to build adequate savings for retirement. These include automatic enrollment, automatic investment, and automatic escalation.
Automatic enrollment means employees must opt out, not opt in. One of the most important findings in behavioral economics is that many employees do not take advantage of employer matching on their contributions when they must opt in to a plan. They essentially leave money on the table. Offered the same deal, a significantly higher percentage of employees take advantage of the matching contribution when they must opt out. A plan requiring employers to auto-enroll employees in an IRA account has been proposed by the Obama Administration. Of course in any universal plan, employees would have the freedom to opt out.
Automatic investment means contributions are invested according to the default option, unless the employee chooses a different option. Behaviorists have found that many employees don’t feel comfortable with making investment decisions, and a default investment option prevents inaction on account of indecision. The Department of Labor has established a model for such a default option, with criteria for qualified investment vehicles and guidelines on diversification and portfolio rebalancing.
Automatic escalation means the amount invested from each paycheck would gradually increase over time. This feature counteracts people’s tendency to stay stuck for years at an insufficient rate of saving. Most people—about three—quarters of those who have an employer-provided investment retirement account—use a default savings rate of just 3 percent of income.
Benartzi and Thaler recommend an auto-escalation plan called Save More Tomorrow, which has three components: First, employees are invited to commit now to saving more later. Second, planned increases are linked to pay raises. Because the increase in savings just a portion of the pay raise, employees do not see their pay decline. Third, employees who sign up are in until they opt out. This third feature should counteract a well-documented inertial aspect of individual behavior.
Studying Behavior
Economics classes have traditionally taught a model of economic behavior that assumes people make rational choices throughout their lifetimes. While the LCH model may apply for many households, nearly half of households do not behave the way the model says they will. Those households end up with inadequate savings for a retirement that maintains their standard of living.
Behavioral economists are learning more about the choices people make at the individual level. Much of their research will be of great help in designing approaches to savings that will lead to greater retirement security for many if not most households.
Recommended Reading and Cited Works
- Shlomo Benartzi and Richard H. Thaler, 2013. “Behavioral Economics and the Retirement Savings Crisis.” Science, vol. 339.
- Richard W. Kopcke and Anthony Webb, 2013. “How Has the Financial Crisis Affected the Consumption of Retirees?” Center for Retirement Research at Boston College Brief, no. 13-12.
- Alicia Munnell, 2012. “2010 SCF Suggests Even Greater Retirement Risks,” Center for Retirement Research at Boston College Brief, no. 12-15.
- Alicia H. Munnell, Anthony Webb, and Francesca Golub-Sass, 2012. “The National Retirement Risk Index: An Update,” Center for Retirement Research at Boston College Brief, no. 12-20.
Suggested Citation
Henry, LaVaughn M. 2013. “Are Households Saving Enough for a Secure Retirement?” Federal Reserve Bank of Cleveland, Economic Commentary 2013-12. https://doi.org/10.26509/frbc-ec-201312
This work by Federal Reserve Bank of Cleveland is licensed under Creative Commons Attribution-NonCommercial 4.0 International

