

- Share
Alternatives to Libor in Consumer Mortgages
Many adjustable rate mortgages in the United States are indexed to Libor. While the accuracy of this rate has recently been called into question, another issue affecting U.S. borrowers has become evident since the onset of the financial crisis. Specifically, many U.S. consumers with Libor-based loans may have been hit with substantially higher payments when their loans reset during the financial crisis than if those loans had been tied to a Treasury rate. We investigate several alternative reference rates for consumer loans and estimate their payment effects on a large sample of Libor-linked U.S. mortgages. We find that these alternatives would have delivered savings over Libor of about $25 to $45 per month and substantially more for mortgages that reset in October 2008.

The views authors express in Economic Commentary are theirs and not necessarily those of the Federal Reserve Bank of Cleveland or the Board of Governors of the Federal Reserve System. The series editor is Tasia Hane. This paper and its data are subject to revision; please visit clevelandfed.org for updates.
The recent controversy surrounding the setting of Libor (the London Interbank Offered Rate) may cause some to wonder whether it is an appropriate reference rate for consumer loans. In our view, an appropriate reference rate would have (at least) two properties: It would be free from concerns about manipulation, and it would represent a low-risk benchmark interest rate much like the Libor was before the financial crisis.
The first property has received much attention in the media, and British regulators are attempting to address it. The Wheatley report recommends both short-run actions to better connect reported rates with market transactions and longer-run possibilities, which include replacing Libor with alternative rates for some purposes. These efforts are important and receiving ongoing international attention; however, they might cause Libor to move a couple of basis points higher or lower, which could be very valuable in derivatives markets, but would have very little impact on consumers’ costs.
The second property has received less attention, but it could have a bigger impact on consumers. This Commentary focuses on the implications for U.S. borrowers of the failure of Libor as a low-risk benchmark. We compare some of the possible alternatives to Libor before the financial crisis and estimate the impact each would have had on consumers if these alternatives had been the reference rate on their loans. In particular, we simulate the payment effects of these alternatives on a large sample of Libor-linked U.S. mortgages originated on or before July 2008. Over the subsequent four-year period, we find that these alternative indexes would have delivered average monthly savings over Libor of about $25, and substantially more for mortgages that reset in October 2008, when Libor diverged sharply from other similar short-term interest rates.
Libor
Libor is calculated from the self-reported, unsecured borrowing costs of 18 large international banks operating in London. Each day, these banks are asked to report the interest rates at which they could borrow at several different maturities, from overnight to one year, on several different currencies. The fact that reported rates are not necessarily, or even typically, based on actual transactions leaves the system open to the misreporting and conflicts of interest that have recently come to light.
To address these problems, British regulators have proposed providing official oversight for the submitted rates and connecting these rates more closely with market outcomes. For U.S. dollar rates, the proposed reforms would include requiring documentation on the rates that the banks paid for deposits and dropping several time horizons that were difficult to connect to specific transactions. These measures would help to make the rate more market focused.
But the bigger issue for borrowers in the United States has been the fact that some of the reporting banks have at times had to pay higher rates due to market perceptions of the risk associated with lending to these banks. In our view, the purpose of an index rate in an adjustable rate consumer loan is to link the borrower’s payment levels to the overall interest rate structure, which is typically done by indexing the loan to a low-risk benchmark. The risk associated with a particular consumer loan can then be accounted for in the margin paid above the index rate, so that even subprime borrowers could have loans linked to a low-risk benchmark like Libor.
Prior to the financial crisis, Libor was a reasonable and reliable proxy for a very low-risk interest rate. How can we see this? The six-month Libor rate averaged just 12 basis points higher than the “risk-free” six-month Treasury rate from 2000 to 2007. But during the financial crisis, some of the banks participating in the Libor survey were viewed as having a greater risk for failure, and this risk was then priced into Libor. Accordingly, Libor became significantly higher than other similar short-term interest rates and remains somewhat elevated relative to these rates even today.
The Alternatives
What would a good alternative to Libor look like? Because they satisfy the two criteria we suggested above, we favor alternatives that are market-based and that reflect the low-risk borrowing rates that were effectively captured by precrisis Libor. Additionally, a rate that is not susceptible to large day-to-day swings, which could lead to windfall gains or losses depending on the day a loan is scheduled to reset, would also be desirable.
One option for consumers who take out adjustable rate mortgages (ARMs) would be to link the ARMs with Treasuries. The one-year Treasury constant-maturity rate, as published by the Federal Reserve Board of Governors, is the other common rate for mortgage indexation in the United States, and it was used widely before Libor became more prominent. One argument against using Treasuries as a benchmark rate is that Treasuries have been exposed to “flight-to-quality episodes,” where investors shift an inordinate amount of investment into very low-risk securities, depressing their yields. This tendency could make investors less inclined to purchase securities whose underlying assets were mortgages linked to Treasuries. Nevertheless, there are still loans linked to Treasuries being originated today.1
While the Treasury rate still seems like one good option, there are other good candidates, which are more similar to Libor rates, in that they are associated with bank borrowing costs rather than government borrowing costs. For example, one possibility is the “effective” federal funds rate, which measures interbank borrowing costs on deposits that banks hold with the Federal Reserve to meet their reserve requirements.2 Indeed, the British equivalent of the federal funds rate is used in the United Kingdom for a popular form of ARM known as a “tracker mortgage.” Perhaps the largest disadvantage of the federal funds rate is that it is an overnight rate, so it does not reflect the term premium associated with lending over a longer horizon, like Libor does.
Fortunately, there are other market rates which do account for the term premium in bank funding markets. The rate on overnight indexed swaps (OIS) measures the expected average of overnight interest rates over a fixed horizon. This rate is market-based and regularly published for maturities from overnight to two years. It is also based on a low-risk transaction: since it is an interest-rate swap agreement, the principal of the loaned funds supporting the transaction is never at risk. In the United States, OIS contracts are based on the average federal funds rate expected over a given horizon.
Finally, some newer alternative series like repo rates (for example, General Collateral Finance Repurchase Agreements) could serve as market-based alternatives to Libor. The repo market is a major source of wholesale funding for banks and is highly liquid. The lending is fully collateralized, so counterparty risk is not a major factor in yields. While repo rates are an interesting option, they were not available prior to the financial crisis. This makes it difficult to evaluate how well these rates will reflect the overall structure of interest rates in normal times.
Figure 1 shows that many of these rates moved closely together prior to the financial crisis, even on a daily basis, though there are clearly differences in their average levels and occasional idiosyncratic movements. The figure also shows that after the financial crisis takes hold, Libor is clearly distinct from the other interest rates. During this period, the elevation in Libor reflects concerns about the ongoing viability of money center banks. More recently, in 2012, Libor moves up and down over concerns about the size of European sovereign debt risk on bank balance sheets. Even setting these fluctuations aside, it’s important to note that Libor has maintained a much wider gap over other rates than was true prior to the financial crisis.
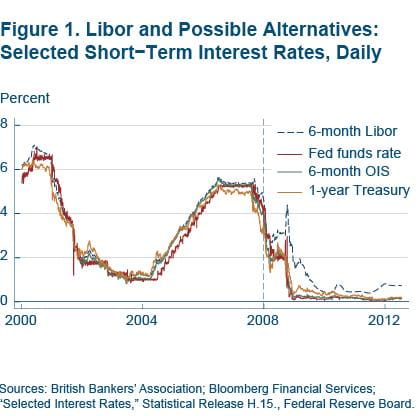
Sources: British bankers' Association; bloomberg Financial Services; "Selected Interest Rates." Statistical Release H. 15., Federal Reserve Board.
The level of risk each rate reflects, whether due to concerns about counterparties or simply the duration of a loan, is distinct. This might seem to rule out alternatives to Libor that include more or less risk and thus are on average higher or lower. But if the premiums paid to these risks are essentially constant, all that is needed is a simple adjustment. Using the precrisis period, we attempt to isolate these differences, in order to make this simple adjustment. To do this, we regress six-month Libor on the alternatives discussed above, from January 2000 to December 2007.
This regression identifies the average difference between each of these alternative rates and Libor, and also accounts for the degree to which the two rates move together. The average difference in the rates is of particular interest because it represents the adjustment that needs to be made in an alternative rate for this rate to reflect the bundle of risks that the precrisis Libor reflects. For example, a low-risk security like a U.S. Treasury of the same duration would need to be adjusted slightly upward to be comparable to the six-month Libor. Finally, the R2 of the regression summarizes the tightness of this relationship.
Table 1 shows the regression estimates for each alternative rate. The estimates on these coefficients are quite tight, so the differential in the rates typically has a 95 percent confidence interval of plus or minus 2 basis points. The estimated comovements of the interest rate pairs are close to one, although statistically only the six-month OIS is indistinguishable from a one-to-one comovement. When the comovement is estimated to be over one, this implies that an alternative’s variability needs to be amplified to fit Libor; when the value is estimated to be less than one, this implies that the alternative’s variation needs to be reduced to fit Libor.
| Alternative | Predicted differential (alpha;) | Comovement (β) | Model fit (r2) |
|---|---|---|---|
| Federal funds rate | 0.283 | 0.992 | 0.977 |
| OIS-6 month | 0.163 | 1.000 | 0.991 |
| OIS-1 year | −0.130 | 1.044 | 0.971 |
| Treasury-6 month | 0.120 | 1.057 | 0.986 |
| Treasury-1 year | −0.236 | 1.135 | 0.976 |
The model fit for each of these alternatives is high, which combined with the near-one-to-one comovements and tightly estimated differentials indicates that these rates were reliably linked prior to the financial crisis. These results suggest that it is reasonable to consider a simple adjustment to the alternative interest rates in order to mimic Libor in the precrisis period. Ultimately, the market for ARMs would determine what the premium would be for loans based on a given alternative, but as a starting point, these simple adjustments are a useful approximation for expected market outcomes.
Figure 2, in three panels, plots six-month Libor against alternative rates that have been adjusted using the information in table 1. The tight link between the alternatives, after adjustments, and Libor in the precrisis period is very evident. After 2007, however, these “Libor-consistent” alternatives don’t track Libor very well. In part, this gap reflects the fact that Libor, following the financial crisis, is now embedding new risks, or more precisely now embedding nonzero credit risk associated with the banks in its panel.
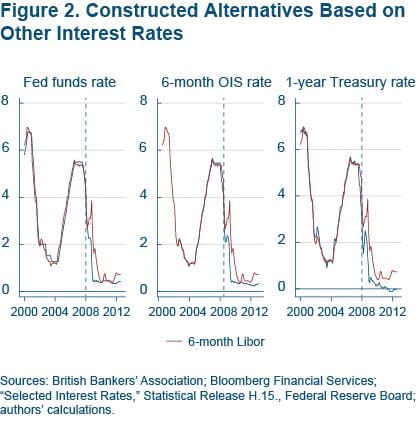
Sources: British bankers' Association; bloomberg Financial Services; "Selected Interest Rates." Statistical Release H. 15., Federal Reserve Board; authors' calculations
Interest Rate and Monthly Payment Simulations
To conduct our simulation of the effects of alternative indexes on consumer mortgage rates, we rely on loan-level data from LPS Applied Analytics. This dataset covers about two-thirds of all mortgages in the United States. We begin with the loans that existed in July 2008, just prior to the most acute phase of the financial crisis, and prior to the point when Libor rates spiked. Since we’re interested specifically in the loans linked to Libor, we focus on only these loans. Out of the roughly 38 million first-lien U.S. mortgages in the dataset at this time, Libor-linked mortgages constituted about 8.7 percent—or about 3.3 million—and represented a little more than half of all outstanding nonoption ARMs.
Within this group, about 80 percent are prime, and about 20 percent are subprime. The vast majority of these mortgages (95 percent) have 30-year terms. Most are hybrid ARMs, which means that the interest rate on the loan is fixed for some prespecified term. For example, more than half of the prime ARMs in this dataset are so-called 5/1 loans. These loans have a fixed interest rate for five years, and they reset on an annual basis thereafter. The 7/1 and 10/1 mortgages account for another approximately 20 percent of prime loans. And 2/28 and 3/27 loans—which have two and three-year fixed-rate periods, respectively—make up approximately another 20 percent. These last two types make up the vast majority of subprime ARMs in this dataset, accounting for about 92 percent. Unlike prime ARMs in the dataset, wherein approximately three-quarters reset every year, nearly all subprime ARMs in this sample reset every six months.
For each mortgage in our sample of Libor-linked loans, we project the payment differences that homeowners would have seen had their mortgages been linked to an alternative to Libor, of the sort shown in Figure 2. ARMs typically come with caps that limit how much a mortgage’s interest rate can change, either during its periodic resets or over the life of the loan. We implement the adjustment caps that are identified in the LPS data for each individual loan. This feature blunts the impact of any abrupt and significant changes in an index rate on a mortgage, so not accounting for these features would exaggerate the costs of temporarily elevated Libor rates.
As alternatives to Libor, we focus on three rates: the federal funds rate, the six-month overnight indexed swap (OIS) rate, and the one-year U.S. Treasury rate. Using these as the bases for alternative indexes, we project the prospective costs for our set of Libor-linked loans originated on or before July 2008, from that point to July 2012. We do not model or include prepayment or default in these calculations, in order to establish a clear baseline in the potential for cost differences. Given the lower interest rates we are modeling, we would expect the potential for prepayments or defaults to also be lower, but we have no clear basis for estimating how much lower. To the extent that elevated Libor rates cause extra prepayments or defaults, these are further costs that consumers would avoid with an alternative index rate. To the extent that prepayments or defaults would occur regardless of the index rate, estimates of the total cost to date are an overestimate.
To clarify how the simulation works, Figure 3 shows the interest rate and payment differences on an actual loan which reset in October of 2008. The particular loan was chosen because it had the median level of payment differences among loans resetting at that time, when Libor rates were unusually high relative to the alternatives.
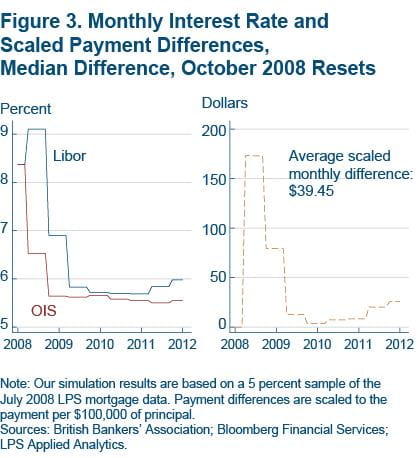
Note: Our simulations results are based on a 5 percent sample of the July 2008 LPS mortgage data. Payment differences are scaled to the payment per $100,000 of principal.
Sources: British Bankers' Associations; Bloomberg Financial Services; LPS Applied Analytics.
The left panel of Figure 3 shows the how the interest rate moves when indexed to Libor versus the OIS six-month alternative. Following the October 2008 reset, the rate difference would have been a substantial 2.5 percentage points, which would have persisted for six months. During the next reset, in April 2009, the loan’s interest rate under either index would have fallen, but a gap of 1.5 percentage points would then have remained for the subsequent six months. This occurs because the loan terms include limited adjustments at reset dates.
This divergence generates different monthly payment patterns depending on the size of the loan, so we have scaled the monthly payment difference per $100,000 of principal. Figure 3 shows that for this loan, the interest rate differences translate into scaled monthly payment differences of about $170 in the initial reset and about $80 in the subsequent reset (right panel). The two index rates converge for a time beginning in 2009, but they diverge again in late 2011. For the entire period, the average monthly payment difference per $100,000 of principal for this loan is almost $40. Since the average loan balance in this dataset is about $215,000, that would correspond to a monthly payment difference of about $86 for the average mortgage.
Fortunately for borrowers, not all loans reset in October 2008. The projected average monthly payment differences between the aforementioned alternative indexes and Libor are shown in column 1 of figure 4. For the federal funds rate, the OIS rate, and the U.S. Treasury rate, the savings over Libor were approximately $26, $30, and $46 per month, respectively, or $1,274, $1,470, and $2,254, respectively, over the entire projection period.
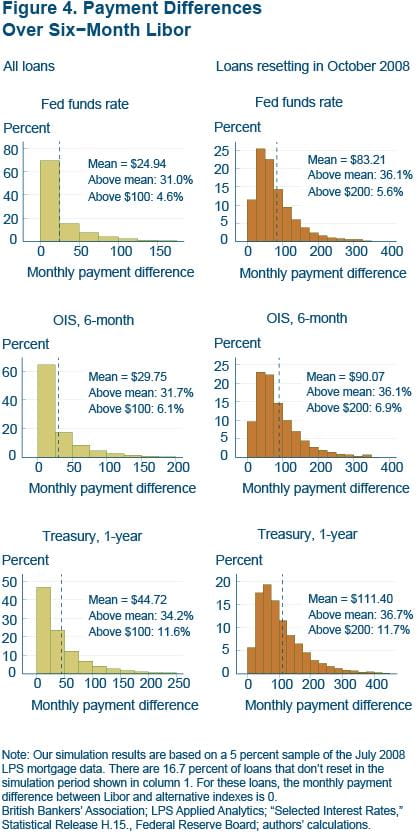
Note: Our simulations results are based on a 5 percent sample of the July 2008 LPS mortgage data. There are 16.7 percent of loans that don't reset in the simulations period shown in column 1. For these loans, the monthly payment difference between Libor and alternative indexes is 0.
Sources: British Bankers' Associations; LPS Applied Analytics; "Selected Interest Rates," Statistical Release H.15., Federal Reserve Board; authors' calculations.
A fairly large fraction of borrowers would have seen average monthly payment savings of less than $25 under all three scenarios. This is primarily the result of not reaching their reset period before 2012. A majority of these borrowers would still have been in the initial phase of their ARM contracts. For example, a 5/1 ARM has a fixed interest rate for five years before a reset occurs, so that a 2008 origination would not reset until next year. About 17 percent of the borrowers in our sample of borrowers would not experience a reset at all during the projection period.
While many borrowers would have seen no difference in their monthly payments, many more would have experienced substantial savings under the alternatives. Under all scenarios, about a third of borrowers would have seen savings equal to or greater than the average. Moreover, a sizeable fraction—about 5 percent for the federal funds and OIS alternative rates and about 10 percent for the Treasury alternative rate—would have seen an average monthly payment difference equal to or exceeding $100.
These differences, of course, can be even more substantial at times when Libor diverged sharply from other short-term borrowing rates, and mortgage holders faced resets. October 2008 is one such period, when the six-month Libor rate reached about 4.5 percent. For the affected borrowers, the savings they would have experienced had their loans been linked to alternatives based on the federal funds rate, the OIS rate, or the U.S. Treasury rate rather than Libor amounted to approximately $87, $94, and $116 per month, respectively (shown in row 2 of figure 4), or $4,263, $4,606, and $5,684, respectively, over the entire projection period. In addition, a sizeable fraction—at least 5 percent for the federal funds and OIS alternative rates, and almost 10 percent for the Treasury alternative rate—would have seen an average monthly payment difference equal to or exceeding $200. Overall, our simulations indicate that the effect of the period of elevated Libor rates on many borrowers was limited due to the timing of their resets, but a sizable fraction of households with Libor-linked loans may have experienced substantial payment increases relative to similar alternative interest rates.
Conclusion
We believe that there are viable alternatives to Libor for ARMs, which, if properly adjusted, could serve as an appropriate reference rate for consumer loans. In our view, both the one-year Treasury rate and the six-month OIS rate would be strong candidates as preferred reference rates for consumer loans. Both are market-determined rates, and for different reasons, neither contains any meaningful counterparty credit risk. In the case of U.S. Treasuries, the U.S. government is perceived to be a borrower that, as a practical matter, won’t default. For OIS, since no principal is exchanged and the reciprocal interest obligations are netted against one another (or swapped), the risk that this contract won’t be fulfilled is small, relative to a loan of (notionally) the same size. Treasury rates are a particularly good option because many ARMs are already linked to them, and the market for U.S. Treasury securities is one of the most liquid in the world. Six-month Treasury rates moved very closely with six-month Libor before the financial crisis, with a differential of about 12 basis points.
At times though, during periods of market stress, the view has been that the yield for Treasuries was extraordinarily low due to the special demand for these particular securities. If this is a significant concern for lenders or investors in mortgage-backed securities, then OIS could serve as a good alternative as well. Prior to the financial crisis, six-month OIS rates tracked movements in six-month Libor virtually one-to-one, with an average differential of about 16 basis points. But because there is no risk to the implicit principal, it avoids embedding any counterparty credit risk, and thus didn’t show the swings that Libor exhibited after 2007.
Our simulations show that many Libor-linked loans would have experienced noticeably lower payments if they had been linked to either a one-year Treasury or six-month OIS index, even after these indexes are adjusted for their precrisis interest rate differentials. On average, alternative index rates would result in meaningfully lower payments for loans that were linked to Libor in 2008 even though borrowers who took out these loans would have had little reason to suspect that Libor would, at some point, diverge from Treasuries and other comparable rates, and cease to be a good reflection of low-risk borrowing rates.
Footnotes
- While it is difficult to determine why both the Treasury rate and Libor are currently in use, a prominent collector of mortgage rate data (bankrate.com) views Libor-ARMs with margins of 2 percent–3 percent as the rough equivalent of Treasury-linked ARMs with margins of 2.5 percent to 3 percent. Return
- This rate differs subtly from the federal funds rate target, which is what the Federal Open Market Committee sets as a policy objective. Federal Reserve intervention in this market is designed to keep the market rate, or the effective federal funds rate, close to this target. Return
Suggested Citation
Schweitzer, Mark E., and Guhan Venkatu. 2012. “Alternatives to Libor in Consumer Mortgages .” Federal Reserve Bank of Cleveland, Economic Commentary 2012-14. https://doi.org/10.26509/frbc-ec-201214
This work by Federal Reserve Bank of Cleveland is licensed under Creative Commons Attribution-NonCommercial 4.0 International

