

- Share
Explaining Apparent Changes in the Phillips Curve: Trend Inflation Isn't Constant
Monetary policymakers look to the Phillips curve—an expression of the relationship between inflation and the degree to which the economy is operating relative to its potential—for information about the cost of actions undertaken to lower inflation. Recent estimations of the curve suggest it is deviating from historical norms. We argue that changes in trend inflation and Fed operating procedures are not being taken into account in these estimations and that when they are, changes in the curve are minor and need not concern policymakers.
The views authors express in Economic Commentary are theirs and not necessarily those of the Federal Reserve Bank of Cleveland or the Board of Governors of the Federal Reserve System. The series editor is Tasia Hane. This paper and its data are subject to revision; please visit clevelandfed.org for updates.
Monetary policymakers look to the Phillips curve—an expression of the relationship between inflation and the degree to which the economy is operating relative to its potential—for information about the cost of actions undertaken to lower inflation. Recent estimations of the curve suggest it is deviating from historical norms. We argue that changes in trend inflation and Fed operating procedures are not being taken into account in these estimations and that when they are, changes in the curve are minor and need not concern policymakers.
With a dual mandate to control inflation and maintain “full employment,” Federal Reserve policymakers have a keen interest in understanding the behavior of inflation. One tool many have relied on as they try to achieve this mandate is the Phillips curve, which depicts links between inflation (past, present, and future) and the output gap, that is, the percent by which actual output deviates from its potential. While periodically subject to criticism and revision, the curve has traditionally been viewed as a source of information about the effects of changes in inflation on output.
Those who follow it have recently noticed two important deviations from historical norms in certain aspects of the curve. First, the degree to which current inflation depends on past inflation—a relationship referred to as inflation persistence—has declined rather dramatically. Second, the slope of the Phillips curve, which reflects the relationship between current inflation and the output gap, has declined almost as dramatically.
But estimating the Phillips curve is fraught with problems, and it is possible that these observations reflect quirks in estimation rather than real changes in the Phillips curve itself. In particular, an assumption implicit in estimating the curve is that long-term, or trend, inflation is constant. The fact that it is not really constant is likely distorting the curve’s estimation. We investigate this question and find that when we re-estimate the curve and allow for a changing and declining long-term inflation trend, we obtain a different picture of the curve and a different interpretation of changes to it. Namely, the timing of the decline in inflation persistence is likely to have occurred not in 2000 but around the early 1980s, and while the slope of the Phillips curve has changed a little, the difference is not significant.
Moreover, the timing of the change in inflation persistence suggests that the change may be a byproduct of a changing monetary policy environment. It roughly corresponds to the year in which the central bank changed its operating procedure (1983), adopting a more aggressive response to inflation. Such a change in central bank behavior can make it seem as if the relationships underlying the Phillips curve have changed when they have not. (For the details of this argument, see the Recommended Readings.) All in all, we argue that the relationship between current inflation and output that is implied by the Phillips curve has probably not changed.
The Phillips Curve and Policy
If the relationships underlying the Phillips curve have changed, there are important policy implications. Both inflation persistence and the slope of the curve provide information about the cost of actions undertaken to lower inflation. The cost is referred to in terms of the curve’s sacrifice ratio, which is the cumulative change in output associated with a permanent decline in inflation of one percent.
The slope of the curve determines how far output must fall below potential (that is, how much the output gap has to be widened) to lower inflation one percentage point. If the slope of the Phillips curve has become flatter, as recent evidence seems to suggest, it implies that the sacrifice ratio is now larger, meaning the central bank must allow output to fall further below potential (that is, it must open up a larger gap) to achieve a given reduction in inflation. Such an action would be implemented by increasing the federal funds rate.
Less inflation persistence could also make it more costly to lower the inflation rate permanently. When inflation persistence is high, changes in the fed funds rate have longer-lasting effects, and fewer changes are needed to achieve a given change in the inflation rate. For example, with more inflation persistence, an increase in the funds rate today will have an effect on inflation tomorrow and will keep inflation lower both today and in the future. This means fewer rate increases would be needed in the future to keep inflation down. With little inflation persistence, things work in reverse. The interest rate increase necessary to lower inflation would have a temporary effect, and more rate increases would be required in the future to keep inflation low.
Therefore, both weaker inflation persistence and a flatter slope imply a larger sacrifice ratio, which is especially troublesome for monetary policymakers. In either case, if the Fed wanted to permanently lower inflation from, say, 2 percent to 1.5 percent, a larger output gap would have to be opened up for a longer period of time.
There is one positive policy implication associated with less inflation persistence. Because less persistence implies that shocks to inflation are temporary, when inflation rises in the short term, policymakers may have the luxury of simply waiting for inflation to return to normal of its own accord rather than having to open an output gap to bring it back down.
Changes in the Inflation Process
Figures 1 and 2 show why many think that the inflation process has fundamentally changed. The figures plot inflation persistence and the slope of the Phillips curve in rolling 10-year windows, using the standard assumption that trend inflation (the long-term inflation target of the central bank) is constant over time. The slope of the Phillips curve measures the effect of the output gap on inflation. From these figures, it appears that around 2000, inflation persistence and the impact of the output gap on inflation both declined substantially. The curve’s slope, whose descent was interrupted by a brief blip, is now negative. However, the actual slope may not be negative, since pure chance could cause the estimate of a small positive slope to go negative.
Figure 1. Inflation Persistence
Notes: Inflation is based on unfiltered core PCE data. Coefficients are calculated using 10-year rolling regressions of inflation on the output gap and four-quarter lags of inflation. Inflation persistence is defined as the sum of the four-quarter-lag coefficients.
Sources: BEA; the Congressional Budget Office; authors’ calculations.
Figure 2. Output Gap’s Effect on Inflation
Notes: The output gap is defined as the natural log of real gross domestic product less the natural log of potential gross domestic product, taken from the Congressional Budget Office. Output gap coefficients are calculated using 10-year rolling regressions of unfiltered inflation data on the output gap and four-quarter lags of inflation.
Sources: Bureau of Economic Analysis; the Congressional Budget Office; authors’ calculations.
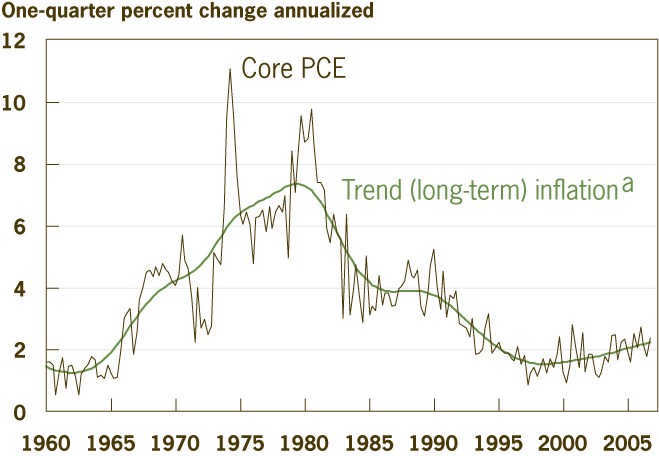
Yet the timing of the decline in inflation persistence suggests something else may be going on. Persistence begins to decline around 2000. Before then, every percentage point increase in the previous year’s inflation was associated with almost a 1 percentage point increase in current inflation. Six quarters later, that number had fallen to 0.4. Around the same time—1997—inflation, which had been declining steadily since the early 1990s, began to level off (or even to increase slightly; see figure 3).
Figure 3. Core PCE
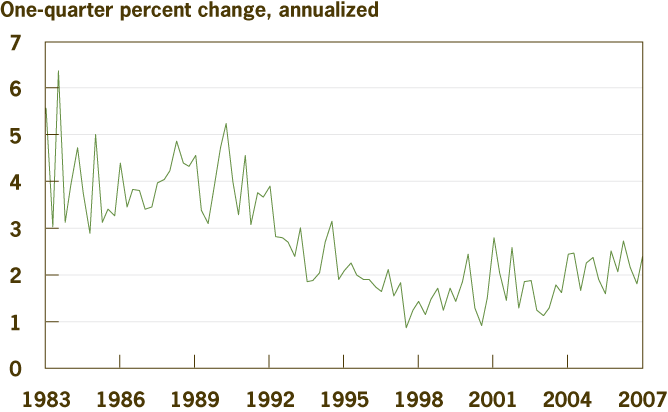
Source: Bureau of Economic Analysis.
Since the Phillips curve holds fixed the level of trend inflation, it tells us the degree of inflation persistence and gives a slope curve for a given level of trend inflation. But the drop in inflation persistence appears to be occurring when trend inflation was declining. The result is that persistence from the gradual fall in inflation—and probably trend inflation as well—before the late 1990s may have caused us to mismeasure both the slope and the amount of inflation persistence in the Phillips curve. In particular, a sustained decrease in long-term inflation could have picked up persistence in the declining inflation trend, thereby artificially increasing measured inflation persistence. Just because inflation appears to be highly persistent when trend inflation is slowly falling does not imply there will be persistence when it is fairly constant, as arguably has been the case since around the late 1990s.
To assess whether persistence in the inflation trend has artificially added persistence to observed inflation, we need some measure of trend inflation. One possibility is the projections of professional forecasters, who are asked what they expect inflation to average over the next 10 years. Their expectations are not a perfect substitute for trend or long-term inflation expectations, which are expectations of what inflation will be in 10 years. Nevertheless, the forecasters’ inflation expectations suggest that the market anticipated a change in the long-run inflation rate in the 1980s and 1990s that subsequently leveled off (see figure 4).
Figure 4. Inflation Expectations
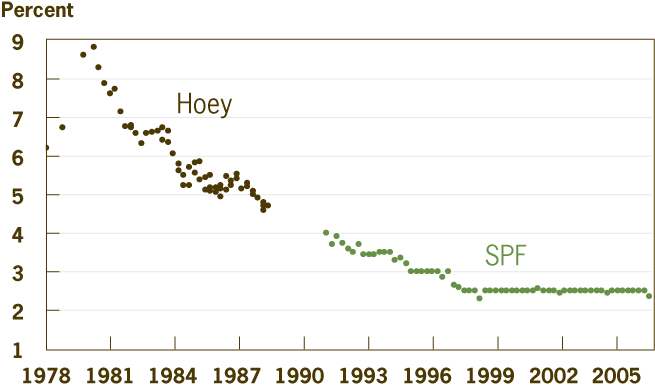
Sources: Survey of Professional Forecasters; the Hoey Survey.
Unfortunately, professional forecasters have only been polled since 1978, and even then there are noticeable gaps in the data. This and other drawbacks make these projections a poor choice for adjusting the raw inflation data. They certainly would not allow us to investigate the hypothesis, proposed by some, that the high degree of inflation persistence in the 1970s was illusionary and existed because of a changing trend in inflation. Indeed, over the entire sample, the inflation series appears to have several different plateaus, starting low, ranging higher, and then falling back.
Another approach is to proxy for long-term inflation by smoothing the inflation data. We smooth the data using the trend line shown in figure 5, which can be thought of as our rough estimate of the Fed’s long-term inflation target. While clearly an imperfect measure of trend inflation, it provides a clear and simple way of illustrating the impact a changing inflation trend can have on measured inflation persistence.
Figure 5. Core PCE and Trend Inflation
Notes: Data are detrended using an HP filter (lambda = 1600).
Sources: Bureau of Economic Analysis; and the Congressional Budget Office.
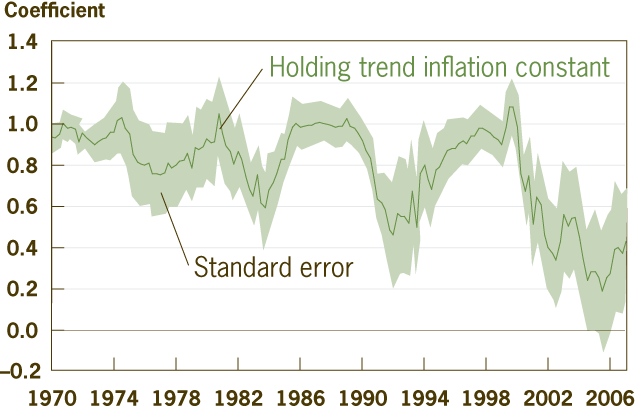
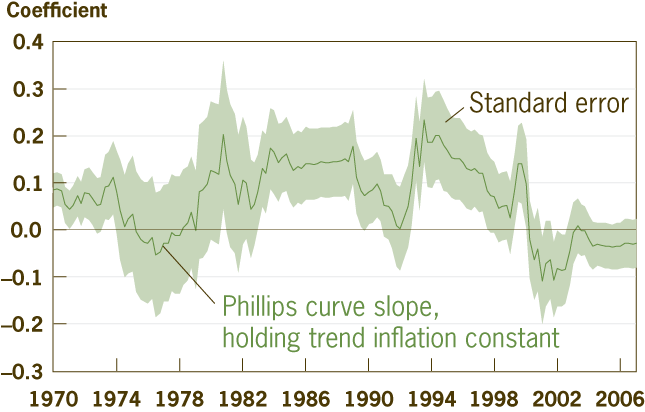
Figures 6 and 7 show our estimates of inflation persistence and the slope of the curve after controlling for changes in the long-run trend. The dramatic decline in inflation persistence that occurred around 2000 in the raw data has been pushed back to around 1990. The flattening of the slope, which, as we said, reflects the diminishing impact of the output gap on inflation, has also been pushed back. Furthermore, the magnitude of the current decline in inflation persistence is historically unusual, but the decline in slope does not seem so much so. It is a modest decline, and its current value is not necessarily low by historical standards.
Figure 6. Inflation Persistence (corrected)
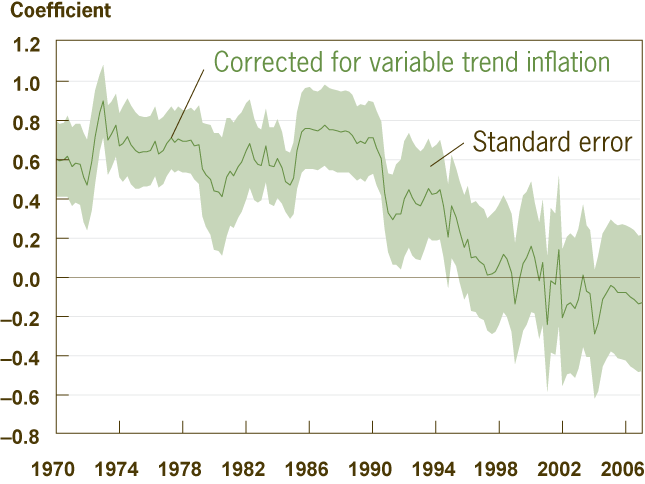
Notes: Variable long-term inflation is based on HP-filtered core PCE data (lambda = 1600). Coefficients are calculated using 10-year rolling regressions of inflation on the output gap and four-quarter lags of inflation. Inflation persistence is defined as the sum of the four-quarter-lag coefficients.
Sources: BEA; Congressional Budget Office; authors’ calculations.
Figure 7. Output Gap’s Effect on Inflation (corrected)
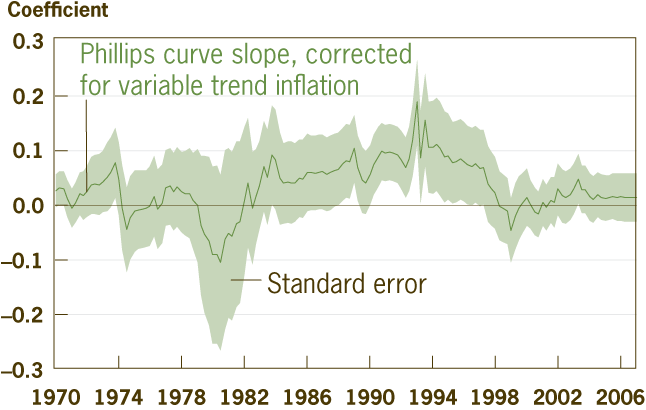
Notes: The output gap is defined as the natural log of real gross domestic product less the natural log of potential gross domestic product, taken from the Congressional Budget Office. The output gap coefficients are calculated using 10-year rolling regressions of HP-filtered inflation (lambda = 1600) on the output gap and four-quarter lags of inflation.
Sources: Bureau of Economic Analysis; the Congressional Budget Office; and authors’ calculations.
Phillips Curve, Same as It Ever Was
After correcting for changes in trend inflation, our estimates suggest that there has been little change in the Phillips curve slope (thus little change in the output gap’s effect on inflation) but that inflation persistence declined sharply starting in about 1990. Since these are 10-year rolling windows, the change that led to the decline in inflation persistence could conceivably have occurred any time between 1980 and 1990. But did inflation persistence in the Phillips curve really decline, or could there be other explanations for these estimates?
As always, it is difficult to draw clear inferences from the data. Again, the timing of the change suggests several possible suspects, none of which actually implies a change in the underlying inflation persistence in the curve. One is expected inflation, which is another factor in the Phillips curve and which we estimated here by assuming a stable relationship between expected and past inflation. Of course, the validity of this assumption is questionable, given the 1983 change in the central bank’s operating procedure. The new procedure probably reduced the amount of expected inflation that is captured by past inflation.
As we argue in “Explaining Apparent Changes in the Phillips Curve: The Great Moderation and Monetary Policy,” an increased reliance on inflation targeting will make it appear as if the Phillips curve has changed when in fact it has remained constant. We also show that the decline in output variability that occurred around 1983 (the so-called “great moderation”) would have the same effect.
Drawing inferences from data is always difficult, but our findings suggest that the measured declines in inflation persistence and the slope of the Phillips curve are too small to suggest that the sacrifice ratio has changed. Rather, the timing of the declines suggests that they could be artifacts of other changes, such as increased inflation targeting and the decline in output variability.
Recommended Reading
- “Explaining Apparent Changes in the Phillips Curve: The Great Moderation and Monetary Policy,” by Charles T. Carlstrom and Timothy S. Fuerst. 2008. Federal Reserve Bank of Cleveland, Economic Commentary (February)
This work by Federal Reserve Bank of Cleveland is licensed under Creative Commons Attribution-NonCommercial 4.0 International

