

- Share
Regional Variation in Job Creation and Destruction
As companies and consumers adapt to a changing marketplace, jobs are eliminated and new ones are created. Rates at which this happens vary across states and reflect the flexibility of the labor market. More flexible markets are associated with faster growth.
The views authors express in Economic Commentary are theirs and not necessarily those of the Federal Reserve Bank of Cleveland or the Board of Governors of the Federal Reserve System. The series editor is Tasia Hane. This paper and its data are subject to revision; please visit clevelandfed.org for updates.
As companies and consumers adapt to a changing marketplace, jobs are eliminated and new ones are created. Rates at which this happens vary across states and reflect the flexibility of the labor market. More flexible markets are associated with faster growth.
Real market economies have always been much more turbulent than the static textbook descriptions of the competitive market equilibrium. People are perpetually adapting to new products, production technologies, and competitors. A manifestation of this economic dynamism is that at all times, whether in booms or busts, some jobs—and even whole firms—are being created while others are being lost. As a result, workers are reallocated from declining firms or sectors to other parts of the economy. Because of the human and economic costs of the resulting dislocation, community leaders frequently try to forestall job losses, even as they try to promote employment growth.
However, economists view worker reallocations as a necessary part of economic growth, as both job creation and job destruction appear to be necessary for a dynamic, growing economy. While everyone understands that entrepreneurs must be able to attract new labor in order to form new firms or expand existing ones, not everyone understands that without the ability to shed less-productive workers or those whose jobs are no longer needed, entrepreneurs will be less willing to hire in the first place.
It is easier for firms to adjust their workforces in flexible labor markets than in less flexible ones, creating or destroying jobs as necessary. Such flexibility is critical to economic growth, and regions with more of it grow more than those without.
In this Economic Commentary, we examine the flexibility of each state’s labor market and find that it varies widely. Higher rates of flexibility are correlated with higher growth rates for both output and employment. Differences in the industrial structure and the size distribution of firms across states account for some of the interstate variation in rates of job creation and destruction, but a sizable portion remains unexplained. Some other likely factors are tax policies, economic regulation, and worker skill levels.
Job Reallocation and Economic Growth
The flexibility of a labor market can be measured as the amount of “excess” reallocation of labor that occurs, that is, the amount of job turnover that goes on above and beyond what would have been required to achieve an observed net change in employment (see box). In figure 1 we show excess reallocation rates for U.S. states from 1989 to 2003. These rates are calculated from data on job creation and destruction—changes due to establishment startups, expansions, contractions, and shutdowns—obtained from the Statistics of U.S. Business (SUSB) from the U.S. Census Bureau and Small Business Administration.
Figure 1: Average Excess Job Reallocation Rates (percent), 1989−2003
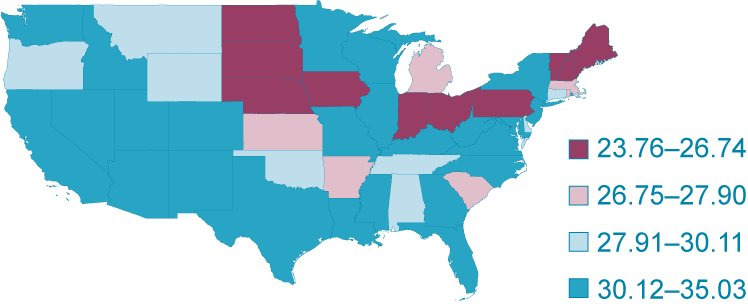
Source: Statistics of U.S. Business (SUSB) for from the U.S. Census Bureau and Small Business Administration.
The variation in excess reallocation rates is driven by differences in both job creation and job destruction. On average, states with higher creation rates also have higher destruction rates, leading to higher rates of excess reallocation. The statistical correlation between job creation and destruction rates across states is relatively high (0.536).
There is also a definite regional pattern: Rates of both job creation and job destruction are higher in faster-growing states in the South and on the West Coast than in slower-growing states in the Midwest. These findings tell us that labor markets are more dynamic in faster-growing states.
The Midwestern states of Wisconsin and Iowa exemplify a less dynamic labor market. Their rates of job creation and destruction were the lowest in the country. In an average year during the 1989–2003 period, about 14 percent of new jobs came from the expansion of existing firms or the creation of new ones. For those two states, about 12 percent of jobs were terminated as firms contracted or shut down, leaving a net gain of only about 2 percent per year over this period.
In sharp contrast, southern and West Coast states tended to have relatively high rates of both job creation and destruction. During this period, Florida, Arizona, and Nevada had the highest job creation rates (about 20 percent). These states also had high rates of job destruction, with about 17 percent of jobs in Florida and Arizona being terminated each year. While creation and destruction rates were much higher in those states than in the Midwest, the extent of the variation in rates was masked by relatively small differences in net employment changes.
Measuring Job Creation, Job Destruction, and Excess Reallocation
Job creation measures employment gains summed over all establishments that expand or start up each year. The job creation rate is calculated as the total number of jobs created by new firms or added at existing firms, divided by the state’s total employment.
Similarly, job destruction measures employment losses summed over all establishments that contract or shut down.
A state’s job destruction rate is calculated as the total number of jobs that were destroyed by either closing or contracting firms, divided by the state’s total employment. The net employment change equals the job creation rate minus the job destruction rate.
The excess reallocation rate is defined as the sum of job creation and job destruction rates, minus the absolute value of the net change in employment. For example, Ohio’s job creation rate was 14.7% in 2003 and its destruction rate was 13.9%. In total, 28.6% of jobs were reallocated, which was 27.8% in “excess” of what would have been necessary to obtain the net employment change of 0.8%.
Why Rates Vary
Some of the variation that exists across states can be explained by two factors—which industries are in each state, and the size or age of firms.
Industry Composition
Firms differ across industries in terms of age, size, growth rates, and capital intensity, all factors known to affect job creation and destruction rates. States and regions specialize in different industries, so industry composition is likely to be a major factor in explaining interstate differences in job creation and destruction. If a state specializes in industries like construction, professional, scientific, and technical services or administrative and support services, where rates of job creation and destruction are about 20 percent, it is also likely to have relatively higher job turnover rates in the aggregate. Alternatively, if a state’s economic activity is concentrated in industries like manufacturing, where job creation and destruction rates are about 10 percent, it is likely to have a relatively lower job turnover rate in the aggregate. Midwestern states are a good example of the latter: manufacturing has a relatively strong presence and rates of excess reallocation are lower (see figure 1).
Some simple calculations show that differences in industry mix do account for some of the variation in job creation and destruction rates across states. We arrive at this conclusion by comparing each state’s actual average job creation and destruction rates with rates they would have had if each of their industries had created or destroyed jobs at the national rate for the industry. (We used two-digit North American Industry Classification System definitions for industries, for example, manufacturing, mining, finance and insurance, educational services, construction, etc.)
By setting the industry-level job creation rates equal to the corresponding national rates, we isolate the effect of industry composition on states’ job creation rates. If industrial structure caused the interstate variation in job creation rates, the hypothetical rates would be close to states’ actual rates and the results of our calculations would look like what actually occurred. The further the hypothetical job creation rates are from the actual rates, the more important other sources of variation in job creation rates across states must be.
Figure 2 reports how each state’s hypothetical and actual job creation rates compare to the national rate. We did the same calculations for job destruction rates and report those results in figure 3. (In both figures, states are sorted by actual rates relative to the national rate.) We find that industry composition accounts only for about 30 percent of the variation across states. The hypothetical rates predict much less variation than is actually observed.
Figure 2: Relative Job Creation Rate, 1989−2003
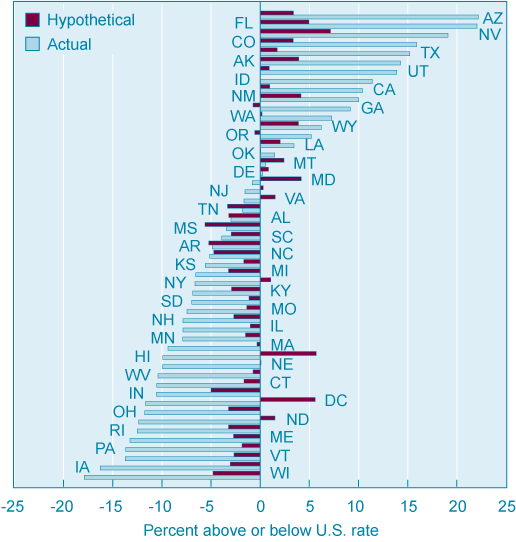
Source: Statistics of U.S. Business (SUSB) for from the U.S. Census Bureau and Small Business Administration.
Figure 3: Relative Job Destruction Rate, 1989−2003
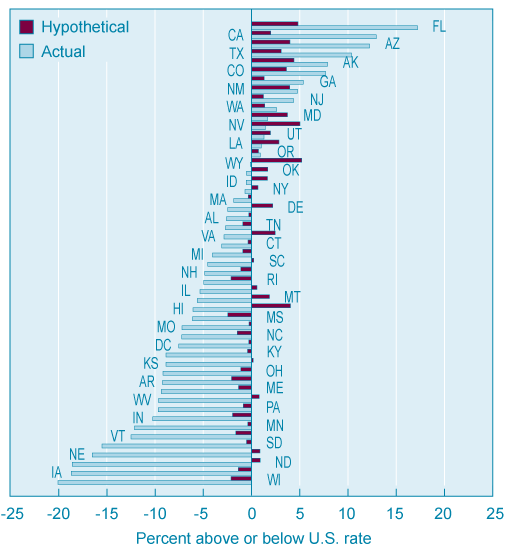
Source: Statistics of U.S. Business (SUSB) for from the U.S. Census Bureau and Small Business Administration.
For example, Arizona’s actual job creation rate was about 22 percent higher than the U.S. rate, but if Arizona’s industries had created jobs at the same rates as the national rate for those industries, its aggregate rate would have been only 3 percent higher than the U.S. rate. At the other extreme, Wisconsin’s job creation rate was about 18 percent lower than the U.S. rate, but had its industries grown at the national rate, the state’s aggregate rate would have been only 5 percent lower.
The results are similar for states’ job destruction rates. Again, the hypothetical calculations predict much less variation than is actually observed. Florida’s actual job destruction rate was about 17 percent higher than the U.S. rate, but its hypothetical value was only about 5 percent higher. Wisconsin’s actual rate was 20 percent below the national average, whereas its hypothetical rate was only 2 percent below. Looking at finer levels of disaggregation, by both industry and geography, other researchers have found similar results.
Size Distribution of Firms
Another source of differences in job creation and destruction rates is the variation in firms’ age and size distribution across states. New firms tend to start small for various reasons. As they produce and become more confident about their costs and prospects, they gradually grow to their optimal size.
This process of size adjustment usually involves job turnover. Researchers who have tested the implications of these models find that a firm’s growth tends to diminish with size. Others find that job creation and destruction rates are higher for smaller and younger establishments.
The age and size distribution of a state’s firms is likely to be affected by their stage of growth. States with expanding economies tend to have younger, and thus smaller, firms because of the higher entry rate driven by population growth; consequently, they are likely to have higher job creation and destruction rates.
Unfortunately, we cannot directly analyze this possible source of rate variation with the data we have because these data don’t track firms’ ages. However, data are available on the size of firms, a related phenomenon. We find that rates of job creation and destruction vary substantially across firms of different sizes. Small firms have the highest job creation rates, but they also have the highest job destruction rates. Employment growth (the difference between the two) is also fastest for smaller firms. The biggest differences between job creation and destruction rates occur in firms of one to four employees, where creation rates are about 18 percent higher, and with firms of five to nine employees, where the difference is down to about 4 percent.
The distribution of firms’ sizes differs significantly across states. For example, over a third of Montana’s employment comes from firms with fewer than 20 workers; the comparable share for Nevada is less than a fifth. In calculations similar to those used above to analyze the effects of industry composition on job creation and destruction rates, we found that differences in firms’ size distribution account for about a quarter of the variation in job creation and destruction across states. (When we did the same analysis for manufacturing to check whether there might be industry-specific size-group effects, the results were similar.)
Other Explanations
A sizeable portion of the differences across states in job creation and destruction remains unexplained. Some studies on international differences in job creation and destruction patterns have looked into the role of labor market policy. Higher firing costs (like those associated with unionization) lead not only to lower destruction rates but also to lower creation rates because these costs make firms hesitant to hire additional employees. Firing costs vary across U.S. states: Unionization rates tend to be higher in midwestern and northeastern states, and southern states tend to have right-to-work laws. However, these and other labor law differences are likely to explain less of the wide variation across states than across countries because the institutional differences across countries tend to be larger.
Other economic policies, such as tax policies and economic regulation, could also play a role. Policies that encourage or inhibit the formation and expansion of successful firms and, equally important, the dissolution and downsizing of unsuccessful ones, will lead to variation in rates.
Finally, differences in job types may account for some of the variation. Some workers, like construction workers, might move from job to job more often than others.
Because differences in job creation and destruction rates are important indicators of labor market flexibility, more research is needed to better understand all of the factors at work in causing these differences.
Recommended Reading
- Job Creation and Destruction, by Steven J. Davis, John C. Haltiwanger, and Scott Schuh. 1996. Cambridge, MA: MIT Press.
- “Gross Job Flows,” by Steven J. Davis and John C. Haltiwanger. 1999. In Handbook of Labor Economics, edited by O. Ashenfelter and D. Card. Amsterdam, Netherlands: Elsevier.
- “The Growth and Failure of U.S. Manufacturing Plants,” by Timothy Dunne, Mark J. Roberts, and Larry Samuelson. 1989. Quarterly Journal of Economics, vol.104, 671–98.
- “Job Flows and Labor Dynamics in the U.S. Rust Belt” by Jason R. Faberman. September 2002. Monthly Labor Review, 3–10.
- “Job Turnover and Policy Evaluation: A General Equilibrium Analysis,” by Hugo Hopenhayn, and Richard Rogerson. 1993. Journal of Political Economy, vol. 101, 915–38.
- “Selection and the Evolution of Industry,” by Boyan Jovanovic. 1982. Econometrica, vol. 50, 649–70.
- “Job Reallocation, Employment Fluctuations and Unemployment,” by Dale Mortensen and Christopher Pissarides. 1999. In Handbook of Macroeconomics, vol. 1B, edited by Taylor and Woodford. Amsterdam, Netherlands: Elsevier.
- “The Evolution of Regional Manufacturing Employment: Gross Job Flows within and between Firms and Industries,” by Scott Schuh, and Robert Triest. 2002. New England Economic Review, Q3, 35–53.
This work by Federal Reserve Bank of Cleveland is licensed under Creative Commons Attribution-NonCommercial 4.0 International

