

- Share
Human Capital and the Challenge of Persistent Poverty in Appalachia
Recent research suggests that investments in education may provide the key to reducing persistent poverty in regions such as Appalachia. A look at some trends in poverty and educational attainment in Appalachia over the past two decades confirms that the two are strongly related.
The views authors express in Economic Commentary are theirs and not necessarily those of the Federal Reserve Bank of Cleveland or the Board of Governors of the Federal Reserve System. The series editor is Tasia Hane. This paper and its data are subject to revision; please visit clevelandfed.org for updates.
Recent research suggests that investments in education may provide the key to reducing persistent poverty in regions such as Appalachia. A look at some trends in poverty and educational attainment in Appalachia over the past two decades confirms that the two are strongly related.
The Appalachian region of the United States is defined by its rich cultural heritage and beautiful scenery, and sadly too, with deeply rooted poverty that has persisted across many generations. Appalachian poverty entered the American consciousness with the classic works of Michael Harrington in The Other America and Harry Caudill in Night Comes to the Cumberlands. Moved by such stories, President Johnson traveled to Inez, Kentucky, in 1964 to announce his “War on Poverty.” Yet today, more than 40 years later, the problem of concentrated poverty persists in many parts of the region.
Recent research suggests that investments in human-capital development may provide the key to reducing persistent poverty in regions such as Appalachia. A look at some trends in poverty and educational attainment in Appalachia over the past two decades confirms that the two are strongly related.
Poverty Trends in Appalachia
Figure 1 compares poverty rates in the United States with those in the Appalachian region as a whole and with the areas of Appalachia that are in the Federal Reserve’s Fourth District (which is served by the Federal Reserve Bank of Cleveland). Appalachia as a whole spans parts of 12 states from New York to Mississippi and all of West Virginia, and the part of the region served by the Federal Reserve Bank includes parts of eastern Kentucky, southeastern Ohio, western Pennsylvania, and the panhandle of West Virginia.
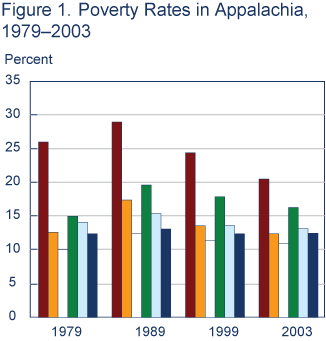
Sources: The estimates for 1979, 1989, and 1999 come from the 1980, 1990, and 2000 Decennial Census, U.S. Census Bureau. The estimates for 2003 come from the Small Area Income and Poverty Estimates program of the U.S. Census Bureau.

Poverty in the United States has been fairly stable over the past two decades, holding steady at 12.4 percent in both 1979 and 1999. The Appalachian region clearly improved relative to the nation during this period, narrowing the gap by 0.5 percentage point. However, there have been swings in poverty within Appalachia over the period, due in part to the coal boom in the 1970s, which drove down poverty, and the coal bust in the 1980s, which drove it back up (see “The Economic Impact of the Coal Boom and Bust” in the Recommended Readings).
Within the Fourth District, Appalachian Kentucky experienced the greatest reductions in poverty between 1979 and 2003, though the level of poverty in Appalachian Kentucky is nearly twice as high as Appalachian Ohio and double that of Appalachian Pennsylvania. The poverty rate in Appalachian Pennsylvania is even lower than the national rate in every year, which, as discussed below, may be linked to the relatively high rates of high school completion in the region.
The poverty rates in figure 1 are determined using the Census Bureau’s official definition, which measures the fraction of the population in a given region whose incomes lie below the poverty line. Using percentages makes it possible to compare poverty across states, regions, and time. However, other aspects the poverty line’s construction need to be kept in mind when drawing conclusions from poverty rates. The poverty line varies by family size and is adjusted each year for changes in the Consumer Price Index. But current living standards are not recalculated, and the standard of living for the poor is assumed to be the same in 2007 (except for inflation) as when the standard was first determined in 1967. The line also does not vary by geographic region, so differences in the cost of living in different areas are not accounted for. The types of income used to calculate the poverty measure includes most forms of private labor income, pensions, and government cash transfers. Capital gains and losses, in-kind transfer payments such as food stamps, and tax payments and credits are excluded. Excluding in-kind transfers and tax credits generally implies that the official definition overstates poverty.
Another measure of economic status is median household income, which is the level of income at which the incomes of one-half of households in an area are lower and one-half are higher. In a typical year, median household income in Appalachian Kentucky lags the nation by $15,000–$20,000 and lags the Appalachian region as a whole by $10,000 (figure 2). This large income gap points to the comparatively high poverty rates in Kentucky in figure 1. Indeed, it is well established that poverty rates are determined in part not only by the level of median income but also by the distribution of income. Research from national data shows that, all else constant, rising median income reduces poverty while rising income inequality exacerbates poverty (see “Poverty and Macroeconomic Performance” in the Recommended Readings).
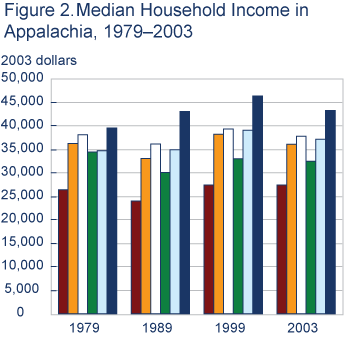
Sources: The estimates for 1979, 1989, and 1999 come from the 1980, 1990, and 2000 Decennial Census, U.S. Census Bureau. The estimates for 2003 come from the Small Area Income and Poverty Estimates program of the U.S. Census Bureau.
This link between poverty and the level and distribution of income is partially mechanical because we use the Census Bureau’s poverty measure, which, as mentioned, is not tied to current living standards. With a fixed poverty line (adjusted for inflation), increasing the income of the typical household will shift the entire income distribution upward, which lowers poverty. This is made transparent by comparing the rank order of the states in figures 1 and 2. The order of states with the lowest to the highest levels of poverty in figure 1 is Pennsylvania, Ohio, West Virginia, and Kentucky, and the rank order of states with the lowest to highest median incomes in figure 2 is just the opposite.
On the other hand, if we hold the level of income fixed and increase the variability of incomes, then a larger share of households falls below the line. This helps explain why poverty rates did not fall as much with increases in median income in the 1980s and 1990s, because the growth in income levels was accompanied by rising inequality.
Poverty and Human Capital
A vast body of economic research demonstrates the positive link between educational attainment and the economic status of individuals as well as regions and countries, and that this link is causal. This implies that people with more education earn substantially more than those with less. In general, countries with higher proportions of better educated citizens, like the United States, Japan, or Great Britain, achieve higher standards of living than countries with lower proportions, like Mozambique, Haiti, or Afghanistan.
Labor economists estimate that the inflation-adjusted rate of return to an additional year of schooling is about 10 percent on average. That is, each additional year of schooling translates into a 10 percent average gain in earnings relative to what the person would have earned had they not made the investment. These returns are generally higher than the long-term return to equity capital in the economy. In other words, for most people, education will be the most lucrative investment they make in their lifetime.
At the same time, this 10 percent average return masks important variation in returns across individuals with different levels of schooling. For example, Nobel laureate James Heckman at the University of Chicago shows that high school graduates with no college earn about 20 percent more than GED recipients, even though the groups have comparable scores on cognitive tests. The key piece to this puzzle, according to Heckman, is the acquisition not just of cognitive skills through formal schooling, but also noncognitive skills such as self control, responsibility, initiative, and charisma, and GED recipients apparently possess fewer noncognitive skills relative to high school graduates. Even more impressive is that those with college degrees realize returns on the order of 20 percent to 30 percent higher than high school graduates.
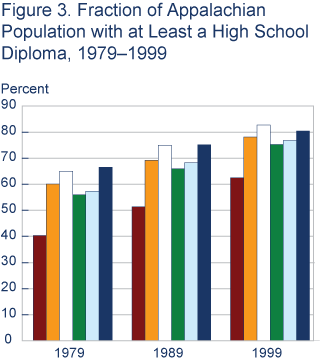
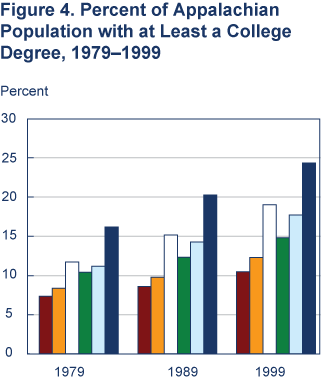
In figure 2 we saw that the median income in Appalachia fell well below that of the nation as a whole, and we saw that it varied significantly within Appalachia. Figures 3 and 4, which show the percentage of the population that has earned high school diplomas and college degrees, respectively, suggest that differences in educational attainment may help explain the wide differences in economic status within Appalachia as well.
Sources: Source: The estimates for 1979, 1989, and 1999 come from the 1980, 1990, and 2000 Decennial Census, U.S. Census Bureau. Census Bureau.
Source: The estimates for 1979, 1989, and 1999 come from the 1980, 1990, and 2000 Decennial Census, U.S. Census Bureau. Census Bureau.
As the gap in poverty rates between Appalachia and the nation was narrowing over the past two decades, the residents of Appalachia were catching up with the rest of the nation in terms of high school completion rates (figure 3). High school graduation rates increased 50 percent in Appalachian Kentucky between 1979 and 1999 (from 40 percent to 62 percent), and recent research indicates that these gains led to Kentucky’s exceptional growth in per capita personal income over the past several decades (see “State Growth Empirics,” in the Recommended Readings).
Figure 4, on the other hand, suggests a yawning gap in college completion rates between Appalachia and the nation overall. This gap may explain why median income levels in Appalachia are depressed relative to the nation. So while the higher rate of high school completion in Appalachian Pennsylvania may partially account for the region’s lower poverty rate relative to the nation, the lower rate of college completion there probably partly explains why the area’s median income is lower than the nation’s.
Although the evidence presented here is purely descriptive, it suggests that sustained differences in levels of human capital translate into sustained differences in income levels, and thus poverty rates. Appalachian Kentucky is a case in point. The region had remarkable growth in high school and college completion rates in the last two decades, but completion levels still fall substantially below the country overall, as well as most other regions in Appalachia, and thus its poverty rates exceed national levels.
This conclusion parallels some recent research by Nobel-prize winning economist Edward Prescott and his fellow economist Stephen Parente. Prescott and Parente attempt to account for income differences across countries. They argue that a country starts to experience sustained increases in incomes when its capacity to effectively use modern technological resources reaches a critical level. To the extent that their framework is applicable to regions within the United States, the implication of recent technological change, which favors a college-educated workforce, is that income disparities will continue both within Appalachia and between Appalachia and the rest of the nation until Appalachian residents close the college-completion gap.
Summary
Given the strong ties between educational attainment and economic status, it seems clear that intensive investments in human capital are needed over the course of individuals’ lives to address persistent poverty in Appalachia and other regions of the nation.
While research described above suggests that human capital development involves the formation of both cognitive and noncognitive skills, other research indicates that the acquisition of noncognitive skills begins at very early ages. Rigorous evaluations of several preschool intervention programs have found that participants are significantly more likely to complete high school, work, have higher earnings, and commit fewer crimes than those in similar socioeconomic situations who do not receive such early education. Cost-benefit analyses of these programs generally point to the benefits outweighing the costs by a factor of 3 or more. Evidence of the links between preschool and noncognitive skill development on the one hand and noncognitive skills and high school completion on the other has led to a growing movement to provide preschool for children, though there is an active debate as to whether it should be universally provided or targeted at economically disadvantaged populations, which presumably would include the residents of Appalachia.
Solving the problem of poverty in Appalachia is complex, but growing evidence suggests that for the region to narrow the gap in poverty relative to the nation, high school and college completion rates must rise. Higher educational attainment translates into a workforce more capable of effectively exploiting modern technologies—technologies that fuel economic growth and development.
Recommended Readings
About Appalachia:
- Dan Black, Terra McKinnish, and Seth Sanders. 2005. “The Economic Impact of the Coal Boom and Bust.” The Economic Journal, 115(April): 449–76.
- “The Mountain Man and the Surgeon.” The Economist, December 20, 2005.
- Michael Harrington. 1962. The Other America. New York: Scribner.
- Harry Caudill. Night Comes to the Cumberlands, New York: Little, Brown.
About the connection between education and economic growth and income:
- Robert J. Barro, and Xavier Sala-i-Martin. 1995. Economic Growth. New York: McGraw-Hill.
- Paul Bauer, Mark Schweitzer, and Scott Shane. 2006. “State Growth Empirics,” Federal Reserve Bank of Cleveland working paper, no. 06-06.
- Rebecca Blank, and David Card. 1993. “Poverty, Income Distribution, and Growth: Are They Still Connected?” Brookings Papers on Economic Activity, 2: 285–389.
- David Card. 1999. “The Causal Effect of Education on Earnings,” in O. Ashenfelter and D. Card, eds. Handbook of Labor Economics, vol, 3A. Amsterdam: North Holland.
- Craig Gundersen, and James P. Ziliak. 2004. “Poverty and Macroeconomic Performance across Space, Race, and Family Structure,” Demography 41(1): 61–86.
- V. Joseph Hotz, Guido Imbens, and Jacob Klerman. 2006. “Evaluating the Differential Effects of Alternative Welfare-to-Work Training Components: A Reanalysis of the California GAIN Program.” Journal of Labor Economics 24(3):521–66.
- Stephen L. Parente, and Edward C. Prescott. “A Unified Theory of the Evolution of International Incomes,” in The Handbook of Economic Growth. P. Aghione and S. Durlauf, eds. Elsevier Press: forthcoming.
On the benefits of educational investment:
- Clive R. Belfield, Milagros Nores, Steve Barnett, and Lawrence Schweinhart. 2006. “The High/Scope Perry Preschool Program: Cost-Benefit Analysis Using Data from the Age-40 Follow-up,” Journal of Human Resources 41(1): 162–90.
- James J. Heckman. 2006. “Catch ‘em Young.” The Wall Street Journal (January 10).
- James J. Heckman, Jora Stixrud, and Sergio Urzua. 2006. “The Effects of Cognitive and Noncognitive Skills on Labor Market Outcomes and Social Behaviors,” Journal of Labor Economics 24(3): 411–82.
- Lynne Karoly. 2002. “Investing in the Future: Reducing Poverty Through Human Capital Investments,” in Understanding Poverty, S. Danziger and R. Haveman, eds. Cambridge, Mass.: Harvard University Press.
James P. Ziliak is a professor at the University of Kentucky, where he holds the Carol Martin Gatton Endowed Chair in Microeconomics and is director of the university’s Center for Poverty Research. He is also a research associate at the Federal Reserve Bank of Cleveland.
The views expressed here are those of the author and not necessarily those of the Federal Reserve Bank of Cleveland, the Board of Governors of the Federal Reserve System, or its staff.
This work by Federal Reserve Bank of Cleveland is licensed under Creative Commons Attribution-NonCommercial 4.0 International

