- Share
Changes in Wages and Occupational Mix of Fourth District Metro Areas Between 2019 and 2022
Occupational mixes and wage distributions in the Fourth District’s metro areas mirror both national trends and departures from them that reflect the District’s unique economic makeup. Changes in occupational mix spurred by the COVID-19 pandemic were similar in District metro areas and the nation.
The views authors express in District Data Briefs are theirs and not necessarily those of the Federal Reserve Bank of Cleveland or the Board of Governors of the Federal Reserve System. The series editor is Harrison Markel.
Background
A challenge of comparing wages across metro areas is that wages reflect the local cost of living, which varies across metro areas. Given the degree of inflation between 2019 and 2022, differences in local inflation rates can have a large impact on wage growth, but metro-area-specific inflation estimates are available for few metro areas. Therefore, in this data brief I focus on nominal wages, meaning wages without any inflation adjustment.
The data in this brief is drawn from the Occupational Employment and Wage Statistics (OEWS) data for 2019 and 2022, which cover wage and salary workers at nonfarm employer establishments. These estimates are based on a large establishment survey which provides a detailed picture of the wages and employment of occupations down to the metro area.1 I have condensed the occupation groups in the OEWS from 22 to 13 by combining groups with small employment levels and similar skill requirements, wages, and (where possible) employment trends (see Appendix for additional details).
This brief covers metro areas that overlap with the Fourth Federal Reserve District and have total employment of at least 100,000. I will refer to these as “the District metro areas,” and divide them by employment levels into large, medium, and small. Cincinnati, Cleveland, Columbus, and Pittsburgh are large; Akron, Dayton, Lexington, and Toledo are mid-sized, and Canton, Erie, Huntington, and Youngstown are small.2 I group them by size because, relative to smaller metro areas, large metro areas tend to have higher wages and more diversified economies, with larger concentrations of financial and professional services.
The average hourly wages and employment levels of these metro areas are listed in Table 1, along with the metro area abbreviations used in the graphs in this brief.
Table 1. Changes in Average Wage and Employment in District Metro Areas and the United States from 2019 to 2022
| 2022 Average Hourly Wage | 2022 Employment | |||||
| Full name | Short name | Abbrev. | Wage ($) | Change from 2019 ($) | Level (1,000s) | Change from 2019 (percent) |
| Akron, OH | Akron | AKR | 27.02 | 3.34 | 313 | -3.5 |
| Canton-Massillon, OH | Canton | CAN | 23.98 | 2.84 | 161 | -3.6 |
| Cincinnati, OH-KY-IN | Cincinnati | CNC | 28.23 | 3.91 | 1,061 | -0.3 |
| Cleveland-Elyria, OH | Cleveland | CLE | 28.62 | 3.76 | 988 | -3.6 |
| Columbus, OH | Columbus | COL | 28.75 | 3.83 | 1,061 | 1.5 |
| Dayton, OH | Dayton | DAY | 27.52 | 3.03 | 363 | -3.0 |
| Erie, PA | Erie | ERI | 23.37 | 2.96 | 117 | -4.5 |
| Huntington-Ashland, WV-KY-OH | Huntington | HUN | 23.32 | 2.66 | 128 | -1.4 |
| Lexington-Fayette, KY | Lexington | LEX | 25.56 | 3.98 | 268 | 0.0 |
| Pittsburgh, PA | Pittsburgh | PGH | 27.90 | 3.33 | 1,058 | -6.3 |
| Toledo, OH | Toledo | TOL | 26.00 | 3.43 | 284 | -4.5 |
| Youngstown-Warren-Boardman, OH-PA | Youngstown | YNG | 22.73 | 2.60 | 200 | -4.5 |
| United States of America | United States | US | 29.76 | 4.19 | 147,900 | 0.7 |
Sources: Bureau of Labor Statistics and author’s calculations
Occupational Mix
The COVID-19 pandemic led to dramatic changes in both the types of goods and services produced and how they were produced. These changes are reflected in the employment of occupation groups (Table 2), with categories related to in-person services, building maintenance, and retail trade shrinking, and transportation and professional occupation groups growing. For example, while overall US employment grew 0.7 percent between 2019 and 2022, the Food Preparation and Serving group and Sales and Related group saw large employment declines (7 percent and 8 percent, respectively). The shift to online shopping contributed to the 8 percent increase in the employment of the Transportation and Material Moving group. The Management, Business, and Financial group grew 17 percent.
Table 2. Changes in US Employment, Employment Share, and Average Hourly Wage of Occupation Groups from 2019 to 2022
| 2022 Employment | 2022 Employment Share | 2022 Average Hourly Wage | ||||
| Occupation group | Level (1,000s) | Change from 2019 (percent) | Percent | Change from 2019 (p.p.) | Wage ($) | Change from 2019 ($) |
| All occupations | 147.9 | 0.7 | 100 | 0 | 29.76 | 4.19 |
| Management, Business, and Financial* | 19.5 | 17.2 | 13.2 | 1.9 | 52.34 | 5.17 |
| Office and Administrative Support | 18.7 | -3.2 | 12.6 | -0.5 | 21.90 | 2.35 |
| Transportation and Material Moving | 13.6 | 8.3 | 9.2 | 0.7 | 21.12 | 2.99 |
| Sales and Related | 13.2 | -8.3 | 8.9 | -0.9 | 24.22 | 3.80 |
| Food Preparation and Serving | 12.5 | -7.1 | 8.5 | -0.7 | 15.45 | 2.64 |
| Construction, Extraction, Installation, Repair, and Farming* | 12.4 | 0.3 | 8.4 | 0.0 | 27.09 | 2.59 |
| Legal, Computer, Math, Engineering, and Science* | 10.0 | 6.1 | 6.8 | 0.3 | 49.80 | 6.02 |
| Healthcare Practitioners and Technical | 9.0 | 3.6 | 6.1 | 0.2 | 46.52 | 5.21 |
| Production | 8.7 | -4.2 | 5.9 | -0.3 | 21.81 | 2.54 |
| Educational Instruction and Library | 8.5 | -4.1 | 5.7 | -0.3 | 30.41 | 2.65 |
| Other Service* | 7.8 | -0.1 | 5.3 | 0.0 | 29.07 | 4.30 |
| Personal Care and Personal, Building, and Grounds Service* | 7.2 | -7.0 | 4.8 | -0.4 | 17.32 | 2.56 |
| Healthcare Support | 6.8 | 2.3 | 4.6 | 0.1 | 17.10 | 2.50 |
*These occupation groups are aggregated to include similar types of work. See the Appendix for more detail.
Sources: Bureau of Labor Statistics and author’s calculations
These national changes are, to a large degree, reflected in the changes in District metro areas (Figure 1). As in the nation, the Management, Business, and Financial group had the largest increase in employment share and the Transportation and Material Moving group had the next largest increase in employment share in most District metro areas. The exceptions are Columbus, Huntington, and Lexington. The employment shares of the Office and Administrative Support and Sales and Related groups declined in all 12 metro areas, and the share of the Food Preparation and Serving group declined in all but one of these metro areas (Huntington).
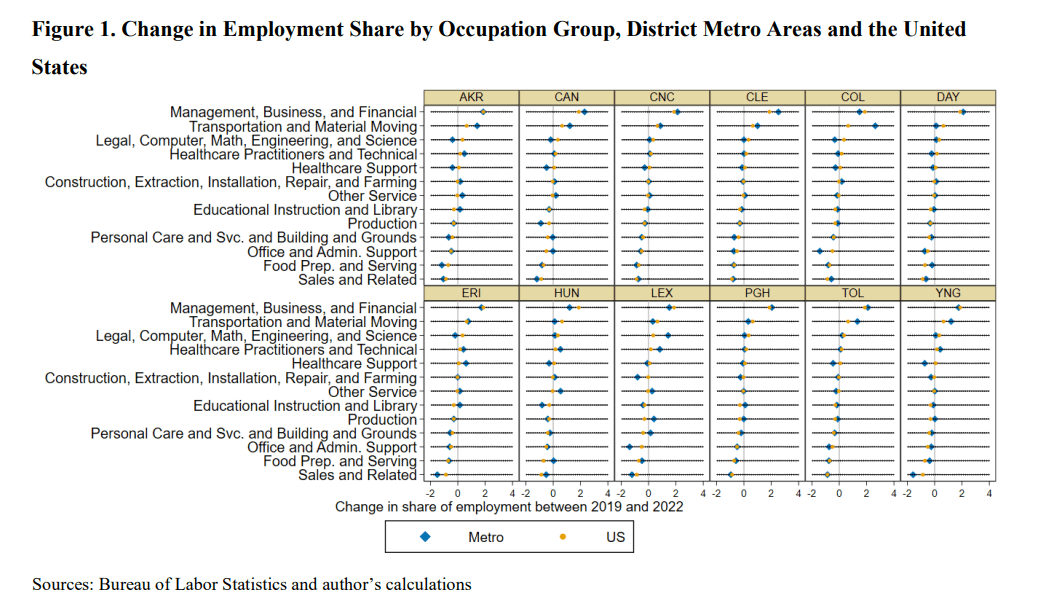
In some cases, the change in a group’s employment share in the metro area differed notably from the group’s change nationwide. For example, in Akron, Columbus, and Toledo the increase in the employment share of the Transportation and Material Moving group was more than double the group’s national increase. While the Healthcare Support group’s employment share rose slightly in the nation, this group’s share declined in all of the District metro areas except Erie.
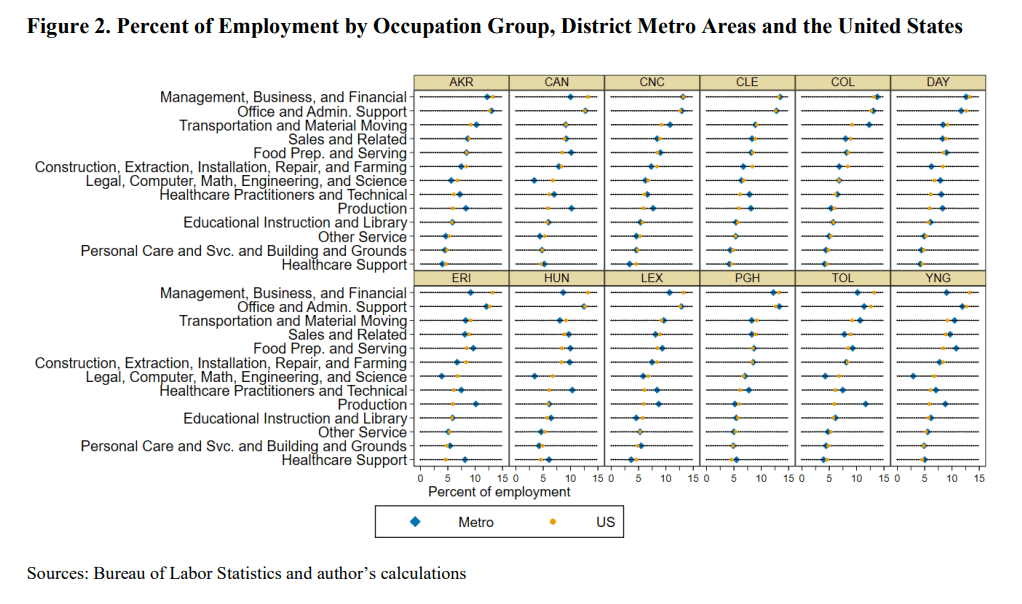
Figure 2 shows each metro area’s occupation mix in 2022, with groups sorted by share of US employment. The differences between the occupation mix of a metro area and the nation sometimes reflect economic specialization. Manufacturing is a specialty of the economies of most of the District metro areas, which leads them to have a higher share of Production occupation group employment than the nation as a whole. Healthcare is another specialty of District metro areas, hence the Healthcare Practitioners and Technical group has a higher employment share in each District metro than in the nation.
A high share of Columbus’s employment is in the Transportation and Material Moving group—12.3 percent—compared to 9.2 percent in the nation.
There are some distinct differences in occupation mix across District metro areas. For example, the Management, Business, and Financial group and the Legal, Computer, Math, Engineering, and Science group are a smaller share of employment in the small District metro areas (Canton, Erie, Huntington, and Youngstown) than in the other District metro areas, or in the nation. In fact, these two white-collar occupation groups are less prevalent in the small District metro areas than in the majority of other metro areas of similar size.3
Wages of Occupation Groups
Now let’s turn our attention to how much particular kinds of work pay.
Nationally, the occupation groups with the highest average hourly wages are Management, Business, and Financial ($52.34); Legal, Computer, Math, Engineering, and Science ($49.80); and Healthcare Practitioners and Technical ($46.52) (Figure 3). These are also the highest wage occupation groups in District metro areas. However, in District metro areas, the average wage of each of these groups is below the national average, with the differences largest in the small metro areas.
Aside from those three high wage occupation groups and the Other Service group, the average wage of an occupation group in the large District metro areas is close to the national average. On the other hand, nearly all occupation groups in the small District metro areas have average wages below the groups’ national average wages. This lag in wages is typical of the nation’s small metro areas. The occupation group wages of the mid-sized District metro areas sit between those of the large and small District metro areas.
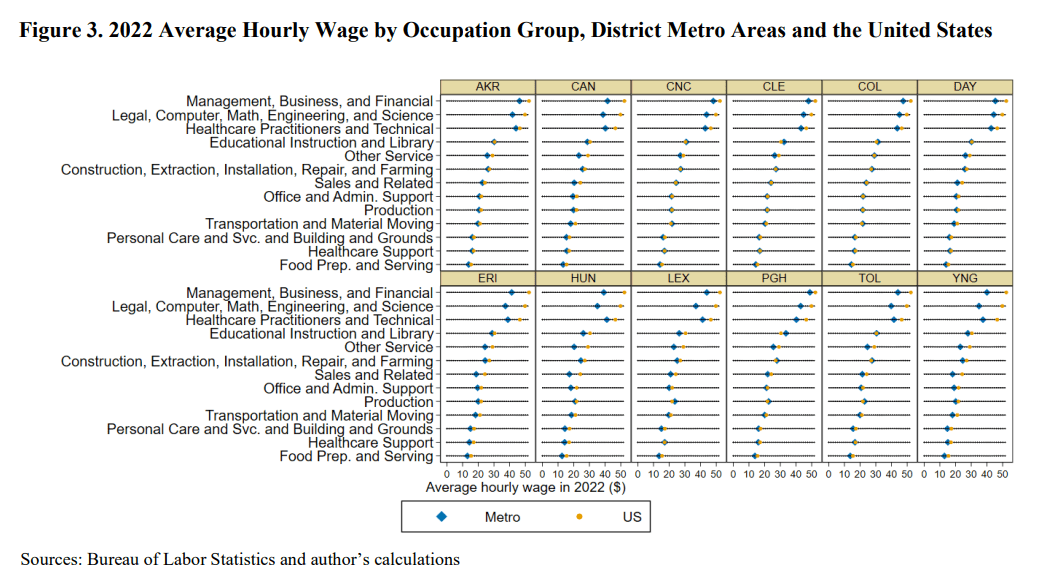
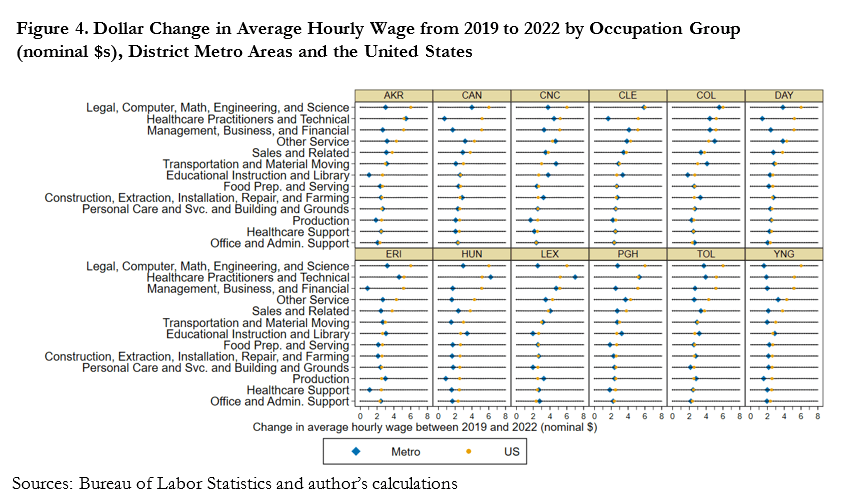
Figure 4 shows the change in occupation groups’ wages between 2019 and 2022. District metro areas had uneven changes in occupation groups’ average wages. One way to summarize these changes is to count how many of the 13 occupation groups had increases in average wages of at least $2.50 per hour—the higher the count, the larger the increases in average wages.4
The number of occupation groups meeting this threshold include:
- 12 in the nation
- 11 in Lexington and Toledo
- 10 in Cincinnati, Cleveland, and Columbus
- 8 in Akron and Pittsburgh
- 7 or fewer in the remaining metro areas.
In metro areas where relatively few occupation groups met the $2.50 increase threshold, high wage occupation groups tended to have smaller increases in average wages than in the nation as a whole. For example, the average wage of the Management, Business, and Financial occupation group rose by $5.17 in the nation, and by less than half of that in 7 of the 12 metro areas.
Wage Distributions
Next, we look at District metro areas’ overall wage distributions, which are the aggregate effects of all the differences in occupation mix and occupation wages discussed above.
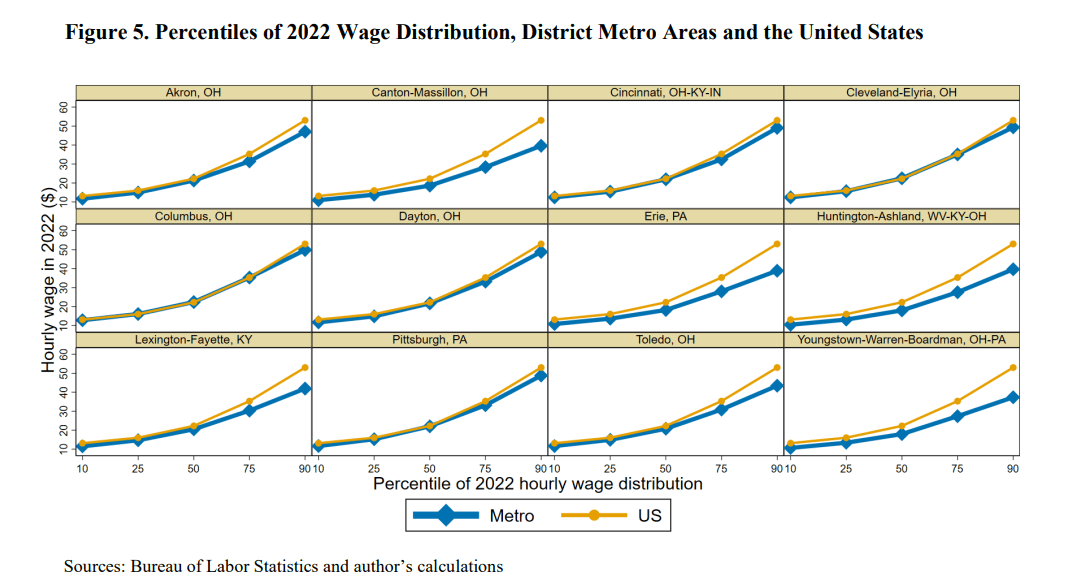
Figure 5 compares the wage distributions and wage levels of the District metro areas to that of the nation at five percentiles (10th, 25th, 50th, 75th, and 90th). A percentile of a wage distribution is the wage that is above the wage of a certain percent of workers. For example, the 25th percentile wage in the nation in 2022 is $16.03, so 25 percent of US workers had a wage below $16.03.
In each District metro area, the difference between the metro area’s hourly wages and the nation’s wage is larger at higher percentiles. For example, the gap between the 75th percentile wages of Lexington and the nation is more than double the gap between their 50th percentile wages ($4.99 vs. $1.76). At each of the five percentiles, Cleveland and Columbus have the highest wages among the District metros. These two metro areas’ wages are no more than 70 cents below the nation’s wages for all the percentiles except the 90th percentile, where the gap is over $3. The small metro areas have notably lower wages than the other District metros. All four small metro areas have 10th percentile wages below $11.00 and 90th percentile wages below $40.00, compared to at least $11.51 and $41.96 for the same percentiles in medium metros and $11.65 and $48.80 in large metros.
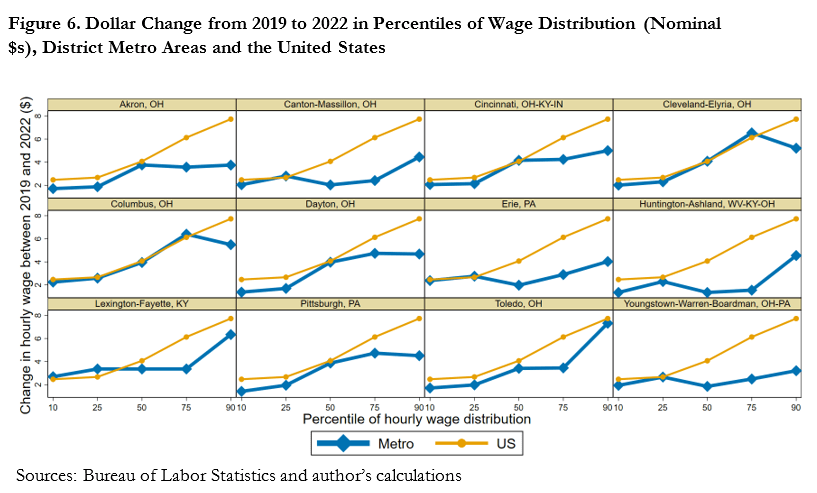
In all but one District metro area, wage inequality grew less between 2019 and 2022 in the metro area than in the nation.5 Figure 6 shows that the amount of wage growth was more equal across percentiles in District metro areas than in the nation. For example, nationally the 25th percentile wage rose by $2.67 and the 90th percentile wage rose by $7.73, while the corresponding increases in Youngstown were $2.66 and $3.21. Huntington, Lexington, and Toledo stand out from the other District metro areas because their 90th percentile wages rose much more than their wages at other percentiles. In fact, Toledo was the one District metro area where wage inequality grew more than it did in the nation between 2019 and 2022.
Summary
This review uncovered patterns around occupational mixes and wage distributions within District metro areas that mirror both national trends and departures from them that reflect the Fourth District’s unique economic makeup.
Overall, changes in occupational mix spurred by the COVID-19 pandemic—such as the reduction in Food Serving and Preparation employment and the increase in Transportation and Material Moving employment—were similar in District metro areas and the nation.
The occupational mixes and wages of District metro areas vary with the total employment in those metros. Large metro areas (Cincinnati, Cleveland, Columbus, and Pittsburgh) have wage distributions and occupational mixes that are similar to the nation as a whole, except that these metro areas have lower average wages for a few high-wage professional categories.
The small metro areas (Canton, Erie, Huntington, and Youngstown) have lower wages than the nation for most occupation groups and a smaller share of their employment is in high-wage professional occupation groups. The mid-sized metro areas (Akron, Dayton, Lexington, and Toledo) fall between the two other size classes, with wages similar to the nation’s in the bottom half of their wage distributions and lower than the nation’s in the top quarter of their wage distributions. The Production, Healthcare Support, and the Healthcare Practitioners and Technical occupation groups are more prevalent in the small and mid-sized District metro areas than in the nation as a whole.
The Production category, in particular, is more prevalent in District metro areas than in the nation as a whole, reflecting the importance of manufacturing in the Fourth District economy.
Footnotes
- In order to have a large sample, the OEWS combines the responses for three years to produce estimates. The OEWS introduced a new methodology with the 2021 data to better capture wages and employment at a specific point in time (Dey, Piccone, and Miller 2019). Both the 2019 data and the 2022 data in this data brief were estimated with the new methodology. The 2019 data is available at https://www.bls.gov/oes/oes-mb3-methods.htm and the 2022 data is available at https://www.bls.gov/oes/tables.htm. In each year, the estimates cover the month of May. Return to 1
- While the city of Huntington, WV is not in the Fourth Federal Reserve District, a large portion of the Huntington-Ashland-Ironton, WV-OH-KY MSA is located in eastern Kentucky and southern Ohio. Return to 2
- For each of these two occupation groups, three of the small District metros have shares in the first quartile of metros with 2022 employment between 100,000 and 200,000 and one of the metros has a share in the second quartile. Return to 3
- $2.50 has no special significance—it just helps convey the differences in hourly wage changes across metros. Return to 4
- This statement is based on a common measure of wage inequality, the 90-10 differential. Return to 5
References
- Dey, Matthew, David S. Piccone Jr, and Stephen M. Miller. 2019. “Model-Based Estimates for the Occupational Employment Statistics Program.” Monthly Labor Review, August. Bureau of Labor Statistics, US Department of Labor. https://doi.org/10.21916/mlr.2019.19.
Appendix
Most of the occupation group definitions used in this data brief are major occupation groups that are defined based on the 2010 Standard Occupation Classification system. However, I combined a number of small major occupation groups with other major occupation groups (Table A1). The choice of which occupation groups to combine is based on similarity of the typical education required of people in the occupation groups and similarity in employment share, wages, and trends in both. The average wage of each of the aggregated groups is the employment-weighted average of the constituent occupation groups’ average wages.
Table A1. Combined Occupation Groups
| Occupation Groups |
| Construction, Extraction, Installation, Repair, and Farming |
|
Construction and Extraction |
|
Farming, Fishing, and Forestry |
|
Installation, Maintenance, and Repair |
| Legal, Computer, Math, Engineering, and Science |
|
Architecture and Engineering |
|
Computer and Mathematical |
|
Legal |
|
Life, Physical, and Social Science |
| Management, Business, and Financial |
|
Management |
|
Business and Financial Operations |
| Other Service |
|
Community and Social Service |
|
Arts, Design, Entertainment, Sports, and Media |
|
Protective Service |
| Personal Care and Personal, Building, and Grounds Service |
|
Personal Care and Service |
|
Building and Grounds Cleaning and Maintenance |
Suggested Citation
Elvery, Joel A. 2024. “Changes in Wages and Occupational Mix of Fourth District Metro Areas Between 2019 and 2022.” Federal Reserve Bank of Cleveland, Cleveland Fed District Data Brief. https://doi.org/10.26509/frbc-ddb-20240305
This work by Federal Reserve Bank of Cleveland is licensed under Creative Commons Attribution-NonCommercial 4.0 International


