

- Share
The Influence of Population Characteristics on the Labor Force Participation Rates of Fourth District States
The labor force participation rates of the Fourth District are lower than the nation’s. Fourth District states’ older populations and higher disability rates are key reasons for lower participation rates relative to the nation.
The views authors express in District Data Briefs are theirs and not necessarily those of the Federal Reserve Bank of Cleveland or the Board of Governors of the Federal Reserve System. The series editor is Harrison Markel.
The labor force participation rates (LFPRs) of the Fourth Federal Reserve District’s four states—Ohio, Pennsylvania, Kentucky, and West Virginia—are lower than the nation’s. In this Data Brief I assess how population characteristics affect these states’ LFPRs. Relative to the nation, Fourth District states’ older populations and higher disability rates are key reasons for lower participation rates.
The LFPR is an estimate of what fraction of people are active in an economy’s workforce.1 The higher the rate, the more of a state’s population that is either working or available for work. This can lead to higher per capita income and output, as well as greater availability of workers.
Based on 2021 data, the most recent available, Ohio’s LFPR was 63.8 percent and Pennsylvania’s was 63.7 percent, while Kentucky came in at 60.1 percent and West Virginia at 53.6 percent. The LFPR for the nation as a whole was 63.9 percent.2 For purposes of comparison, the District of Columbia ranked first, with a LFPR of 71.4 percent, while Ohio ranked 29th, Pennsylvania 30th, Kentucky 44th, and West Virginia last.
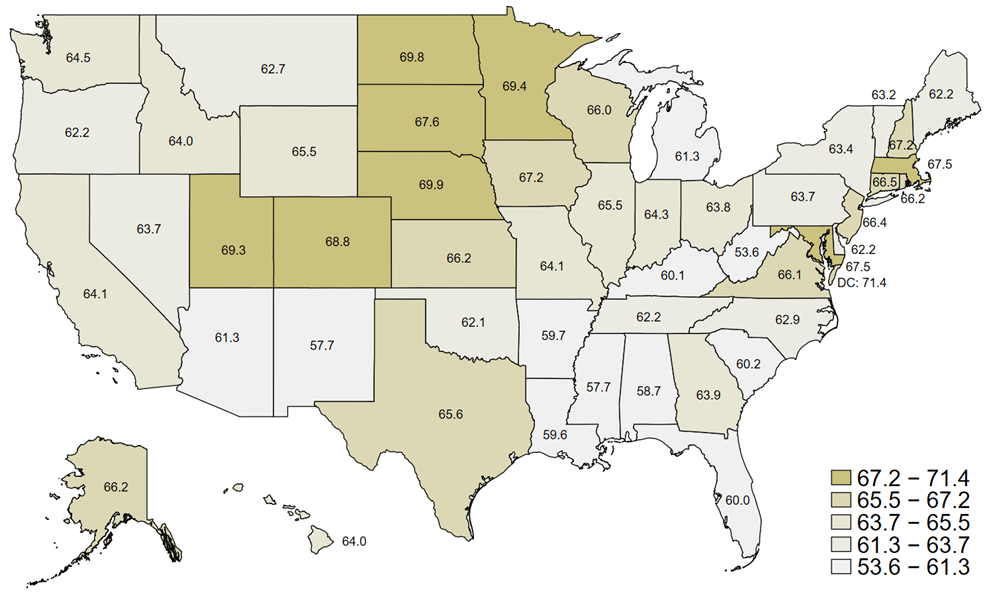
Source: Author’s calculations from IPUMS USA (Ruggles et al. 2023)
Several factors can influence a state’s LFPR. Nunn, Parsons, and Shambaugh (2019) show that the LFPR rises with an area’s economic vitality. One channel for this is the wage level because higher wages give people an incentive to work. Cost of living is also important because people who do not work can improve their standard of living by residing in less expensive places. This leads to higher LFPRs in expensive places than in inexpensive places. Population characteristics also affect the LFPR because an individual’s decision about whether to participate in the labor force depends on their own characteristics. Teasing out the reasons for different states’ LFPRs is complicated because wage levels, cost of living, and population characteristics are intertwined.
The populations of Fourth District states differ from the nation along a number of dimensions that are associated with LFPRs (Table 1). Relative to the nation, the population in these four states is older, has less educational attainment, and, particularly in Kentucky and West Virginia, is more likely to have a disability. These differences are associated with lower LFPRs. LFPRs are lower outside of metropolitan areas, and the share of people who live outside of metropolitan areas is much larger in Kentucky (62 percent) and West Virginia (76 percent) than in the nation as a whole (21 percent).3 On the other hand, relative to the nation, Fourth District states have lower non-white and Hispanic population shares and lower rates of school enrollment, differences that are associated with a higher LFPR.
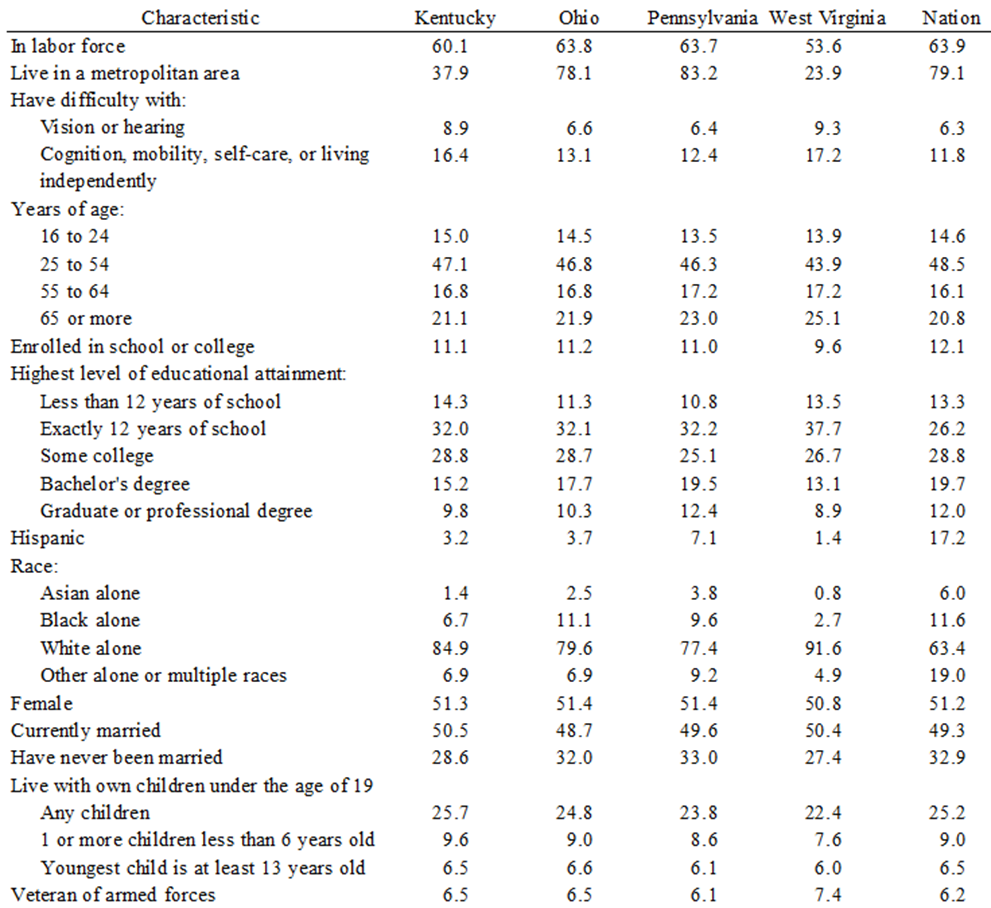
Source: Author’s calculations from IPUMS USA (Ruggles et al. 2023)
Now I turn to quantifying the effects of these population characteristics on the states’ LFPRs, using individual-level data from the 2021 American Community Survey in a two-step calculation.4 The first step estimates, for the nation as a whole, the relationship between individual characteristics and the probability that the individual is in the labor force.5 The second step uses these estimates to calculate the average likely probability of residents being in a state’s labor force. I call this the predicted LFPR, and it is what the state’s LFPR would be if the relationship between individual characteristics and labor force participation is the same in the state as it is in nation. Another way to think about the predicted LFPR is that it is the LFPR the state would have if the only difference between the state and the nation were their population characteristics.
Figure 2 shows the actual and predicted LFPRs for Fourth District states, with the dashed line showing the nation’s LFPR. The difference between a state’s actual LFPR and the national LFPR is a state’s LFPR gap, and the difference between the national LFPR and the state’s predicted LFPR is the explained portion of a state’s LFPR gap. The difference between a state’s actual and predicted LFPRs shows the degree to which factors other than population characteristics are raising or lowering the state’s LFPR.
In Ohio and Pennsylvania, labor force participation is stronger than it appears on the surface. Ohio and Pennsylvania both have small LFPR gaps (0.1 percentage points and 0.2 percentage points, respectively), but these gaps are about 1 percentage point smaller than would be expected given their population characteristics. In both states, factors aside from population characteristics are raising the state’s LFPR by 1.2 percentage points.
The population characteristics of West Virginia and Kentucky explain only part of their LFPR gaps. This means that their LFPRs are even lower than would be expected given their population characteristics. West Virginia has the largest LFPR gap of any state, 10.3 percentage points, and population characteristics explain just over half of this gap. Factors other than population characteristics are depressing West Virginia’s LFPR by 4.8 percentage points. Kentucky’s population characteristics explain nearly two-thirds of its 3.8 percentage point LFPR gap and other factors are depressing its LFPR by 1.3 percentage points.
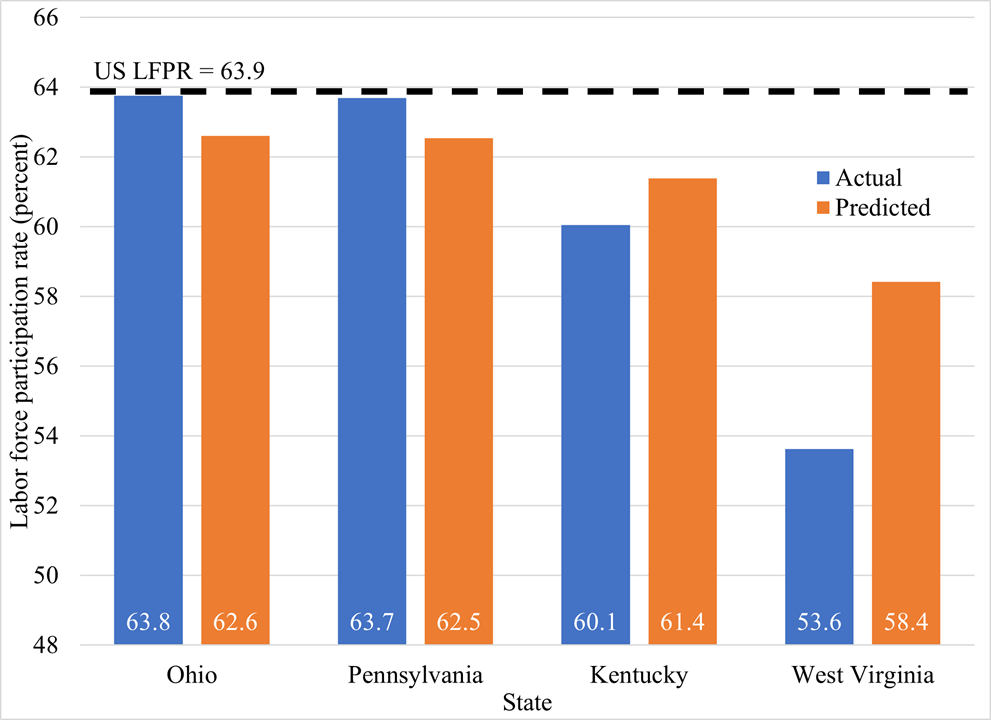
Source: Author’s calculations from IPUMS USA (Ruggles et al. 2023)
Now we “look under the hood” to see which particular population characteristics affect states’ LFPRs. Figure 3 shows the contributions of different sets of characteristics to the explained portion of a state’s LFPR gap. In Ohio, Pennsylvania, and West Virginia, the states’ older populations are the most important factor explaining their LFPR gaps. For example, West Virginia’s age distribution accounts for 2.7 percentage points of the state’s LFPR gap. The most important factor explaining Kentucky’s LFPR gap is the state’s high disability rate, which explains 1.3 percentage points of the state’s LFPR gap. Having a relatively high disability rate is the second most important factor explaining the LFPR gaps of Ohio, Pennsylvania, and West Virginia. Lower educational attainment and a relatively large share of the population living outside metro areas also contribute meaningfully to the low LFPRs of Kentucky and West Virginia. Together, these factors explain 1.3 percentage points of Kentucky’s LFPR gap and 2.0 percentage points of West Virginia’s LFPR gap. The characteristics with negative contributions to the LFPR gap raise the state’s LFPR. Chief among these are the Fourth District states’ rates of attending school or college and racial and ethnic compositions (included in “Other characteristics”).
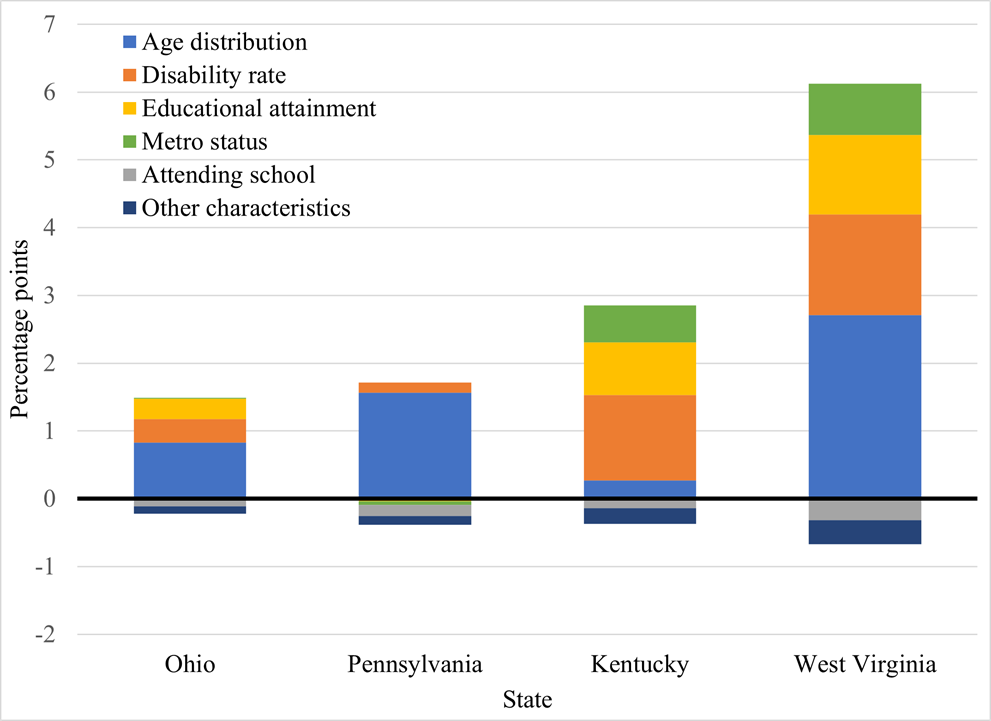
Source: Author’s calculations from IPUMS USA (Ruggles et al. 2023)
Conclusion
Understanding how population characteristics affect the LFPRs of Fourth District states highlights the differences across these states. Relative to the nation, the observable characteristics of the populations of these states depress their LFPRs, especially in Kentucky and West Virginia. The LFPRs of Ohio and Pennsylvania are 1.2 percentage points higher than would be expected based on the characteristics of their populations. Accounting for population characteristics explains more than half of the gap between the LFPRs of Kentucky and West Virginia and that of the nation, leaving unexplained gaps of 1.3 percentage points in Kentucky and 4.8 percentage points in West Virginia. One source of these unexplained differences in LFPRs may be the states’ wage levels: comparing across all states, Kentucky and West Virginia have relatively low wage levels, while Ohio and Pennsylvania have typical wage levels.6 As noted above, lower wage levels reduce the incentive for people to work, thereby lowering the LFPR.
Footnotes
- The precise definition of the LFPR is the percent of the noninstitutionalized civilian population age 16 years and above that is either employed or unemployed. Return to 1
- I use the American Community Survey Public Use Microdata Sample, as distributed by IPUMS USA (Ruggles et al. 2023), for this analysis because it provides large samples within each state. See Elvery, Brizuela, and Gerring (2023) for a discussion of sources for estimates of state-level labor force participation rates. I restrict my sample to noninstitutionalized civilians age 16 years and over. Return to 2
- Throughout this Data Brief, someone is defined as living in a metropolitan area if they live in a Public Use Microdata Area (PUMA) where the majority of the PUMA’s population lives in an identified metropolitan area. Return to 3
- The methodology is from Yun (2004) and is implemented with the “oaxaca” Stata package (Jann 2008). Return to 4
- The explanatory variables in the logit regression used for this step are the ones listed in Table 1, except “In labor force,” which is the dependent variable. The explanatory variables interact with the indicator variable for being female, so all coefficients can differ between men and women. Return to 5
- Ranking all states and the District of Columbia from highest to lowest median hourly wage, Pennsylvania, Ohio, Kentucky, and West Virginia ranked 21st, 27th, 40th, and 48th, respectively. The wage data are from the May 2022 Occupational Employment and Wage Statistics from the Bureau of Labor Statistics. Return to 6
References
- Elvery, Joel A., Isabel Brizuela, and Jayme V. Gerring. 2023. “A Guide to State-Level Estimates of Labor Force Participation Rates.” Cleveland Fed District Data Brief. Federal Reserve Bank of Cleveland. https://doi.org/10.26509/frbc-ddb-20230712.
- Jann, Ben. 2008. “The Blinder–Oaxaca Decomposition for Linear Regression Models.” The Stata Journal 8 (4): 453–79. https://doi.org/10.1177/1536867X0800800401.
- Nunn, Ryan, Jana Parsons, and Jay Shambaugh. 2019. “Labor Force Nonparticipation: Trends, Causes, and Policy Solutions.” Strategy Paper. The Hamilton Project, Brookings Institution. https://www.brookings.edu/wp-content/uploads/2019/10/ES_THP_labor-force-nonparticipation_final.pdf.
- Ruggles, Steven, Sarah Flood, Matthew Sobek, Danika Brockman, Grace Cooper, Stephanie Richards, and Megan Schouweiler. 2023. “IPUMS USA: Version 13.0 [dataset].” Minneapolis, MN: IPUMS. https://doi.org/10.18128/D010.V13.0.
- Yun, Myeong-Su. 2004. “Decomposing Differences in the First Moment.” Economics Letters 82 (2): 275–80. https://doi.org/10.1016/j.econlet.2003.09.008.
Suggested Citation
Elvery, Joel A. 2023. “The Influence of Population Characteristics on the Labor Force Participation Rates of Fourth District States.” Federal Reserve Bank of Cleveland, Cleveland Fed District Data Brief. https://doi.org/10.26509/frbc-ddb-20231115
This work by Federal Reserve Bank of Cleveland is licensed under Creative Commons Attribution-NonCommercial 4.0 International

