

- Share
Were Fourth District Local Governments Ready for a Recession? How the Great Recession Influenced How Much They Save
Did the Great Recession give local governments a better idea of how much savings they needed to weather another economic downturn? To find out, our economists studied financial statements from 25 cities and 25 counties in the Fourth District at two points in time: the most recent statements available and at the close of the 2007, just before the Great Recession.


The views authors express in District Data Briefs are theirs and not necessarily those of the Federal Reserve Bank of Cleveland or the Board of Governors of the Federal Reserve System. The series editor is Harrison Markel.
While almost no one anticipated the pandemic-induced shutdown of economic activity experienced this year, local government officials know that the business cycle will sooner or later pull down tax revenues. During years of expansion, cities and counties should be setting aside resources that will enable them to lessen the cuts necessary to balance their budgets during a recession. How prepared were the local governments of the Cleveland Fed’s Fourth District for the COVID-19 crisis?1 Looking at the most recent data available for a sample of the District’s largest cities and counties, we find that major local governments in the Fourth District were holding fund balances that were similar to or greater than their reserves in 2007, the year the Great Recession began. Some of the cities that had to slash their spending in 2009 and 2010 appear to have learned from that experience and have built up a deeper financial cushion since then. Likewise, some of the cities and counties that have lower balances now are those that had sufficient reserves in 2007 and were not forced to make deep cuts during the Great Recession.
Local governments across the United States operate under balanced-budget requirements. Cities and counties can borrow to build roads, buildings, and other long-lived infrastructure, but they cannot borrow to pay salaries and ongoing operating expenses. These restrictions are not waived during recessions when tax revenues decline. Fortunately, balanced-budget requirements are one-sided, permitting local governments to smooth across years by saving. Some local governments save in formal “rainy day” funds, but much more common is the practice of carrying an unassigned general fund balance from each fiscal year into the next (Wolkoff 1987, Tyer 1993, Marlowe 2005, Wang and Hou 2012). To do this, elected officials have to say “no” to numerous requests for immediate additional spending or tax reductions.
There is a sizable amount of economic literature that considers how much savings subnational governments should maintain (Marlowe 2011, Zhao 2016, Joyce 2001, Stewart, Phillips, and Modlin 2013). Theory suggests savings should be higher in jurisdictions where tax revenues are more volatile, either because the local economy relies on a cyclical industry or because the jurisdiction’s tax revenue relies more heavily on sales and income tax receipts that tend to vary more over business cycles. Property taxes are much more stable because property values generally hold more steady through most downturns and because the multiyear property tax assessment process often delays changes in tax bills until a recovery is underway. More populous cities and counties are more likely to have a diversified tax base, which reduces their revenue volatility and need for savings. The empirical literature finds that levels of savings vary widely and are surprisingly high (Marlowe 2005, Stewart 2009). For example, small local governments often have balances of more than 50 percent of annual expenditures. Researchers have confirmed that maintaining savings is moderately effective at stabilizing expenditures during downturns (Marlowe 2005, Wang and Hou 2012, Stewart, Hamman, and Pink-Harper 2018).
With these research findings in mind, we studied financial statements from 25 cities and 25 counties in the Fourth District to determine how much they maintained in their unallocated general fund balances at two points in time: one in the most recent financial statements available and one late in the last expansion, at the close of the 2007 fiscal year. The sample covers the cities and counties with the highest expenditures reported in the 2017 Census of Governments. Of the 25 cities and 25 counties, 11 cities and 9 counties had financial statements that reported balances as of the end of fiscal year 2019 (FY19). For the remaining 14 cities and 16 counties, we used the balances that were reported in their end of fiscal year 2018 (FY18) financial statements.
In 2007, our sampled local governments had a wide range of unassigned general fund balances, from -11 percent to 92 percent of expenditures.2 These 2007 values are displayed in the blue bars in Figure 1 for cities and counties. A decade later, 45 of the 50 local governments had savings that were still substantial relative to their expenditures. Columbus, Cleveland, Dayton, and Dublin, Ohio, and Erie, Pennsylvania, all increased their unallocated funds as a percent of expenditures by more than 12 percentage points. Franklin County, Ohio, reduced its unallocated funds from 92 percent in 2007 to 56 percent in 2018. Cuyahoga, Summit, and Lake Counties in Ohio had lower unassigned general fund balances, but they remained substantial—in the range of 29 to 35 percent of expenditures. Montgomery, Butler, Warren, and Greene Counties in Ohio and Erie County, Pennsylvania, all increased their savings substantially, carrying balances greater than 50 percent of their annual expenditures in 2018 or 2019.
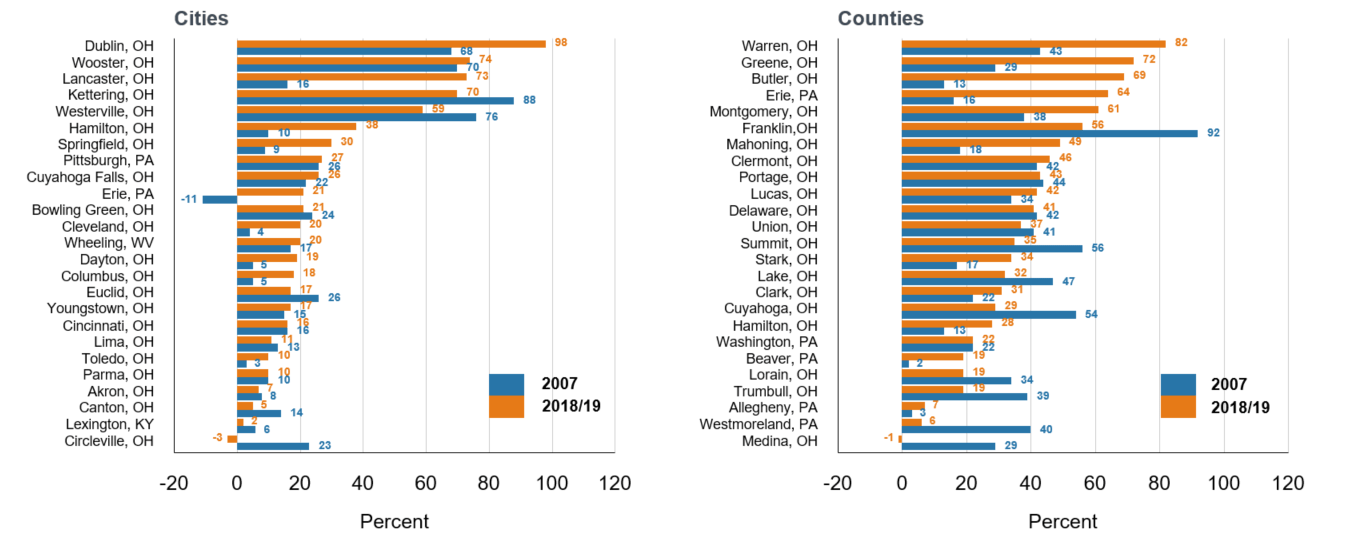
Source: Comprehensive Annual Financial Reports and authors’ calculations. Values from FY18 are presented if the FY19 values are not yet available.
With the observations from our highest-expenditure cities and counties, we can investigate whether some of the relationships suggested in the literature are visible in our data. Figures 2–4 are scatterplots that show unconditional correlations. These give us a simple first look at the relationships. If we included measures such as demographics or residents’ political preferences in a multivariate analysis, those could probably also explain some of the variation we see. We leave that to future work with larger samples.
As previously discussed, cities and counties that collect a higher share of their revenue via property taxes might need lower fund balances. The relationship between unassigned balances and the percentage of tax revenues from property taxes for Fourth District cities and counties is displayed in Figure 2. Most cities receive less than 12 percent of their revenue from property taxes, and many of these have unassigned balances below 30 percent of expenditures. The few cities that have very high savings all receive less than 10 percent of their revenue from property taxes. There are no cities that rely heavily on property taxes and carry a fund balance over 30 percent of expenditures. The Fourth District counties in Figure 2 display a similar pattern with two exceptions: Warren County, Ohio, and Erie County, Pennsylvania.
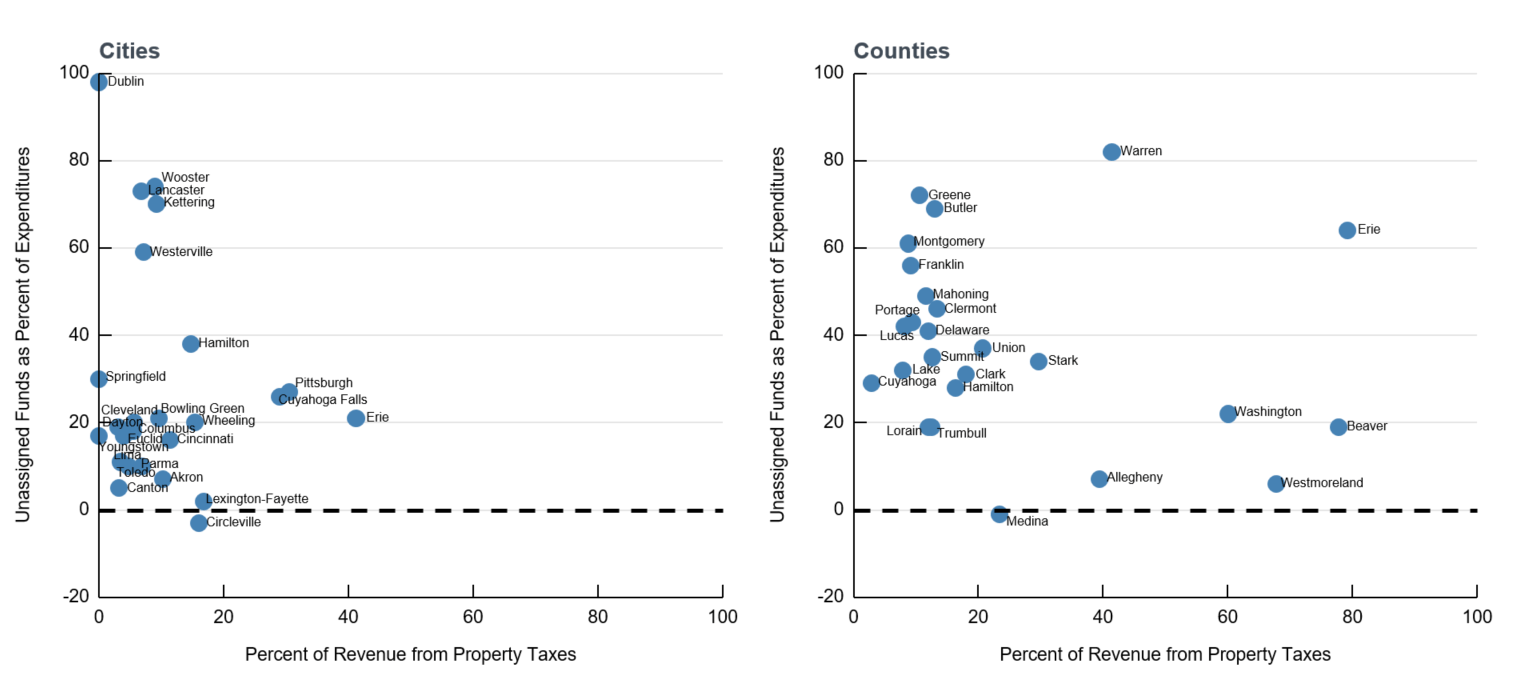
Source: Comprehensive Annual Financial Reports and authors’ calculations.
As previously mentioned, we would expect cities and counties with larger budgets to have a greater diversity of economic activity, less volatile revenues, and less need to hold precautionary savings. As measured by population, the correlation between size and savings is indeed negative. A negative relationship is also visible if size is measured by expenditures rather than population, as in Figure 3. Among cities with expenditures of less than $100 million, 10 of 17 were carrying balances of more than 20 percent of their annual expenditures. Of the cities with expenditures of more than $100 million, only one of the eight carried a balance of more than 20 percent of its expenditures in 2018 or 2019. The sampled counties mostly have expenditures of less than $140 million, and there is a wide distribution of savings levels among them. Of the four counties with $220 million to $760 million in expenditures, three were recently carrying savings below 30 percent of their expenditures. Franklin County, Ohio, had an exceptionally high reserve for a large county, at 56 percent.
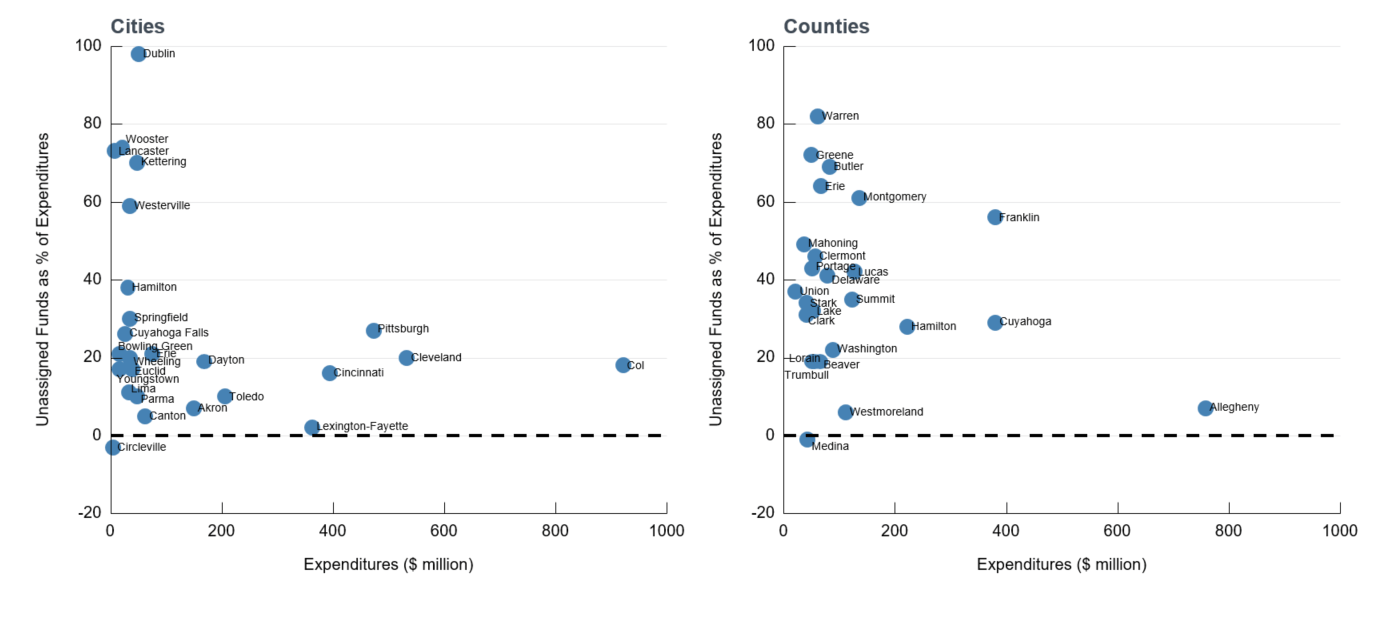
Source: Comprehensive Annual Financial Reports and authors’ calculations.
In Figure 1, we could see that since the Great Recession, some cities and counties have made substantial changes in the levels of their unfunded balances relative to expenditures. It is possible that elected officials or their advisors made adjustments based on their experience during the Great Recession. We might surmise that such lessons were learned if the jurisdictions that had to cut expenditures during the recession are more likely to have increased their subsequent savings, while those that were able to increase services did not increase savings. To gauge how each jurisdiction weathered the Great Recession, we can observe whether they had to cut expenditures between 2007 and 2010, or whether they were able to maintain or grow their services.
Figure 4 shows the relationships between budget changes during the Great Recession and the difference between the unassigned balances carried in 2007 and those carried in 2018 or 2019 for Fourth District’s highest-expenditure cities and counties. Among the 12 cities that had to cut their budgets, 7 were holding more unallocated funds in 2018 or 2019 than they were in 2007. The 13 other cities were able to hold their expenditures constant or have some growth during the recession, suggesting their savings were sufficient or more than sufficient during this difficult period. Seven of the 13 opted to rebuild similar ratios of savings. Lancaster, Dublin, and Columbus, Ohio, and Erie, Pennsylvania, made substantial increases in their savings, while Kettering and Westerville, Ohio, opted to save less. Twelve counties cut their expenditures by 4 percent or more from 2007 to 2010. Eight years later, 8 of those 12 had increased unassigned balances relative to their current expenditures. Thirteen counties avoided major budget cuts during the Great Recession, and 8 of these 13 counties opted to carry the same or a smaller fiscal buffer late in the last expansion.
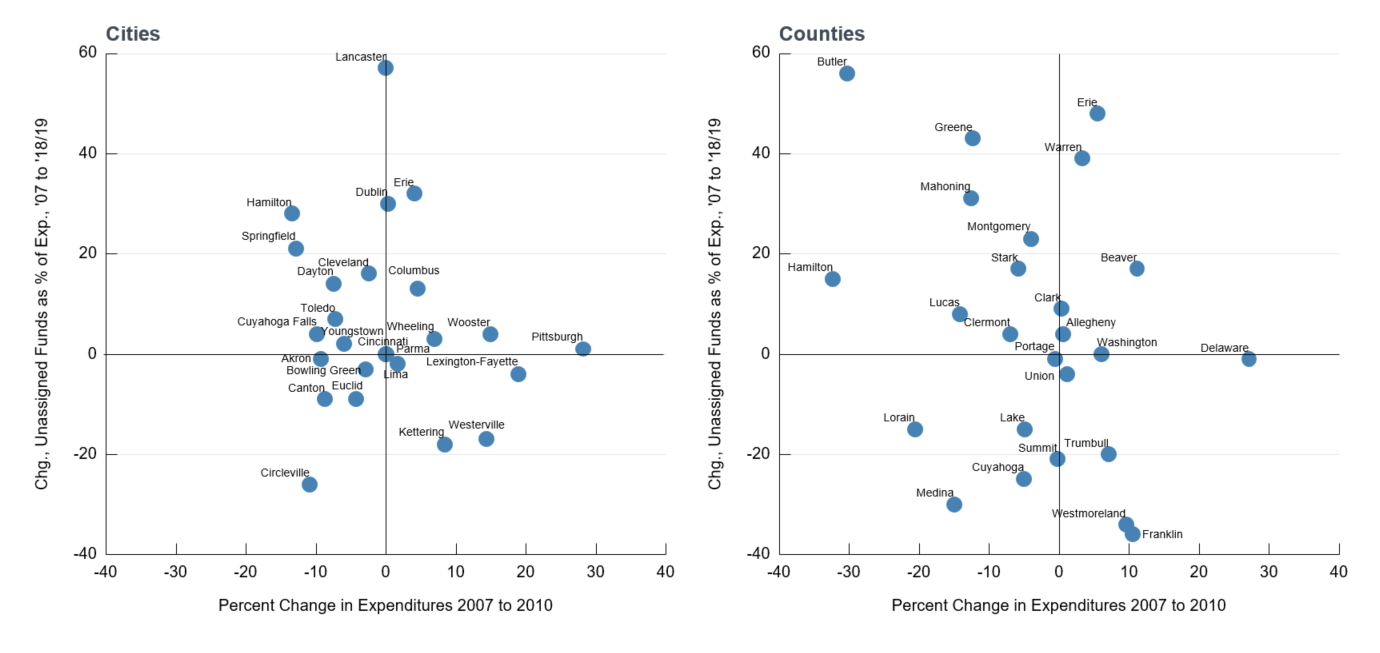
Source: Comprehensive Annual Financial Reports and authors’ calculations.
Conclusion
It appears that most of the major cities and counties of the Fourth District are as prepared to meet the economic downturn of 2020 as they were prepared to go into the Great Recession in 2007. Experiencing the Great Recession gave jurisdictions a better idea of how much savings they needed to weather an economic downturn; some jurisdictions learned that they needed to save more, while others learned they could save less. Hoarding as large a general fund balance as possible is not optimal because doing so has an opportunity cost in the form of foregone public services or tax relief. By 2019, most of the top-expenditure cities and counties in the District had rebuilt their unassigned general fund balances to match or exceed their levels at the peak of the last cycle. Those jurisdictions that did not may have had balances in 2007 higher than necessary even for a recession as severe as the last.
Footnotes
- The Federal Reserve Bank of Cleveland’s Fourth Federal Reserve District comprises Ohio, western Pennsylvania, eastern Kentucky, and the northern panhandle of West Virginia. Return to 1
- In 2007, the city of Erie, Pennsylvania, had a negative unassigned balance in its general fund, but it had larger positive balances in other funds, so its budget was balanced. Return to 2
References
- Arapis, Theodoros. 2013. "Enterprise Fund Transfers and Their Impact on Governmental Spending and Revenue Patterns of Georgia Municipalities." Journal of Public Budgeting, Accounting & Financial Management. 25(3): 446–473. https://doi.org/10.1108/JPBAFM-25-03-2013-B004.
- Arapis, Theodore, and Vincent Reitano. 2018. "A Glimmer of Optimism in Government Savings Accumulation? An Empirical Examination of Municipal Unassigned Fund Balance in Florida." Public Finance Review. 46(3): 389–420. https://doi.org/10.1177/1091142116643386.
- Marlowe, Justin. 2005. "Fiscal Slack and Counter‐Cyclical Expenditure Stabilization: A First Look at the Local Level." Public Budgeting & Finance. 25(3): 48–72.
https://doi.org/10.1111/j.1540-5850.2005.00367.x. - Marlowe, Justin. 2011. "Beyond 5 Percent: Optimal Municipal Slack Resources and Credit Ratings." Public Budgeting & Finance. 31(4): 93–108. https://doi.org/10.1111/j.1540-5850.2011.00994.x.
- Joyce, Philip G. 2001. "What's So Magical about Five Percent? A Nationwide Look at Factors That Influence the Optimal Size of State Rainy Day Funds." Public Budgeting & Finance. 21(2):
62–87. https://doi.org/10.1111/0275-1100.00050. - Stewart, La Shonda M. 2009. "Examining Factors That Impact Mississippi Counties' Unreserved Fund Balance during Relative Resource Abundance and Relative Resource Scarcity." Public Budgeting & Finance. 29(4): 45–73. https://doi.org/10.1111/j.1540-5850.2009.00942.x.
- Stewart, La Shonda M., John A. Hamman, and Stephanie A. Pink‐Harper. 2018. "The Stabilization Effect of Local Government Savings: The Case of Illinois Counties." Public Budgeting & Finance. 38(2): 23–39. https://doi.org/10.1111/pbaf.12185.
- Stewart, La Shonda M., Jeremy N. Phillips, and Steve Modlin. 2013. "An Evaluation of the Connection between Economic Volatility and Governmental Savings Levels for Illinois, North Carolina, and Mississippi Counties." Public Finance & Management. 13(4).
- Tyer, Charlie B. 1993. "Local Government Reserve Funds: Policy Alternatives and Political Strategies." Public Budgeting & Finance. 13(2): 75–84. https://doi.org/10.1111/1540-5850.00976.
- Wang, Wen, and Yilin Hou. 2012. "Do Local Governments Save and Spend across Budget Cycles? Evidence from North Carolina." The American Review of Public Administration. 42(2): 152–169. https://doi.org/10.1177/0275074011398387.
- Wolkoff, Michael. 1987. "An Evaluation of Municipal Rainy Day Funds." Public Budgeting & Finance. 7(2): 52–63. https://doi.org/10.1111/1540-5850.00743.
- Zhao, Bo. 2016. "Saving for a Rainy Day: Estimating the Needed Size of US State Budget Stabilization Funds." Regional Science and Urban Economics. 61: 130–152. https://doi.org/10.1016/j.regsciurbeco.2016.09.002.
Suggested Citation
Whitaker, Stephan D., and Cornelius Johnson. 2020. “Were Fourth District Local Governments Ready for a Recession? How the Great Recession Influenced How Much They Save.” Federal Reserve Bank of Cleveland, Cleveland Fed District Data Brief. https://doi.org/10.26509/frbc-ddb-20201022
This work by Federal Reserve Bank of Cleveland is licensed under Creative Commons Attribution-NonCommercial 4.0 International

