

- Share
Layoffs during the COVID-19 Pandemic: Four Findings from WARN Act Data
With economic conditions changing so rapidly during the COVID-19 pandemic, the standard layoff indicators that policymakers and analysts use are falling short. Worker Adjustment and Retraining Notification (WARN) Act data—a more timely indicator—reveal four findings about job loss during this pandemic.

The views authors express in District Data Briefs are theirs and not necessarily those of the Federal Reserve Bank of Cleveland or the Board of Governors of the Federal Reserve System. The series editor is Harrison Markel.
With economic conditions changing so rapidly during the COVID-19 pandemic, the standard layoff indicators that policymakers and analysts use are falling short. These indicators are either not released frequently enough, or they lack geographic or industry information. Some indicators, such as initial unemployment insurance claims, may be less accurate under the current extreme conditions because of processing delays, duplicate claims, and fraud.2
As detailed in a recent Economic Commentary, we found that anticipated layoff notices filed under the Worker Adjustment and Retraining Notification (WARN) Act provide timely and detailed data during the COVID-19 crisis in Kentucky, Ohio, Pennsylvania, and West Virginia (the Federal Reserve’s Fourth District states). The WARN Act requires employers with 100 or more full-time workers to inform employees with written notices at least 60 days in advance of a potential plant closure or mass layoff. Most states publish their WARN notices on a daily or weekly basis, and the notices contain company names and addresses, so we can tell precisely where the layoffs are occurring and which industries are affected. The Department of Labor allows employers to provide fewer-than-60-days’ notice during unforeseeable business conditions, but it still requires employers to provide notice “as soon as it is practicable.” In our data, employers often state that they are issuing less than 60 days’ notice due to the COVID-19 pandemic. Krolikowski, Lunsford, and Yang (2019) and Krolikowski and Lunsford (2020) contain more details about the WARN Act.
Advance layoff notices filed under the WARN Act suggest four key takeaways about job loss during the COVID-19 pandemic:
1. Many laid-off workers have received little advance notice since March.
We compute the amount of advance notice by taking the difference between the expected layoff date and the date of notification for each WARN notice. Figure 1 depicts how the monthly median advance notice duration changes over time in Kentucky, Ohio, and West Virginia.3 The median advance layoff notice is typically no less than about 60 days, which is the amount of advance notice required by the WARN Act.
However, this advance notice fell to about zero days at the onset of the recent crisis (in March and April 2020) and stayed about zero through June. This decline suggests that firms largely did not expect the current crisis; the typical business was issuing WARN notices on about the same day it started laying off workers. More recently, the median advance notice was about 20 days in July 2020, an amount of time that continues to fall well short of the required 60 days.
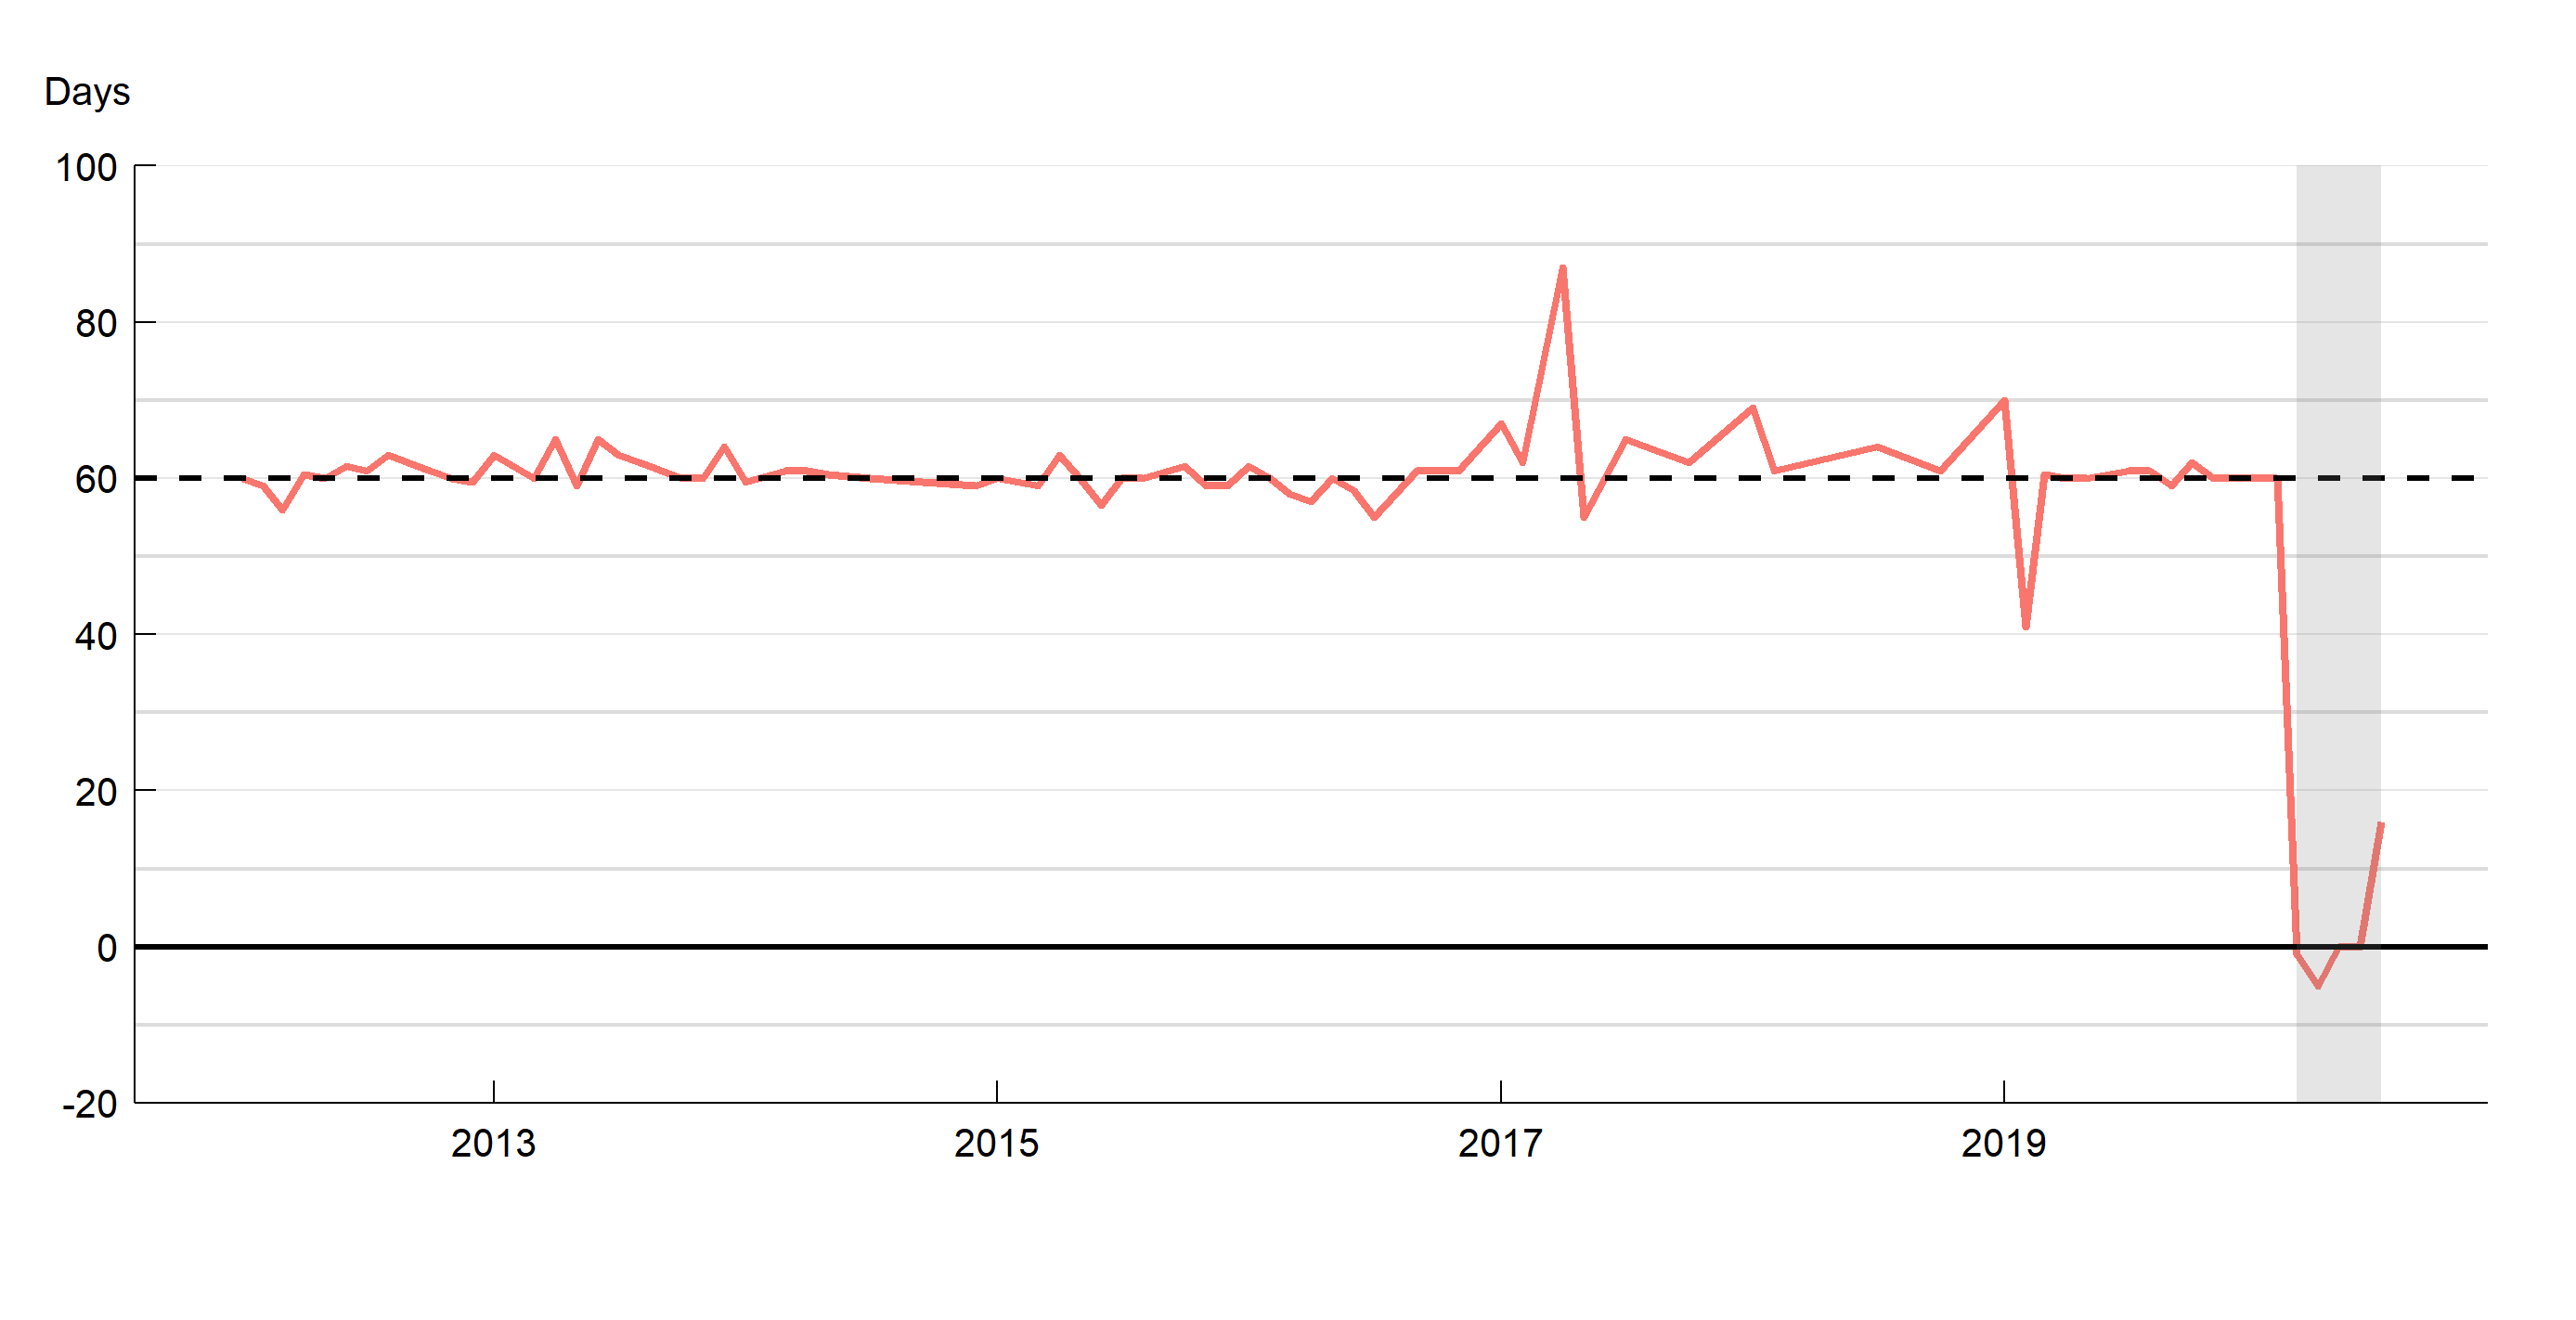
Source: Authors’ calculations with data from states’ labor agencies.
The WARN Act requires at least 60 days’ notice denoted with a horizontal dashed line. When the red line falls below the horizontal solid line at zero, layoffs begin before the notice date. Pennsylvania is excluded because the state does not provide the notice date within the month. The median is calculated if there are least 10 observations per month. The last observation is July 2020.
2. Layoffs rose sharply in March and April, have recently approached prerecession levels, then ticked up in the last week of July.
Figure 2 depicts the six-week moving averages of the number of workers affected by WARN announcements (WARN layoffs) and WARN notices in Kentucky, Ohio, and West Virginia since mid-February 2020. The number of WARN layoffs rose from about 1,000 per week in February to about 7,000 per week in late April. During the same time, the number of WARN notices rose from about 5 per week to about 40 per week. Both series have declined since late April and are close to prerecession levels, although both series ticked up slightly at the end of July.
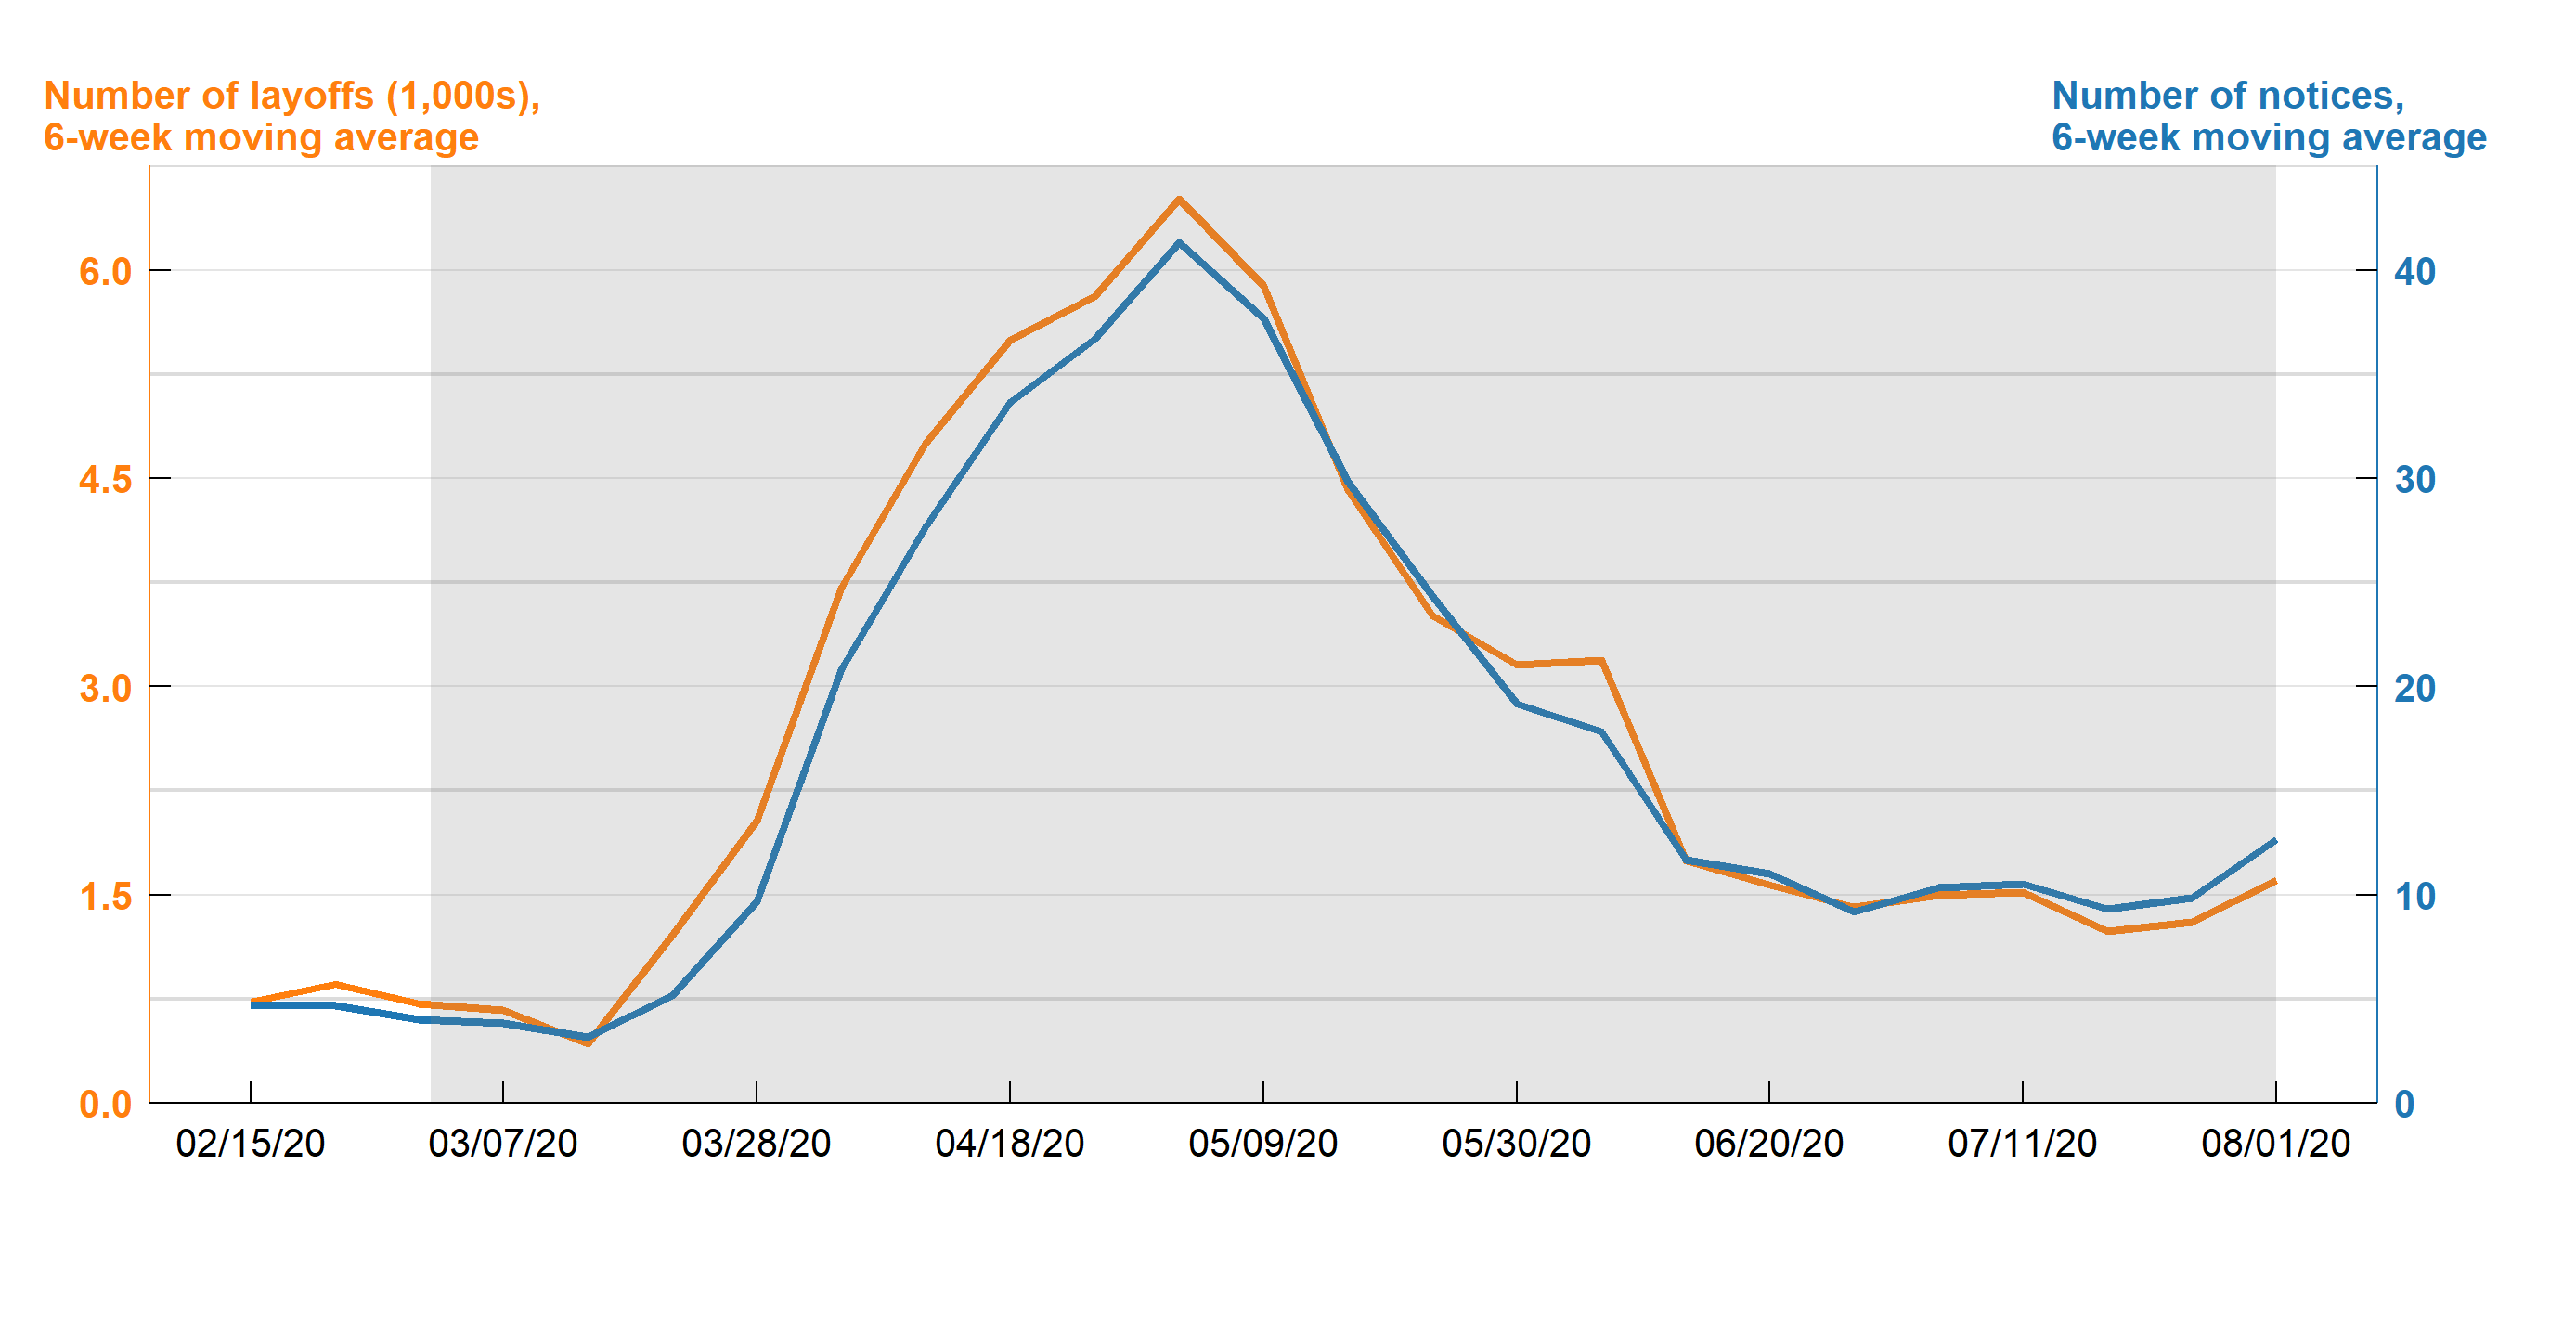
Source: Authors’ calculations with data from states’ labor agencies
Pennsylvania is excluded because the state does not provide the notice date within the month. The gray recession shading is based on the daily indicator from FRED, https://fred.stlouisfed.org/series/USRECD. The last observation is the week ending on August 01, 2020.
3. Although WARN notices have been filed across Fourth District states, layoffs hit some counties particularly hard.
Figure 3 shows the cumulative number of workers affected by WARN notices as a fraction of 2019 annual average, private, county employment, from March through July 2020 across counties in Fourth District states. The number of workers affected by WARN notices has increased in counties throughout the Fourth District, with sharper increases in central Kentucky, throughout Ohio, western and southeastern Pennsylvania, and the West Virginia panhandle. Metcalfe County in Kentucky, Monroe County in Ohio, and Marshall County in West Virginia have been particularly hard hit relative to the size of their workforces. WARN data indicate large layoff announcements by energy companies in Metcalfe, Marshall, and Monroe Counties. For example, on July 20, the American Energy Corporation in Monroe County updated a previous notice and announced that it expected to lay off more than 200 workers on August 10.
Cumulative layoffs between March 2020 and July 2020
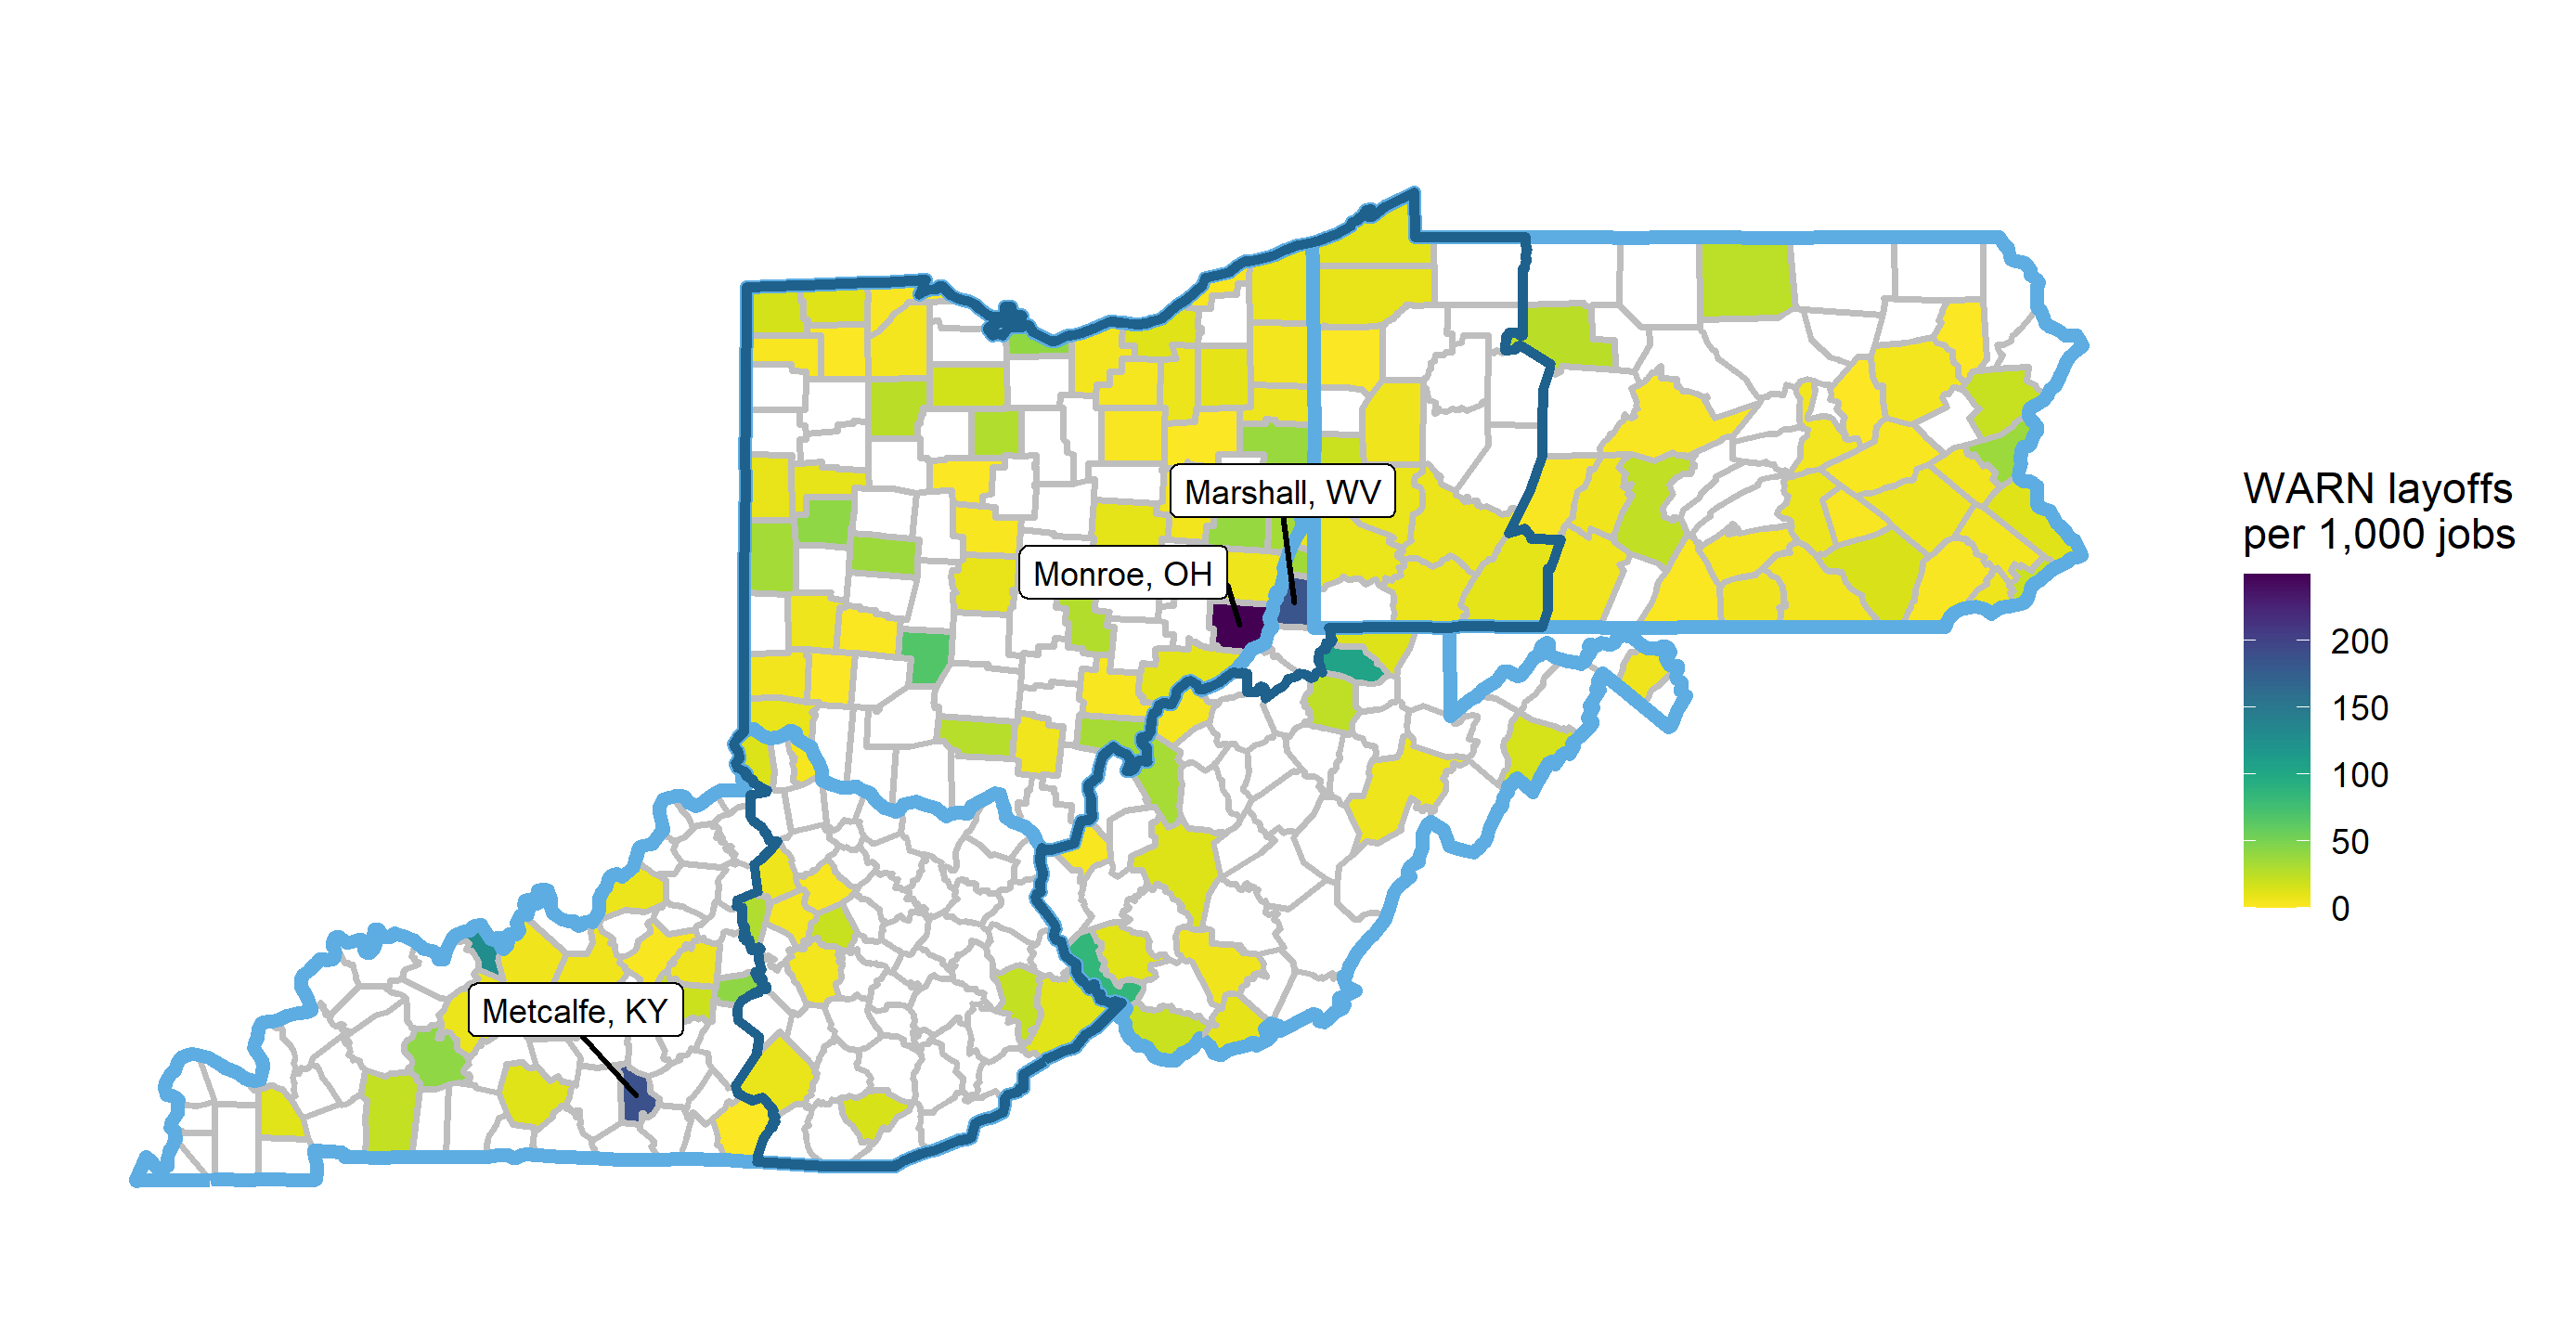
Source: WARN layoffs are from the states’ labor agencies.
2019 annual average county jobs data are from the Bureau of Labor Statistics. State boundaries are outlined in light blue, and the 4D boundary is outlined in dark blue. Some firms reported layoffs across multiple locations which could not be assigned to a single county. Counties in white indicate there were no layoff notices specific to that county.
4. WARN layoffs have affected workers in mining and leisure and hospitality the most, and layoffs in most industries peaked in April.
Figure 4 shows the number of workers affected by WARN notices in each industry as a fraction of that industry's 2019 average private employment and the timing of notices from March through July. Layoff announcements have affected workers in mining, quarrying, and oil and gas extraction the most, consistent with our geographical findings about Marshall and Monroe Counties and with large increases in layoff rates in this sector at the national level.4 Consistent with national data on the rates of layoffs and discharges from the Job Openings and Labor Turnover Survey (JOLTS), layoff announcements have also heavily affected workers in leisure and hospitality, which includes accommodation and food services and arts, entertainment, and recreation.5 In most industries, layoff announcements peaked in April and have declined since then. A quantitative comparison to national layoff rates is complicated because the WARN Act does not apply to establishments with fewer than 100 workers, and average establishment size varies by industry.6
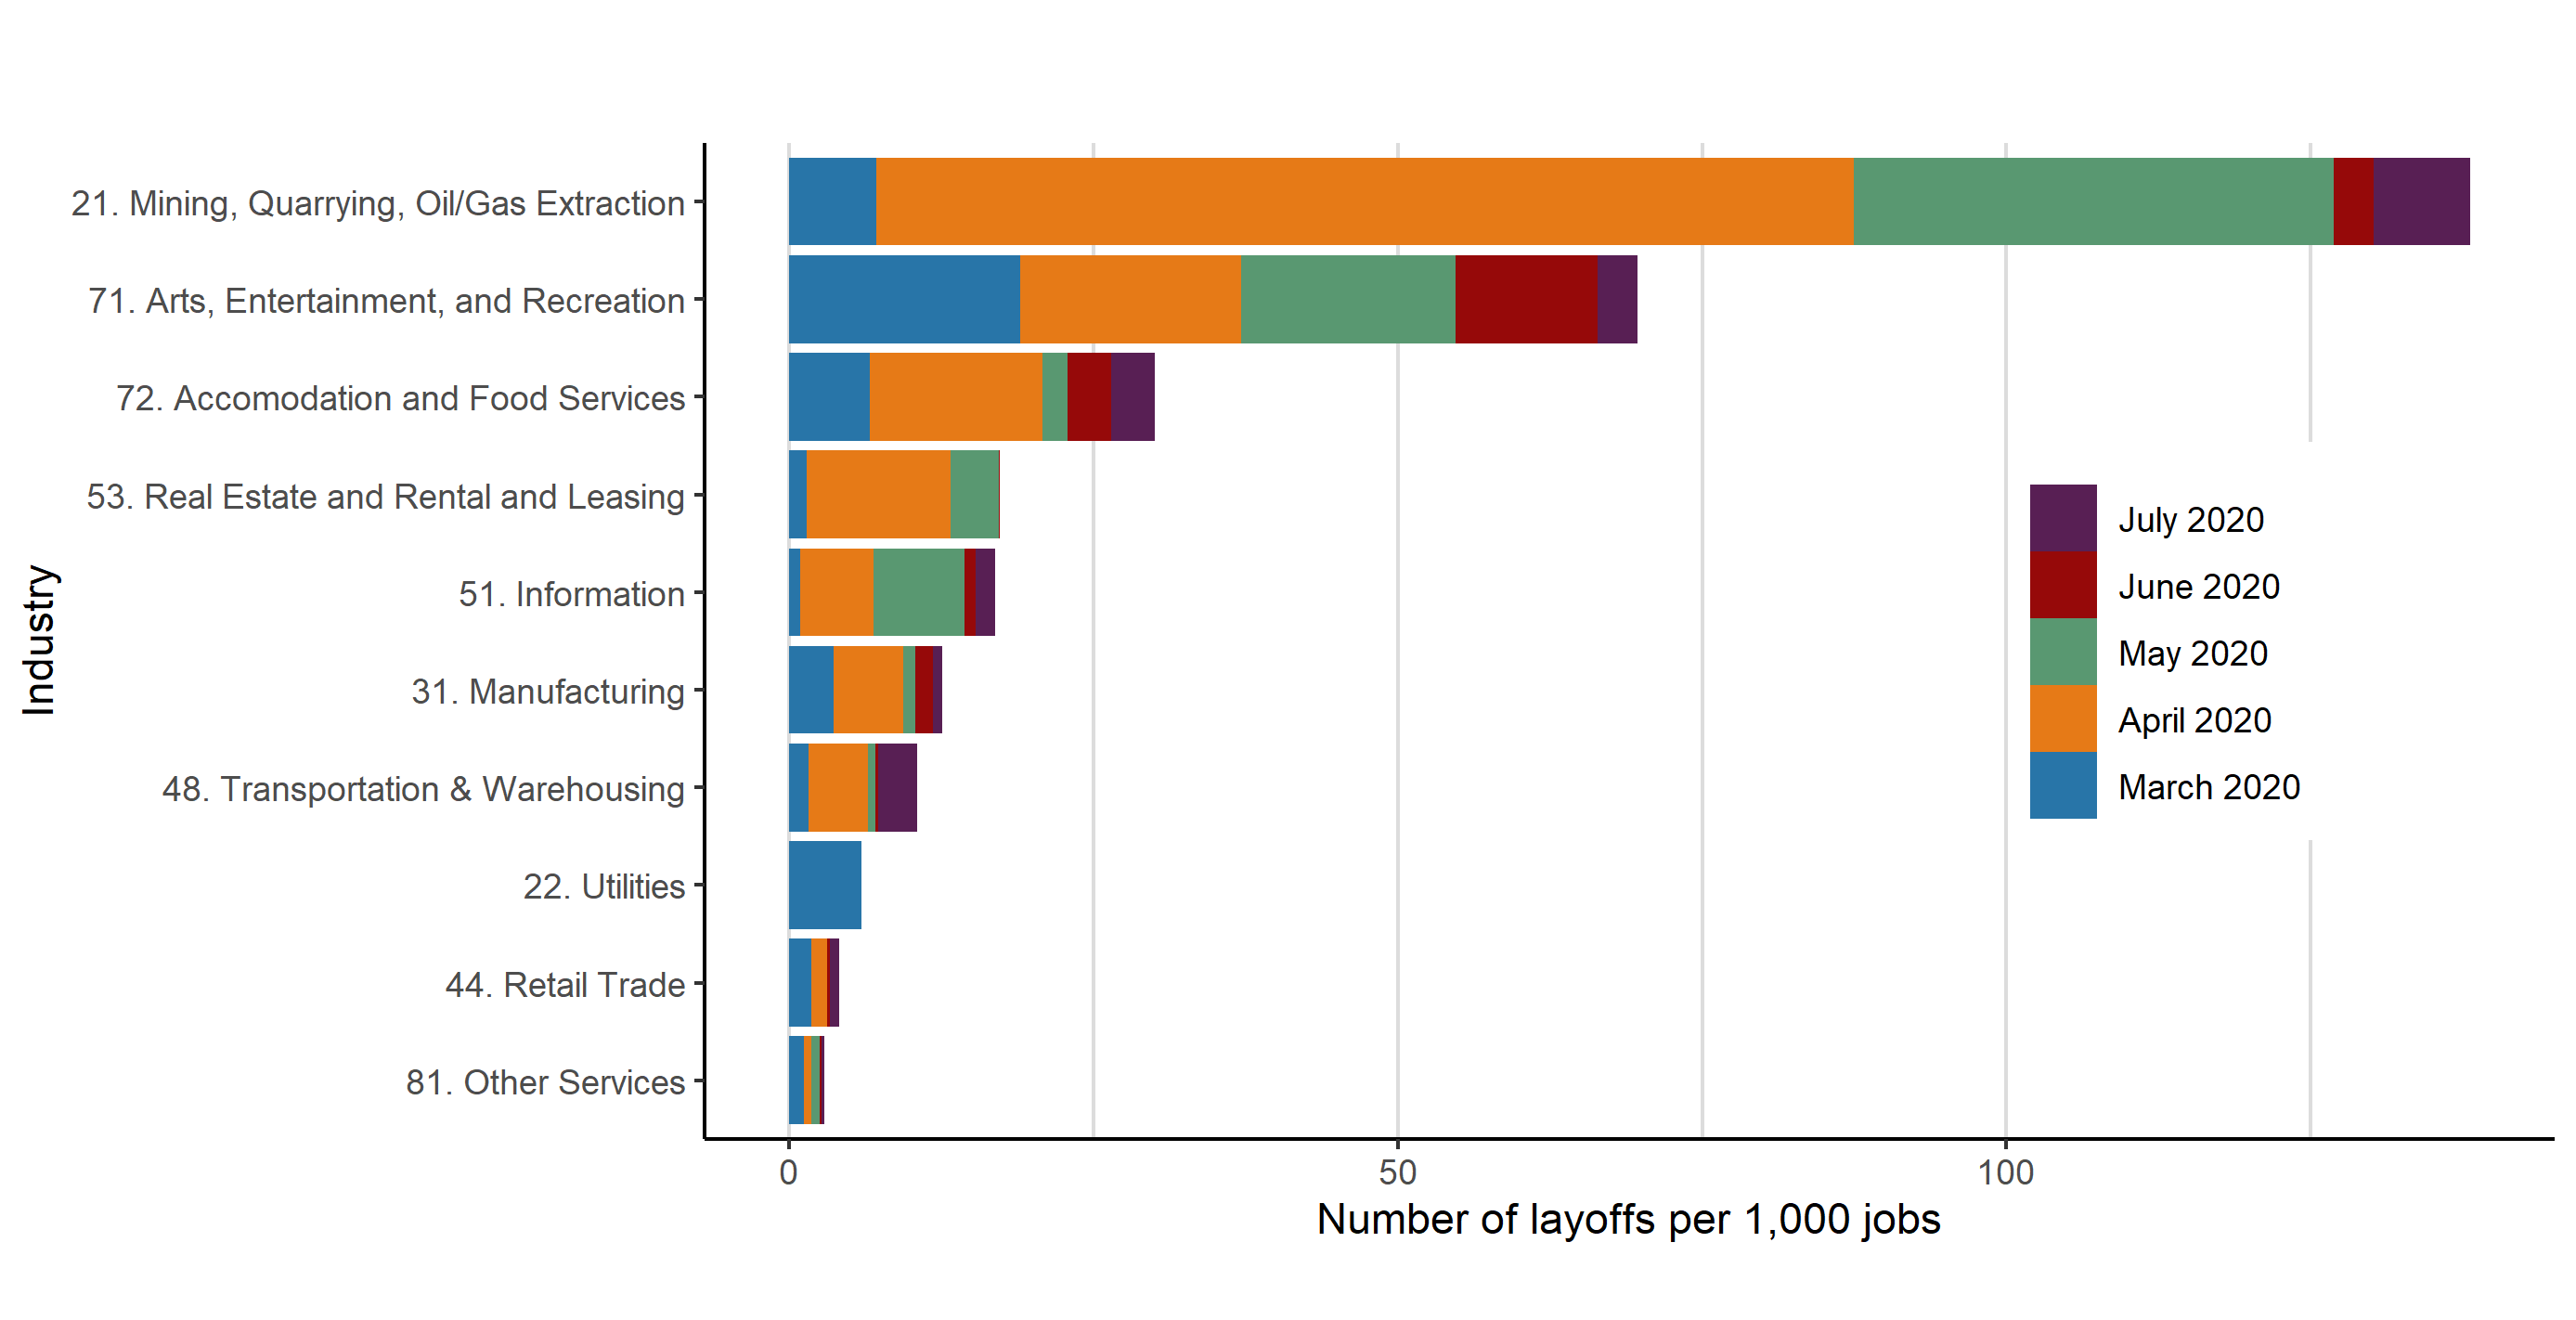
Source: WARN layoffs are from states’ labor agencies.
2019 annual average state jobs data are from the Bureau of Labor Statistics. The 2-digits in the industry label correspond to codes in the North American Industry Classification System. The rate is calculated as layoffs divided by private employment divided by 1,000.
Conclusion
Layoffs were large and unexpected at the onset of the current crisis. Data from notices filed under the WARN Act suggest that workers in mining and leisure and hospitality have been among the most affected by recent layoffs. Since late April, layoffs have approached prerecession levels, but they ticked up at the end of July. Layoffs have hit some counties particularly hard, although notices have been filed across Fourth District states. We will continue to monitor WARN data, as they may be useful to policymakers and labor market analysts as the pandemic unfolds.
Footnotes
- Anna Weixel provided valuable research assistance. Return to 1
- See Bernard (2020) and Romm (2020). In addition, only about 50 percent of laid-off workers file initial UI claims (Vroman 2009). This take-up rate rose during the 2007–2009 recession (Hobijn and Şahin 2011), but the take-up rate during the current crisis is not yet known. Return to 2
- Pennsylvania is excluded in figure 1 and figure 2 because the state does not provide notice dates within the month. Return to 3
- For example, the JOLTS layoffs and discharges rate in mining and logging rose from 0.8 percent in February to 4.5 percent in March and 9.1 percent in April, and fell to 3.4 (2.7) percent in May (June). https://www.bls.gov/news.release/jolts.t05.htm Return to 4
- For example, the JOLTS layoffs and discharges rate in leisure and hospitality rose from 1.9 percent in February to 29.2 percent in March, stayed high at 20.1 percent in April, and fell to 2.7 (2.9) percent in May (June). https://www.bls.gov/news.release/jolts.t05.htm Return to 5
- For example, in 2017, average establishment size in the manufacturing sector was 40. In the arts, entertainment, and recreation sector, it was 17. https://www2.census.gov/programs-surveys/susb/tables/2017/us_6digitnaics_2017.xlsx Return to 6
References
- Bernard, Tara Siegel. 2020. “Fraudulent Jobless Claims Slow Relief to the Truly Desperate.” The New York Times, July. https://www.nytimes.com/2020/07/02/your-money/coronavirus-unemployment-fraud.html.
- Hernández-Murillo, Rubén, and Pawel M. Krolikowski. 2020. “Assessing Layoffs in Four Midwestern States during the Pandemic Recession.” 2020-21. Economic Commentary. Federal Reserve Bank of Cleveland. https://doi.org/10.26509/frbc-ec-202021.
- Hobijn, Bart, and Ayşegül Şahin. 2011. “Do Initial Claims Overstate Layoffs?” Federal Reserve Bank of San Francisco Economic Letter, no. 7. February. https://www.frbsf.org/economic-research/publications/economic-letter/2011/february/claims-layoffs-overstated.
- Krolikowski, Pawel M., and Kurt G. Lunsford. 2020. “Advance Layoff Notices and Labor Market Forecasting.” Federal Reserve Bank of Cleveland, Working Paper No. 20-03, January. https://doi.org/10.26509/frbc-wp-202003.
- Krolikowski, Pawel M., Kurt G. Lunsford, and Meifeng Yang. 2019. “Using Advance Layoff Notices as a Labor Market Indicator.” 2019-21. Economic Commentary. Federal Reserve Bank of Cleveland. https://doi.org/10.26509/frbc-ec-201921.
- Romm, Tony. 2020. “Unemployed Workers Face New Delays and Paused Payments as States Race to Stamp out Massive Nationwide Scam.” The Washington Post, June. https://www.washingtonpost.com/business/2020/06/12/unemployment-benefits-fraud-delays.
- Vroman, Wayne. 2009. “Unemployment Insurance Recipients and Nonrecipients in the CPS.” Monthly Labor Review, October, 44–53. https://www.bls.gov/opub/mlr/2009/10/art4full.pdf.
Suggested Citation
Hernández-Murillo, Rubén, and Pawel M. Krolikowski. 2020. “Layoffs during the COVID-19 Pandemic: Four Findings from WARN Act Data.” Federal Reserve Bank of Cleveland, Cleveland Fed District Data Brief. https://doi.org/10.26509/frbc-ddb-20200827
This work by Federal Reserve Bank of Cleveland is licensed under Creative Commons Attribution-NonCommercial 4.0 International

