

- Share
Subprime Loan Report for Youngstown
This report compares data on the performance of subprime1 home mortgage loans in the Youngstown Ohio metro area, and the states comprising the Fourth Federal Reserve District: Kentucky, Ohio, Pennsylvania, and West Virginia. Like many metropolitan areas in the District, Youngstown has seen delinquency rates for its home mortgage loans rising since 2004.
The views expressed in this report are those of the author(s) and are not necessarily those of the Federal Reserve Bank of Cleveland or the Board of Governors of the Federal Reserve System.
Introduction
This report compares data on the performance of subprime1 home mortgage loans in the Youngstown Ohio metro area, and the states comprising the Fourth Federal Reserve District: Kentucky, Ohio,2 Pennsylvania, and West Virginia. Like many metropolitan areas in the District, Youngstown has seen delinquency rates for its home mortgage loans rising since 2004.
The following seven findings characterize Youngstown's subprime market:
- The percentage of subprime loans that were at least 60 days past due has grown since 2004 in both Ohio and Youngstown.
- Subprime loan originations began to grow in 2001, peaked in 2005, and began falling off rapidly and nearly disappeared by 2008.
- The percentage of subprime loans reported as being used for investment has been lower in Youngstown than in the State of Ohio and the 4th District states since 2004.
- As in other metro areas throughout the District, subprime loans that were originated after 2003 deteriorated at a faster rate compared to previous vintages. Adjustable-rate mortgages (ARMs) have fared considerably worse than their fixed-rate counterparts.
- Unlike in the nation as a whole, the loan deterioration problem in the Youngstown metro area is not a consequence of a reversal of rapid home-price appreciation.
- Delinquency rates in Youngstown have been slightly but consistently higher relative to Ohio and the 4th District states in both the prime and subprime markets.
- Foreclosure filings in Mahoning County, which includes the City of Youngstown, peaked in 2006 but have continued to fall through the first half of 2009.
Subprime Loan Data at the End of December 20083
Although the definition of what constitutes a "subprime" loan varies, analysis of different reports shows that slightly less than 23 percent of total home mortgage loans in the U.S. market were subprime,4 and 28 percent of all subprime loans were at least 60 days past due at the end of 2008.5 Nationally, nearly 40 percent of subprime ARMs were delinquent based on data from the Mortgage Bankers Association.
Map 1.
The Three Counties Comprimising the Youngstown MSA
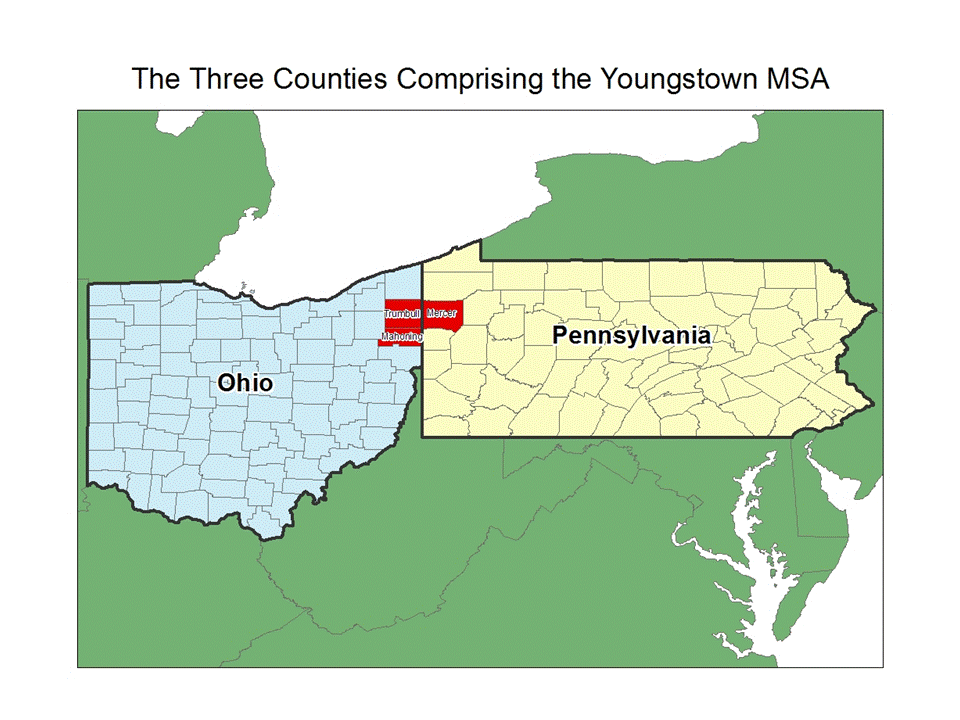
Figure 1.
United States Subprime Loan Data
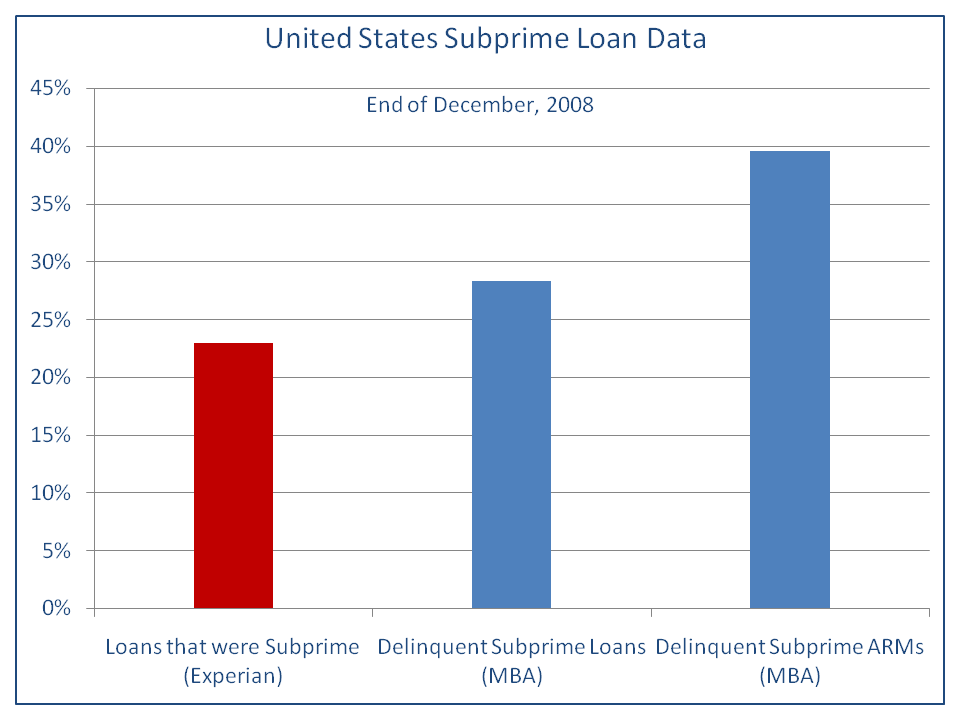
Ohio had a delinquency rate of almost 28 percent at the end of last year, with nearly 40 percent of subprime ARMs at least 60 days past due according to the MBA numbers.
LoanPerformance data for the end of December 2008 show that 30 percent of all subprime loans and more than 46 percent of subprime ARMs were delinquent in Ohio.6 In Youngstown, roughly one-third of all subprime loans were delinquent and almost half of subprime ARMs were at least 60 days past due.
Characteristics of Youngstown's Subprime Market
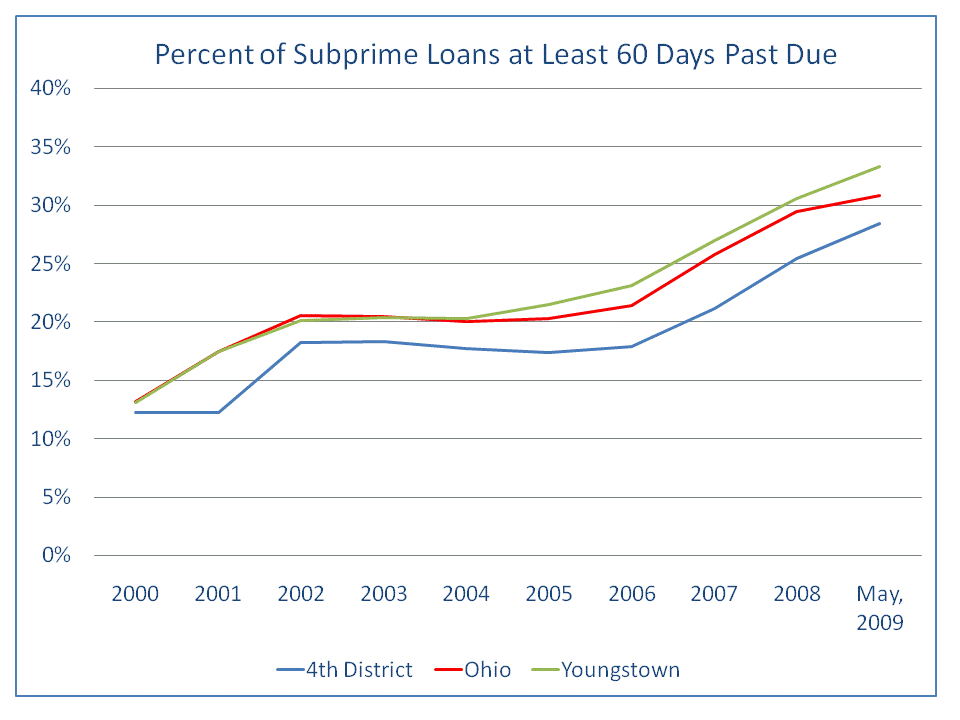
1. The percentage of subprime loans that were at least 60 days past due has grown since 2004 in both Ohio and Youngstown; the 4th District states began to see annual increases in 2005.
Youngstown, the state of Ohio, and the Fourth District states all saw roughly similar trends in the percentage of subprime home mortgage loans that were at least 60 days past due beginning in 2002. At the end of May 2009, the delinquency rate in Youngstown had climbed to more than 33 percent. Ohio stood at nearly 31 percent, while more than 28 percent of subprime loans in the Fourth District states were at least 60 days past due (see Figure 3).
Figure 2.
Delinquency Rates for Ohio and Youngstown
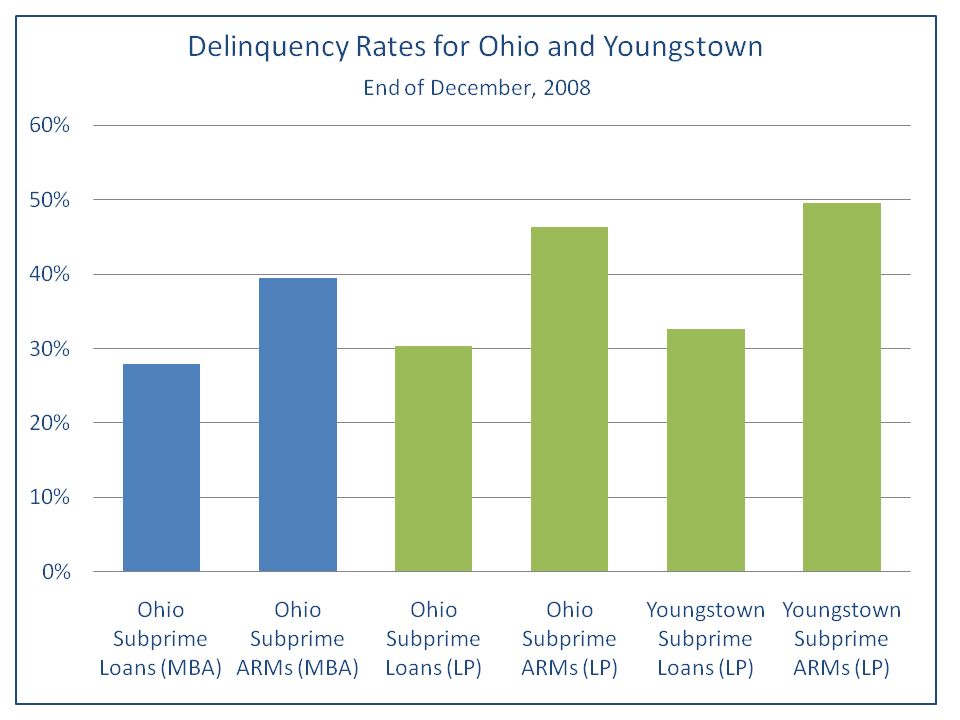
Figure 3.
Percent of Subprime Loans at Least 60 Days Past Due
2. Subprime loan originations began to grow in 2001, peaked in 2005, and began falling off rapidly and nearly disappeared by 2008.
As illustrated in Figure 4, Youngstown saw increases in the number of subprime loans originated from 2002 through the peak in 2005. Originations plummeted in 2006, and the subprime market virtually disappeared by 2008. Both the State of Ohio and the other Fourth District states saw similar trends. The number of subprime loan originations in Youngstown in 2007 was less than a fourth of the volume originated in 2005. By 2008, Youngstown's subprime originations had shrunk to less than 2 percent of its 2005 originations, based on the LP data sample.
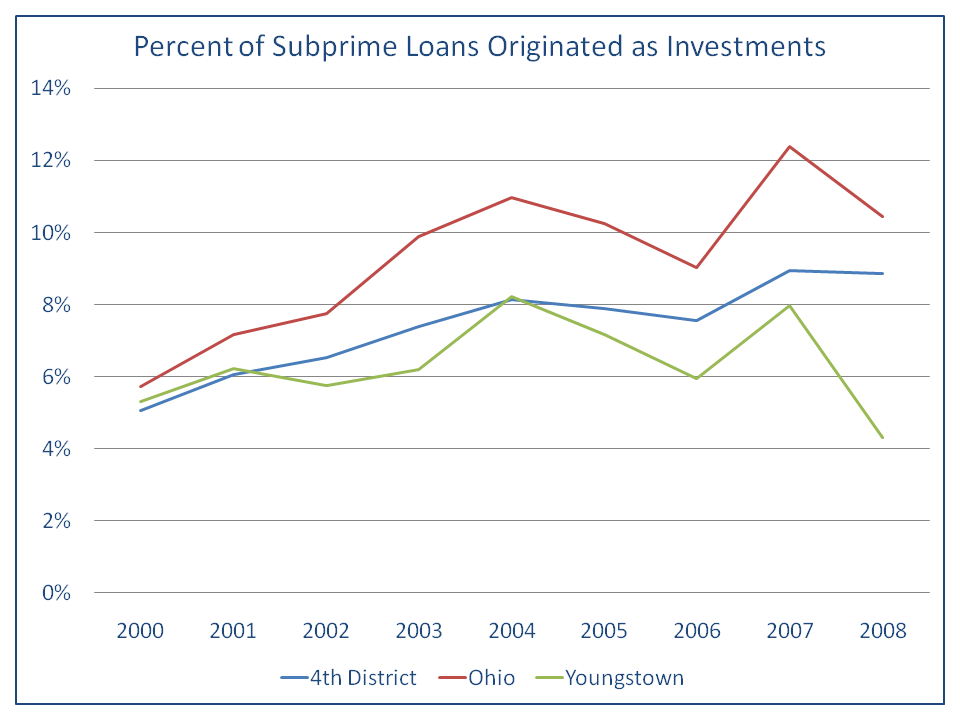
3. The percentage of subprime loans reported as being used for investment has consistently been lower in Youngstown than in the state of Ohio.
The vast majority of borrowers indicated that they intended to occupy the houses they were buying. The Fourth District States as a whole have seen a fairly steady increase in the percentage of home loans used for investment properties, while Ohio and Youngstown have experienced year-to-year variability. Youngstown has diverged from Ohio in that it consistently had a lower percentage of mortgages used for investments than the state as a whole. In addition, Youngstown experienced a steeper rate of decline in its subprime originations for investment purposes between 2007 and 2008 (see Figure 5).
Figure 4.
Percent Change in the Number of Subprime Loans Originated
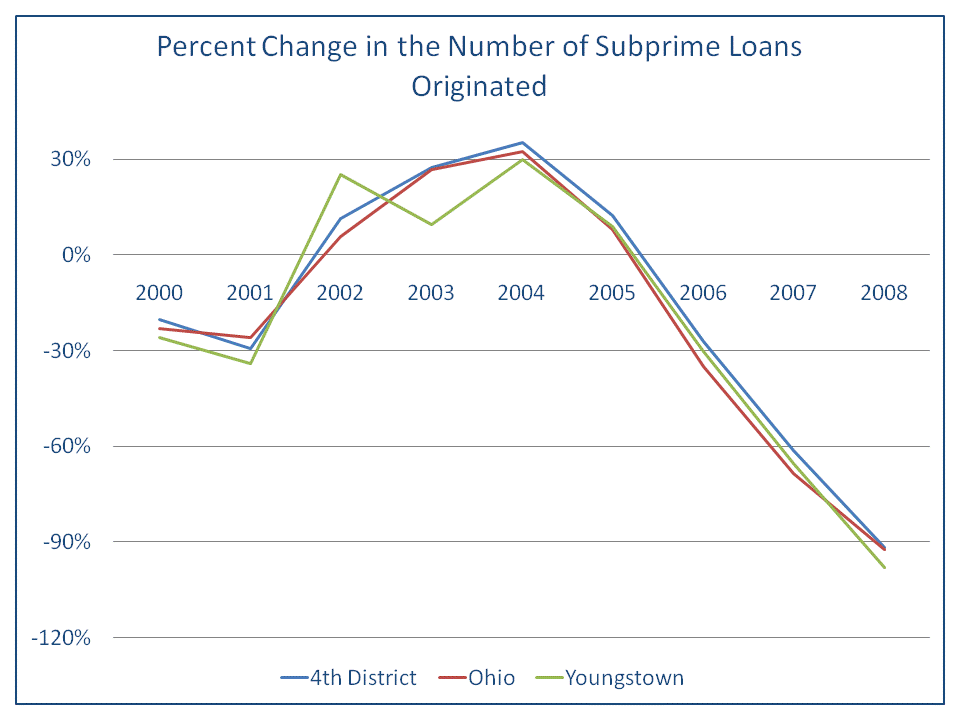
Figure 5.
Percent of Subprime Loans Originated as Investments
4. Subprime loans that were originated after 2003 deteriorated at a faster rate compared with previous vintages throughout the District. Adjustable-rate mortgages have fared considerably worse than their fixed-rate counterparts.
In the Youngstown metro area, not only are more loans becoming delinquent over time, but the rate at which these loans are defaulting is also rising. Since 2003 the area has seen increases in the percentage of loans that are defaulting relative to the number of months since the loan was originated, even after as few as six months (see Figures 6 and 7). In fact, more than one-quarter of subprime adjustable-rate loans originated in 2003 defaulted within 24 months. For subprime ARMs originated in 2006, more than 40 percent defaulted within two years. Analysis of delinquency rates for 2007 and 2008 were not considered reliable due to the low volume of subprime loans originated in those two years.
Figure 6.
Subprime Adjustable Rate Mortgage Delinquency Rates in the Youngstown Metro Area by Vintage
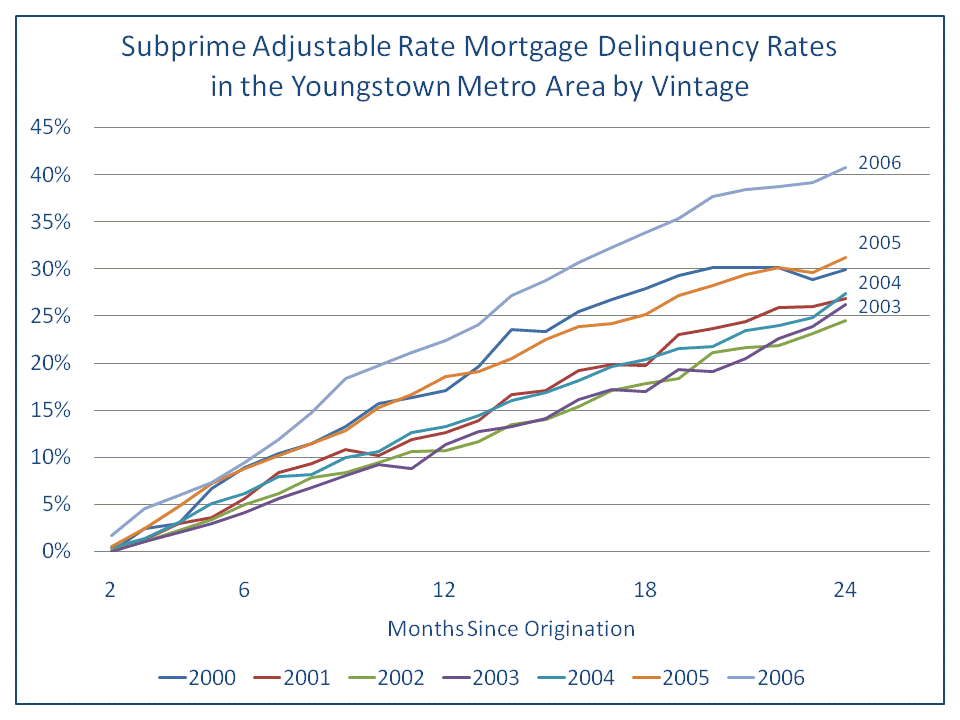
Figure 7.
Subprime Fixed Rate Mortgage Delinquency Rates in the Youngstown Metro Area by Vintage
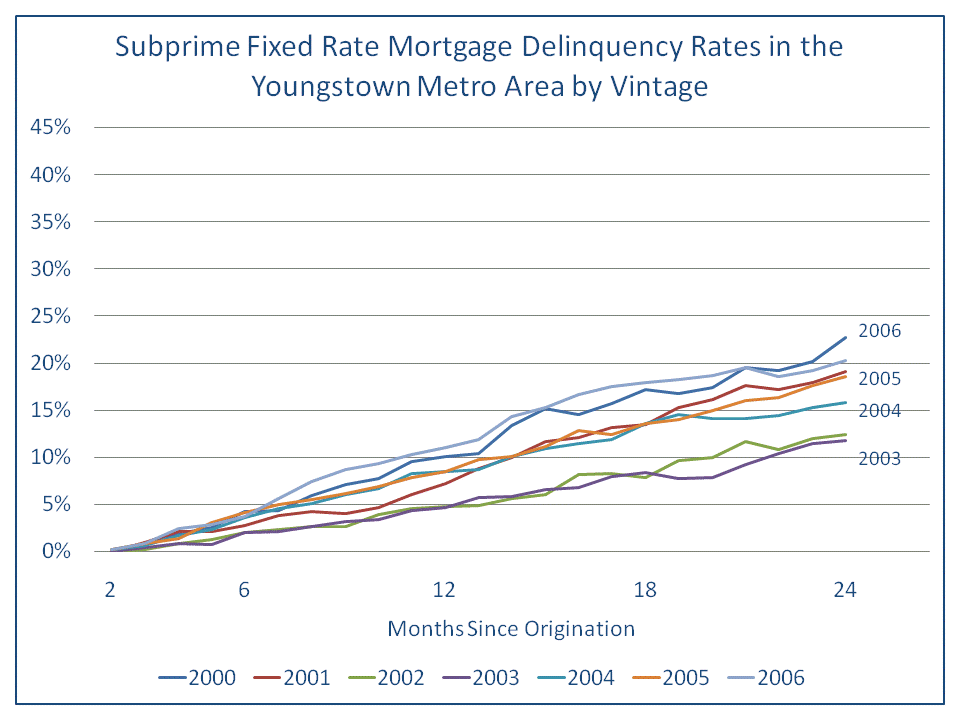
These increases are evident in both subprime fixed-rate and adjustable-rate mortgages. However, it is important to note that the ARMs have fared considerably worse than the fixed-rate mortgages.
Recent research has found that, even when accounting for borrower and loan characteristics as well as macroeconomic conditions, the quality of subprime loans in the United States deteriorated for six consecutive years beginning in 2001.7
5. Unlike the nation as a whole, the loan deterioration problem in the Youngstown area is not a consequence of a reversal of rapid house-price appreciation.
The aggregate U.S. market saw rapid increases in housing values between 2000 and 2007.8 The Youngstown metro area and State of Ohio, on the other hand, saw modest house price appreciation at best. All three geographies saw price declines in 2008 (see Figure 8).
Figure 8.
FHFA House Price Index, 1995 Q1 = 100
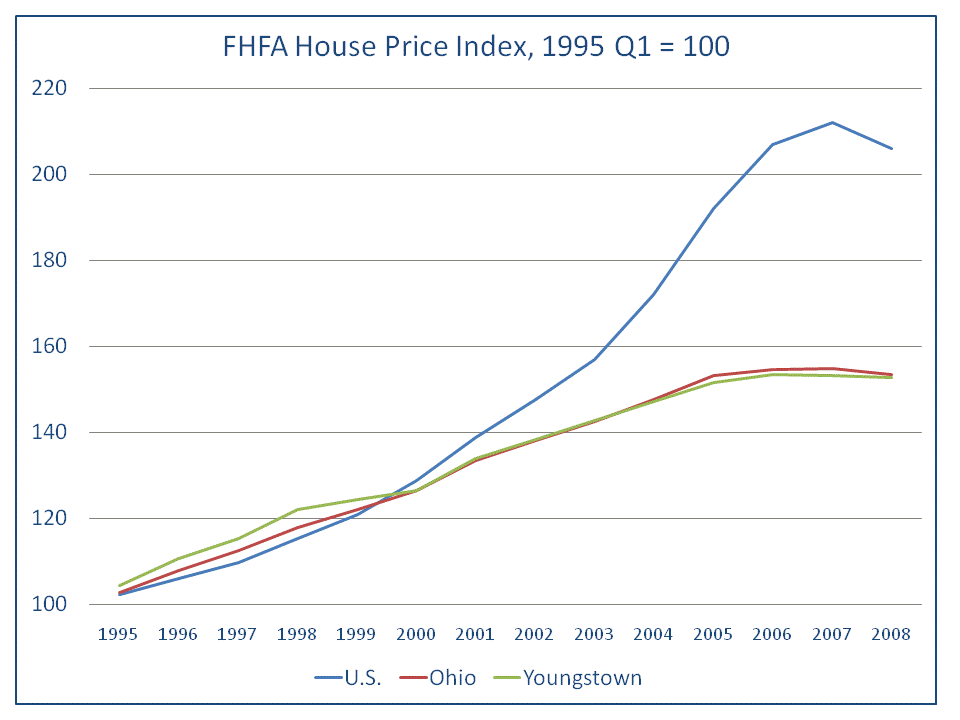
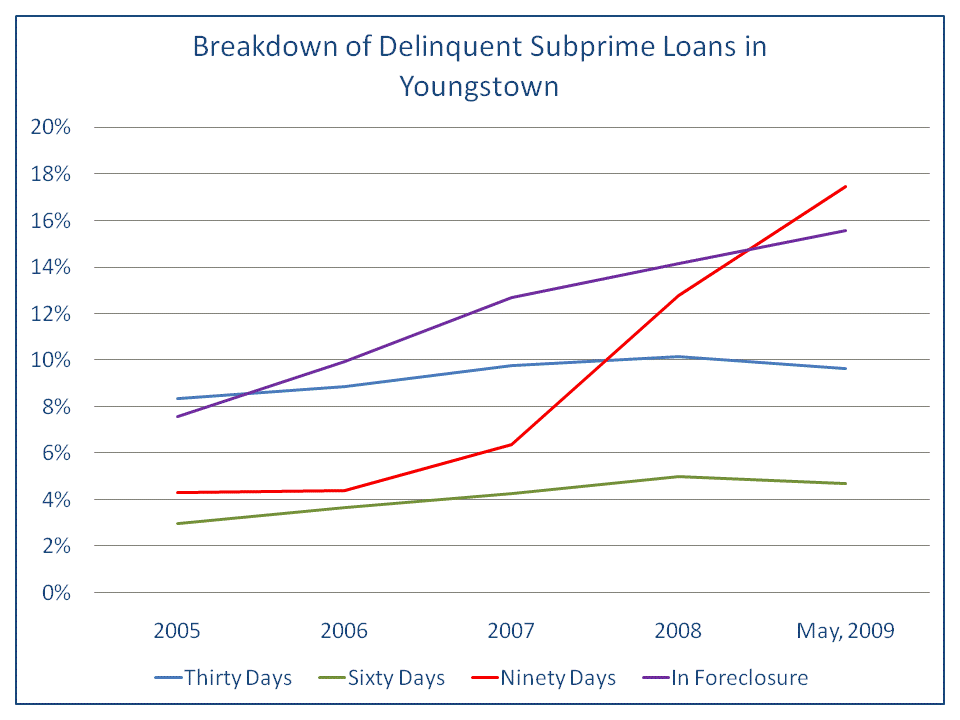
Figure 9.
Breakdown of Delinquent Subprime Loans in Youngstown
6. Delinquency rates in Youngstown have been slightly but consistently higher relative to Ohio and the 4th District states in both the prime and subprime markets.
According to the Lender Processing Services, Inc9 (LPS) dataset, the percentage of subprime loans between 30 and 89 days past due in Youngstown has decreased through the first five months of 2009 relative to the average for 2008. However, this modest improvement has been cancelled out by rapid increases in the percentage of loans at least 90 days past due and in foreclosure (see Figure 9).
Since 2005, the percentage of subprime loans at least 60 days past due has increased by more than two and a half times through the first five months of 2009 in Youngstown, Ohio, and the 4th District states. The mild variation in subprime delinquency rates among LP, LPS, and MBA is unsurprising given the ambiguity in the criteria for what constitutes a subprime loan. Delinquency rates for prime loans also nearly doubled in all three geographies during that time frame (see Figure 10).
Figure 10.
Percent of Prime and Subprime Loans at Least 60 Days Past Due
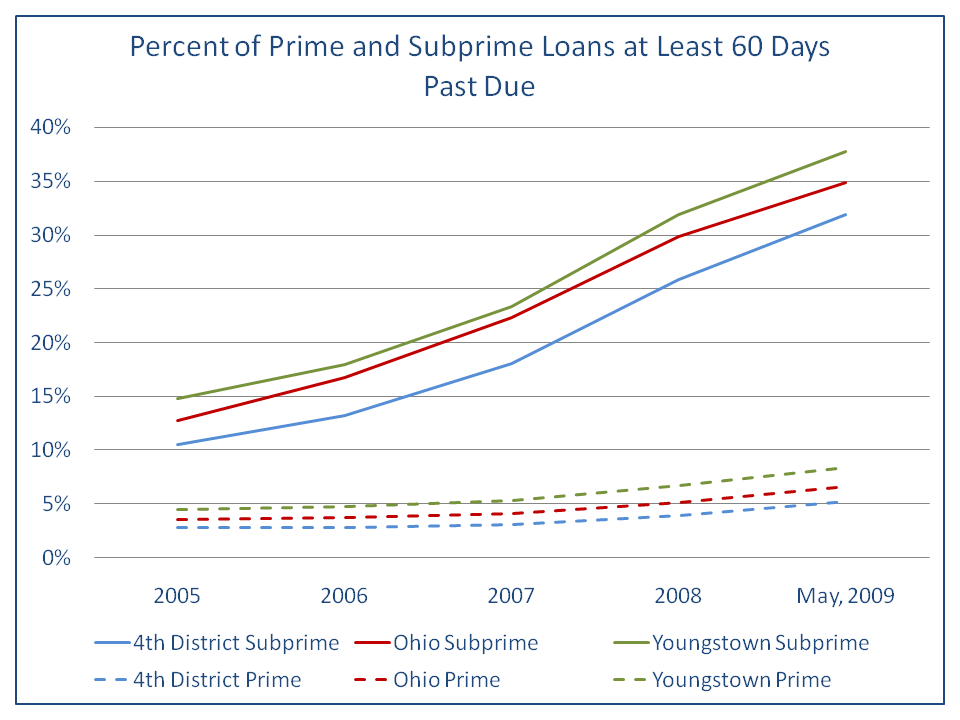
Figure 11.
Foreclosure Filings in Mahoning County, OH
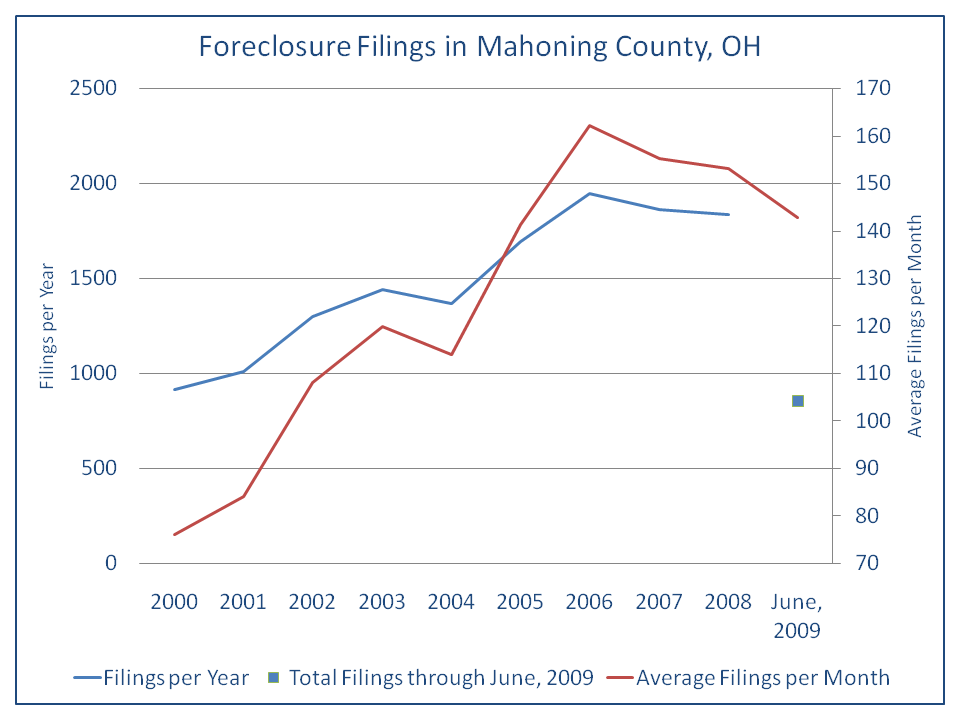
7. After peaking in 2006, foreclosure filings in Mahoning County have fallen through the first half of 2009.
The total number of foreclosure filings in Mahoning County, which includes the City of Youngstown, peaked in 2006 before falling in 2007 and again in 2008, according to data from the Mahoning County Clerk of Courts. The average number of foreclosures per month has continued to decrease through the first six months of 2009 (see Figure 11).
While home sales prices and volumes have been increasing in some markets over the past few months, the trends in home mortgage loans discussed above are less than encouraging. Recent research from the GAO entitled "Home Mortgages: Recent Performance of Nonprime Loans Highlights the Potential for Additional Foreclosures" also points to continued deterioration of the market going forward.
Footnotes
- In general, subprime mortgages are made to borrowers with blemished credit histories or to those who provide incomplete documentation of their income and assets. At its simplest, subprime lending can be described as high-cost lending. "The Evolution of the Subprime Mortgage Market," Federal Reserve Bank of St. Louis Review, January/February 2006, 88(1) pp. 31-56.
- The main dataset analyzed in this report is from First American LoanPerformance (LP) and is through December of 2008 except where otherwise noted. The data extracted from LP was for the Youngstown Core Based Statistical Area (CBSA), which consists of Mahoning County, OH, Trumball County, OH, and Mercer County, PA. For the purpose of this report, this area is referred to as the Youngstown metro area or simply Youngstown.
- In order to evaluate the outcomes of loans it is helpful to define what outcomes are possible. Loans are considered "current" if the borrower is not behind on payments. Loans can become delinquent and return to a "current" status if the missed payments are repaid. Borrowers can also file for bankruptcy, the lender can initiate foreclosure proceedings, or, once the foreclosure process has concluded, the loan can fall into real-estate owned (REO) status. In this report the terms "delinquent" and "delinquency" refer to loans that are at least 60 days past due, in foreclosure, and/or in bankruptcy.
- Shifting Consumer Delinquency Trends and the Potential Impact on Lending Policies. 2008 Experian Information Solutions Inc. 09/08. This report deemed loans to consumers with credit scores below 700 as subprime.
- National Delinquency Survey from the Mortgage Bankers Association, Q408. 2009. The MBA categorizes servicers as being either prime or subprime. Loans are designated as being either prime or subprime based upon the servicer's designation, regardless of the characteristics of the loans themselves. This can result in high-quality loans being classified as subprime, while loans with a much greater chance of delinquency can be classified as prime. This misclassification may result in overestimating delinquency rates for prime loans, as well as possible underestimating of the percentage of subprime loans that are delinquent.
- Except where otherwise noted, the analysis in this report comes from estimates using First American LoanPerformance (LP) Data. The data source includes an estimated 45 percent of all subprime loans nationally, but it is not possible to verify that the sample is an accurate representation of other levels of geography. Data are provided to LP by eight of the 10 major loan servicers. All data designations (prime/subprime, current/delinquent, etc.) are made by the individual servicers and are not based on criteria set by LP. Where relevant, the Mortgage Bankers Association (MBA) definitions are cited.
- Demyanyk, Yuliya S. and Van Hemert, Otto, Understanding the Subprime Mortgage Crisis (December 5, 2008). Available at SSRN: http://ssrn.com/abstract=1020396
- According to data from the Federal Housing Finance Agency (FHFA), formerly the Office of Federal Housing Enterprise Oversight (OFHEO), and extracted from Haver Analytics.
- LPS receives data at the loan level from seven of the nation's 10 largest servicers. LPS uses grades (A, B, or C), which are determined by the loan's servicer, to make the distinction between prime and subprime loans. The LPS data used in this report are through May 2009.