

- Share
The Cleveland Financial Stress Index: A Tool for Monitoring Financial Stability
Advisory: This article is based in whole or in part on the CFSI (Cleveland Financial Stress Indicator), an indicator that was discontinued by the Federal Reserve Bank of Cleveland in 2016 due to the discovery of errors in the indicator’s construction. These errors overestimated stress in the real estate and securitization markets. As a result, readers should be cautious and interpret any analysis based on CFSI data with those errors in mind.
The views authors express in Economic Commentary are theirs and not necessarily those of the Federal Reserve Bank of Cleveland or the Board of Governors of the Federal Reserve System. The series editor is Tasia Hane. This paper and its data are subject to revision; please visit clevelandfed.org for updates.
To promote stability in a dynamic financial system, supervisors must monitor the system for risks at all times. The Cleveland Fed has developed an index of financial stress, the CFSI, which is designed to track distress in the financial system as it is building. The CFSI will help financial system supervisors monitor and understand the state of financial markets on a real-time basis, and take appropriate regulatory or supervisory action as necessary.
The financial crisis of 2008 resulted in a sharpened focus on financial stability. Once merely a theoretical notion or, at best, a practical concept applied to emerging economies, financial stability has become a focal point of central banks around the globe. In particular, central banks in developed economies, including the United States, have made maintaining financial stability a priority nearly equal to that of monetary policy. Ben Bernanke, Chairman of the Federal Reserve Board of Governors, recently asserted that “The crisis has forcefully reminded us that the responsibility of central banks to protect financial stability is at least as important as the responsibility to use monetary policy effectively in the pursuit of macroeconomic objectives.”1
In order to promote stability in a dynamic financial system, policymakers must continually monitor the system to identify risks that threaten financial stability, both at present and in the future. An important first step is the development of tools that can monitor the condition of broad financial sectors. Ideally, the tools would also provide insight into the factors that are adversely affecting these markets.
The Federal Reserve Bank of Cleveland has developed such a tool: the Cleveland Financial Stress Index (CFSI). The CFSI incorporates information from a number of financial markets to provide a measure of financial system stress on a continuous basis. Financial system supervisors and macroeconomic policymakers can use the CFSI to monitor the condition of the financial system and to identify periods of excessive stress that may lead to financial instability.2
Construction of the CFSI
While there is debate over the appropriate definition of systemic stress, banking supervisors are likely to see it as the risk of the correlated default of financial institutions. A correlated default could impair the availability of capital and liquidity in the financial system, which could have subsequent negative effects on the real economy. To promote financial stability, supervisors must have the ability to monitor systemic risk in the financial system and be able to assess its level at a given point in time.
Like other indexes that measure aggregate movements in financial markets, the CFSI takes components that quantify individual aspects of the system and combines them into a single value. Specifically, the CFSI is constructed using daily data from 11 components reflecting four financial sectors: credit markets, equity markets, foreign exchange markets, and interbank markets (table 1). The overall financial system is complex and comprises many individual markets of varying size and significance. These four sectors were selected because they encompass major U.S. markets, and looking at them provides considerable coverage of the system. Stress in any of these four could carry over to others, affecting the system at large.
Table 1. Components of the Cleveland Financial Stress Index
| Sector | Component | Description |
|---|---|---|
| Credit | Covered interest spread | This spread measures the difference between the 90-day U.K. Treasury yield and the 90-day U.S. Treasury yield. It contains information about uncertainty in government bond markets. A widening spread signals unwillingness to hold a government’s debt, which implies difficulty in acquiring liquidity for governments, signaling the onset of stress. |
| Corporate bond spread | This spread measures the difference between the 10-year Moody’s Aaa-rated corporate bond yield and the 10-year U.S. Treasury yield, which captures medium- to long-term corporate risk. This is a useful stress indicator because when the likelihood of losses increases, firms have trouble financing debt and may be less able to obtain liquidity, which implies greater stress. | |
| Liquidity spread | The liquidity spread measures changes in the short-term differences in bid and ask prices on three-month U.S. Treasuries. A widening spread signals illiquidity in the market, which is associated with growing stress. | |
| Commercial paper–Treasury bill spread | This spread measures the difference between the 90-day financial commercial paper rate and the 90-day U.S. Treasury yield. It captures the short-term risk premium on financial companies’ debt. A widening spread signals increases in the underlying risk of financial companies’ operations. | |
| Treasury yield curve spread | The slope of the yield curve is a useful predictor of recessions and real economic activity. It is calculated as the difference between the three-month and 10-year U.S. Treasury yields. The slope captures the combination of long-term uncertainty and short-term liquidity needed at the outset of—and during—recessionary times. | |
| Equity | Stock market crashes | This indicator is measured as the ratio of the current value of the S&P 500 financial index relative to its maximum over the previous 365 days. The indicator captures the extent to which equity values have dropped over the previous year. It also contains information on expectations about the future condition of the financial services industry. |
| Foreign exchange | Weighted dollar crashes | This indicator is measured as the ratio of the current value of the trade-weighted U.S. dollar exchange index relative to the maximum over the previous 365 days. It measures flight from the U.S. dollar toward a broad set of foreign currencies. This signals increased demand for liquidity from the domestic financial system, requiring unanticipated, and potentially inefficient, lending. |
| Interbank | Financial beta | Financial beta is measured as the volatility of share prices in the banking sector relative to the overall stock market. This signals potential insolvency and a strain on bank profitability, relative to broader institutions. |
| Bank bond spread | This spread is measured as the difference between the 10-year A-rated bond yield and the 10-year U.S. Treasury yield. It captures the perception of medium- to long-term risk in banks issuing A-rated bonds. | |
| Interbank liquidity spread | The interbank liquidity spread is measured as the difference between the three-month LIBOR and the three-month U.S. Treasury yield. The spread reflects the perception of counterparty risk in interbank lending by measuring the risk premium associated with lending to commercial banks. The spread increases when either market liquidity is scarce or when counterparty default risk increases, both of which are associated with increasing financial stress. | |
| Interbank cost of borrowing | This spread is conceptually similar to the interbank liquidity spread and can also be used to measure counterparty risk. The interbank cost of borrowing measures the difference between the three-month LIBOR and the federal funds rate. |
Most of the CFSI components are spreads. Spreads show the gap in the yields, prices, or rates of different financial instruments, and they contain information about the market-perceived risk associated with those instruments. For example, the corporate bond spread is defined as the difference between the corporate bond yield and the Treasury yield. A widening corporate bond spread reflects the relative difficulty that firms have financing debt and obtaining liquidity, which indicates that the perceived risk of lending to corporate institutions in the medium to long term is increasing. Spreads also contain information relating to overall financial stress; a widening corporate bond spread, for example, could in part reflect broader financial stress.
Two of the remaining CFSI components are ratios, and one is a measure of stock market volatility. These components contain information about the stability of financial market conditions (in the stock market, foreign exchange markets, and banking sector).
The combined information about these sectors is more important for the detection of systemic risk than the information from any individual market. Numerous factors can affect spreads in individual markets over time, and many of them are not related to systemic stress. Further, when spreads change because of nonsystemic, stress-related events in one market, the change is not necessarily correlated with the movement of spreads in other markets. In contrast, systemic stress-related events are more likely to affect spreads in multiple markets. Observing conditions in a number of markets allows for the potential identification of a common factor, that is, financial stress.
The CFSI is designed to track stress in the U.S. financial system on a continuous basis. This allows banking supervisors and analysts to monitor stressful episodes as they are building. Such early detection is very important because when significant stress occurs in multiple markets, overall financial stress is quickly amplified. The CFSI does a good job of capturing past episodes of economically significant stress (figure 1).
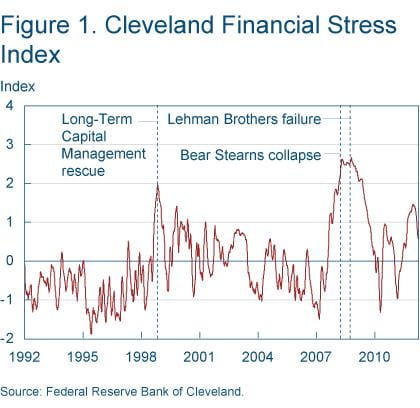
The Long-Term Capital Management (LTCM) crisis could be seen as the CFSI neared a value of 2.00 in the fall of 1998,3 a level not seen again until the beginning of the subprime crisis. The CFSI began picking up an increasingly stressful period beginning in late 2007, well before the full extent of the financial crisis was observed. The index topped out between the Bear Stearns collapse in early 2008 and the failure of Lehman Brothers in September of the same year.
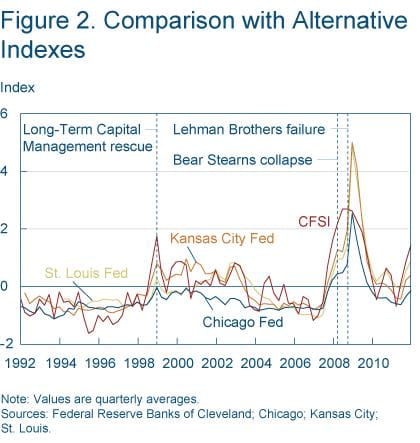
The CFSI tracks analogous financial stress indexes reasonably well, suggesting that it is a practical measure of financial stress (figure 2). The differences observed across indexes—the amount and timing of stress, for example—exist because each index emphasizes different aspects of the financial markets. One advantage of the CFSI is that it is available on a daily basis, and the additional information is responsible for some of the divergence from other indexes as well.4
Using the Index as a Supervisory Tool
Constructing the CFSI is only the first step in being able to monitor systemic stress. Learning how to interpret the index and using it in practice are next.
Care must be taken to interpret the index because it is a continuous measure. At what point along the CFSI continuum is a policy response required? One way to approach the interpretation is to identify specific values or thresholds that would trigger supervisory responses. These thresholds must be reasonably sensitive to detect trouble before it gets out of hand. If supervisors make them too broad, their monitoring of systemic stress will be inefficient. If supervisors make them too narrow, they might fail to recognize and act on systemic stress in a timely fashion.
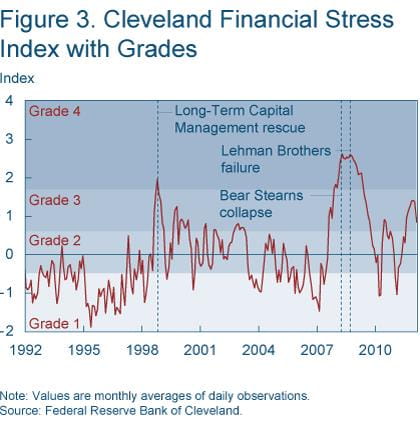
Michael Bordo, Michael Dueker, and David Wheelock (2000) showed in their research that a continuous index can be used to identify the severity of distress. They suggest a five-category differentiation: “severe distress,” “moderate distress,” “normal,” moderate expansion,” and “euphoria.”5 We employ a similar approach to distinguish the different categories of distress severity, offering minimum thresholds for potential supervisory responses.6 These thresholds yield four distinct stress classifications for the CFSI, which we refer to as stress grades (table 2). These grades differentiate “below-normal stress period,” “normal stress period,” “moderate stress period,” and “significant stress period.”
Table 2. Probability of Systemic Stress Episode by CFSI Grade
| CFSI grade at threshold | CFSI range | Probability |
|---|---|---|
| Grade 1 (below-normal stress) | Less than or equal to −0.50 | 1.9 |
| Grade 2 (normal stress) | Between –0.50 and 0.59 | 8.7 |
| Grade 3 (moderate stress) | Between 0.59 and 1.68 | 26.3 |
| Grade 4 (significant stress) | Greater than 1.68 | 53.3 |
Figure 3 shows the CFSI since 1991 and overlays CFSI grades. The CFSI climbed into the “significant stress period” grade in late 2007 and remained there through the middle of 2009. While the CFSI has not moved back into this “significant stress period,” it rose throughout 2011, fell in 2012, and currently remains in the “moderate stress period” grade.
In addition to providing the level and grade of systemic stress at any given time, the CFSI allows for an explicit analysis of the components that are contributing to financial stress. Because of the aggregation method used to calculate the index, stress can be attributed to equity, foreign exchange, credit, or interbank markets, or any combination of these. This, along with the financial market stress classifications, allows supervisors to develop various options for supervisory responses to financial stress, such as additional reporting requirements, more frequent and targeted monitoring, greater emphasis on stress testing, higher capital requirements, or higher liquidity requirements The same can also be said of policymakers who have a responsibility for ensuring financial stability (see “SAFE” in the Recommended Readings for related research).
Monitoring stress is an important responsibility of financial system supervisors. The Cleveland Financial Stress Index is one tool that can help them do that. The contemporaneous nature of the index, combined with the ability to trace the origins of elevated stress, will allow financial system supervisors to monitor and better understand the state of financial markets on a real-time basis, and to take appropriate regulatory or supervisory action as necessary. With further research, we will be able to use the Cleveland Financial Stress Index to forecast—and potentially to mitigate—systemic stress.
Footnotes
- “The Effects of the Great Recession on Central Bank Doctrine and Practice.” Ben S. Bernanke (2011). Federal Reserve Bank of Boston, 56th Economic Conference Return to 1
- For a detailed description of the index’s construction, see Oet, Eiben, Bianco, Gramlich, and Ong (2011). Return to 2
- Units of the CFSI are expressed as standardized differences from the mean (z-scores). Return to 3
- For a detailed analysis of comparison of presently available alternatives, see Oet, Eiben, Bianco, Gramlich, and Ong (2011). Return to 4
- Bordo, Dueker, and Wheelock (2000, p.27) assign Zt larger than 1.5 standard deviations (SD) above the subperiod mean to the “severe distress” category; Zt larger than 0.75 SD above the subperiod mean to the “moderate distress” category; Zt falling between ±0.75 SD of the mean to the “normal” category; Zt between −0.75 and −1.5 SD of the mean to the “moderate expansion” category; and Zt below −1.5 SD of the mean to the “euphoria” category. Return to 5
- For the details of this approach and how we estimate the financial stress thresholds, see Oet, Eiben, Bianco, Gramlich, and Ong (2011). Return to 6
Recommended Reading
- “Aggregate Price Shocks and Financial Instability: A Historical Analysis.” Michael D. Bordo, Michael J. Dueker, and David J. Wheelock, 2000. Federal Reserve Bank of St. Louis, working paper no. 2000-005B.
- “Financial Stress Index: Identification of Systemic Risk Conditions.” Mikhail V. Oet, Ryan Eiben, Timothy Bianco, Dieter Gramlich, and Stephen J. Ong, 2011. Federal Reserve Bank of Cleveland, working paper no. 11-30.
- “SAFE: An Early Warning System for Systemic Banking Risk.” Mikhail V. Oet, Ryan Eiben, Timothy Bianco, Dieter Gramlich, Stephen J. Ong, and Jing Wang, 2011. Federal Reserve Bank of Cleveland, working paper no. 11-29.
This work by Federal Reserve Bank of Cleveland is licensed under Creative Commons Attribution-NonCommercial 4.0 International

