

- Share
A Forecasting Assessment of Market-Based PCE Inflation
This article explores the potential for market-based inflation measures to improve inflation forecasting. To do so, I compare the pseudo-real time forecasting performance of a suite of models for forecasting total or “headline” PCE inflation over the short and medium run. In the forecasting exercise, a simple model using only market-based core PCE inflation showed the best forecasting performance at all horizons.
The views authors express in Economic Commentary are theirs and not necessarily those of the Federal Reserve Bank of Cleveland or the Board of Governors of the Federal Reserve System. The series editor is Tasia Hane. This paper and its data are subject to revision; please visit clevelandfed.org for updates.
A consensus view among policymakers is that monetary policy affects the economy with a lag. For this reason some policymakers emphasize the importance of setting monetary policy in a forward-looking manner, in which case better forecasting tools for key macroeconomic variables like inflation can lead to better policy. Recognizing that the key objective facing policymakers involves not just monitoring, but also forecasting, means that a host of methods have the potential to yield benefits over simply examining the most recent data point of the variable that policymakers aim to influence. When it comes to inflation, there is already some conventional wisdom that the best forecasting approach may involve the use of not only the total or “headline” measure of inflation but also other related series. For example, many commentators focus on core inflation measures to “filter out” the volatility of food and energy prices, which, historically, has often proved to be transitory.
The excessive volatility of certain components is not the only potential shortcoming of relying on the headline measures. A second reason to consider alternative measures is that some series are easier to accurately measure than others. For example, consider the price index for personal consumption expenditures (PCE), which is of particular interest because the Federal Reserve’s inflation target is stated in terms of inflation in this measure. The Bureau of Economic Analysis (BEA) produces the PCE index, but it also produces additional data series known as “market-based” measures of PCE inflation and core PCE inflation to address certain measurement concerns.1 The defining feature of the market-based indexes is that they exclude almost all imputed data. Since the market-based measures contain actual measured data for the most part, one might wonder if they offer a superior “signal” for the future direction of headline inflation. Or, put differently, perhaps the imputed series add more “noise” than “signal” to inflation measurement.
This article investigates whether or not the “market-based” inflation measures are useful as inflation predictors. To do so, I consider a suite of competing inflation forecasting models, some with the market-based measures and some without, and then examine which models perform best. We will find that market-based inflation measures can be useful sources of information about the likely path of future headline inflation and merit continued attention going forward.
Market-Based PCE Price Indexes
At a high level, the key characteristic differentiating market-based measures from the standard inflation measures is the exclusion of most imputed data from the market-based measures. Or, in terms of what they include and quoting the BEA’s documentation, “‘market-based’ price indexes are composed of PCE components that are deflated by either a detailed consumer price index (CPI) or a producer price index.”2 Under this definition, it happens that a “total” market-based PCE (MB-PCE) measure includes about87 percent of the expenditures in PCE. To be somewhat more concrete about the items excluded, note that virtually all of the excluded expenditures are services of some kind (96 percent) and, in particular, many of the services that might reasonably be described as financial services.3,4
To see why some price data are imputed rather than measured directly, consider the services in a category called “financial services furnished without payment,” which constitute about 20 percent of the PCE expenditures excluded by the MB-PCE. This category includes services such as those provided to customers with deposits at commercial banks. The recipients of these services typically do not directly pay the bank any fees for holding their deposits, and indeed the customers are typically paid interest by the bank. Hence, the value the customer receives, as well as the “price” the customer is paying for these services, must be somehow inferred from something other than a salient market transaction.
A Forecasting Comparison
I formalize the notion of “signal” in terms of an inflation indicator’s usefulness for predicting the future value of average annualized headline PCE inflation. In particular, I consider forecasts from a number of models using five different inflation indicators (and various combinations thereof): (1) the PCE price index (the benchmark model),(2) the core PCE price index, (3) the market-based PCE price index, (4) the market-based core PCE price index, and (5) the median PCE price index.5 The first four price indexes have already been discussed. The fifth price index, the median PCE price index, is constructed according to the work in Carroll and Verbrugge (2019), who define the measure as the weighted median of price changes among the full set of 201 price categories published by the BEA.
A First Look at the Data
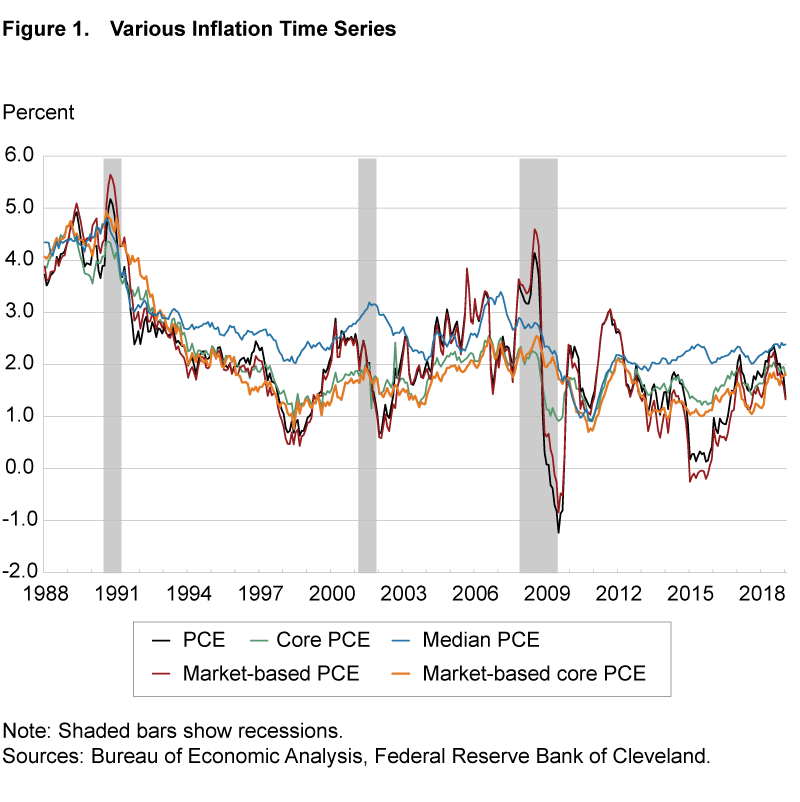
Figure 1 shows the time series of 12-month inflation rates for each of the five indicators, from which it is readily apparent that, although clearly correlated, the various inflation series display meaningfully different behavior. Of course the two core inflation measures are less volatile than their headline counterparts, but upon a close inspection one can see that meaningful differences also emerge between the two core inflation measures. Examining the recession periods in particular (highlighted with the usual gray shaded bars), one can see a pattern of market-based core PCE inflation falling less sharply during recessions than core PCE inflation. Discrepancies such as these open the possibility of differential forecasting performance across indicators.
The Forecasting Models
The forecasting models we consider take the following form
(1) πt,t+h = αh + βh xt−12,t + εt+h ,
where πt,t+h is the percentage change in the headline PCE price index between months t and t+h (annualized), xt−12,t is the percentage change of a price index of interest over the previous 12 months, αh is a constant term, and βh is the responsiveness of the πt,t+h prediction to a one-unit change in the inflation index used for prediction.6 Specifications like equation (1) are common in the literature on inflation forecasting.7
The benchmark model, to which I will compare various alternatives, constructs the forecast on the basis of PCE headline inflation over the previous year, i.e., xt−12,t = πt−12,t. I also consider numerous alternative specifications, namely, with xt−12,t as each of the four other series described above, as well as every combination of 1, 2, 3, 4, or all 5 of these inflation measures. This yields 31 possible choices of right-hand-side variables in equation (1).
For each combination of regressors, I consider two different procedures for using the available data on the right-hand-side variables: (1) an expanding window of data and (2) a rolling window of 100 months. The 31 combinations of regressors and 2 different estimation procedures then gives 62 competing models for each forecasting horizon.
For each combination of regressors, and each estimation procedure, I evaluate the model’s success at forecasting 1, 3, 6, 12, 24, and 36 months into the future. Conceptually, each choice of right-hand-side variables, each estimation procedure, and each forecasting horizon constitutes a distinct model, thus giving rise to 6×62 = 372 different forecasting models to be estimated from the available data at a given point in time.
I then re-estimate all models, at each point in time in the estimation evaluation sample period, using only the data available up to that period.8 In the academic literature, such an exercise is known as a “pseudo-real-time” forecasting exercise.9
The available time series for the market-based measures is relatively short, beginning in only January 1987, so the forecast evaluation begins in January 1996 and concludes in January 2019. This is to say that I do not start evaluating the forecasts until the models subject to the tightest data limitation have 10 years of data informing their estimates. The full exercise then consists of 103,044 unique model estimations and forecasts.
I compare and assess the models on the basis of their root-mean-squared errors (RMSEs), a standard metric for evaluating point forecasts, for which lower numbers are better (and zero is the best possible value).
Results
Before presenting the results, it is helpful to think through what one should reasonably expect. Since each forecasting horizon has its own set of accompanying models, there need not be any particular specification that clearly “wins” the forecasting competition for all horizons; it could well be the case that certain combinations of regressors perform well at some forecasting horizons but not at others.
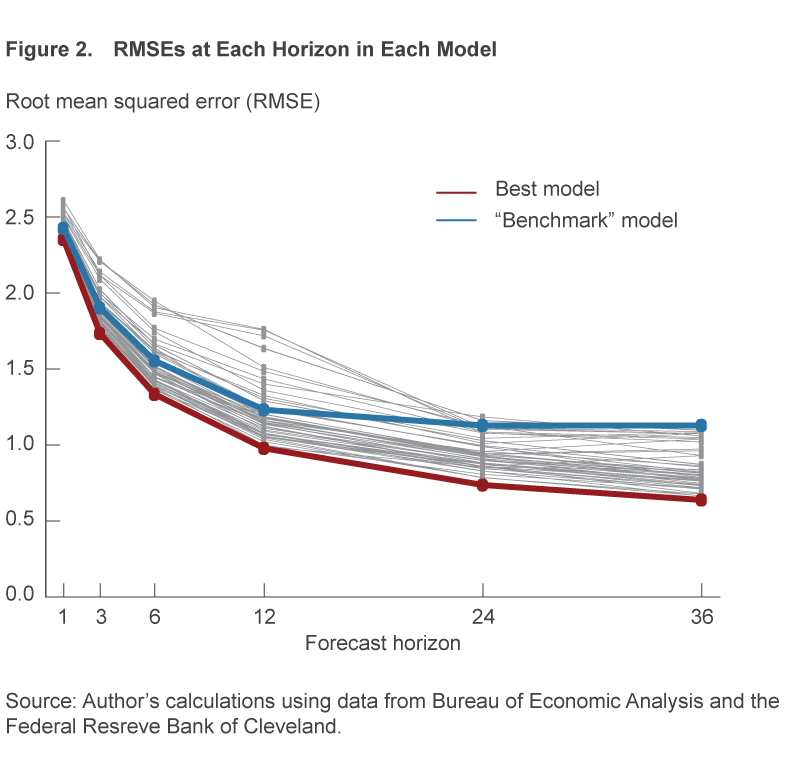
Turning to the results, figure 2 plots the RMSEs of each model at each forecasting horizon. There are 62 dots at each of the forecasting horizons, and lower numbers on the y-axis indicate better forecasting performance. The figure highlights the forecasting performance of a particular specification, termed the “best model” that, surprisingly, performs the best at all six forecasting horizons. It turns out that this apparent best model uses only a single regressor, market-based core PCE inflation, and estimates the model parameters using the expanding window of data.
I next examine how the winning model specification uses the available information to construct its forecasts. Table 1 shows the estimates of the model parameters, αh and βh, for the forecasting models for each horizon.10 The most basic, but still notable, fact is that the estimated values of αh and βh do not equal 0 and 1, respectively. This means that the best use of market-based core PCE inflation does not involve simply projecting its value forward “as is,” but rather it requires a linear transformation that puts a partial weight on its value (i.e., where βh is a positive number but less than 1), reflecting the informativeness of its recent behavior, and a partial weight on the constant term αh, reflecting the systematic longer-run behavior of the headline PCE inflation series being predicted.
| |
Forecast horizon (h) | |||||
|---|---|---|---|---|---|---|
| Parameter | 1 | 3 | 6 | 12 | 24 | 36 |
| αh | 0.81 | 0.85 | 0.89 | 0.92 | 0.98 | 1.12 |
| βh | 0.63 | 0.62 | 0.59 | 0.56 | 0.51 | 0.42 |
Source: Author’s calculations.
Lastly, I examine the current forecasts from the best model in light of the most recent data. The most recent available data point for market-based core PCE inflation is for September 2019 and is equal to 1.65. Plugging the September 2019 value into equation (1), and for each forecasting horizon transforming the value using the parameters given in table 1, gives forecasts of average annualized headline PCE inflation over the next 1 to 36 months of between 1.8 percent and 1.9 percent, or very slightly below 2 percent, as summarized in table 2.
| Forecast horizon (h) | ||||||
|---|---|---|---|---|---|---|
|
|
1 | 3 | 6 | 12 | 24 | 36 |
| Predicted πt,t+h | 1.85 | 1.87 | 1.86 | 1.84 | 1.82 | 1.81 |
Source: Author’s calculations.
Conclusion
A challenge of setting monetary policy in a forward-looking way is assessing where important, but volatile, macroeconomic variables are headed. This article explores the potential for market-based inflation measures to improve inflation forecasting. To do so, I compared the pseudo-real-time forecasting performance of a suite of models for forecasting headline PCE inflation over the short and medium run. In the forecasting exercise, a simple model using only market-based core PCE inflation showed the best forecasting performance at all horizons. When given the most recent observations from which to generate predictions, the market-based core PCE inflation model predicts that headline PCE inflation will average between 1.8 percent and 1.9 percent both in the near term (the next 1 to 6 months) and in the medium term (the next 1 to 3 years).
Footnotes
- Note that in the literature there are two very different uses of the term “market-based” when discussing inflation. In some contexts the term is used to describe measures of inflation forecasts constructed from the prices of financial securities, and in others the term is used to refer to the particular inflation indexes bearing this name and constructed by the BEA. In this article I use the phrase in the latter sense. Return to 1
- More information on the composition of the market-based PCE deflators can be found at https://www.bea.gov/help/faq/83, which includes links to tables that show market-based PCE categories and the other-than-market-based PCE categories. Further detail on PCE components and the methods for measuring each of them can be found in the document https://www.bea.gov/system/files/2019-05/Chapter-5.pdf. Return to 2
- The shares are computed from the detail given in NIPA Table 2.4.5U Personal Consumption Expenditures by Type of Product (using the values from 2018 Q4) and a list of other than market-based PCE (OTMB-PCE) categories provided by the BEA. Return to 3
- The two largest components, by a considerable margin, are final consumption expenditures of nonprofit institutions serving households (25 percent) and financial services furnished without payment (20 percent). The third largest, portfolio management and investment advice services (11 percent), is similar in nature to the second and hence it would be fair to say that a plurality of OTMB-PCE consists of some kind of imputed financial services. In this characterization of OTMB-PCE’s makeup, one might also reasonably include the OTMB-PCE categories of mutual fund sales charges, trust, fiduciary, and custody activities, as well as net health insurance and net motor vehicle and other transportation insurance, in which case the share of OTMB-PCE attributable to some kind of imputed financial services becomes 53 percent. Return to 4
- The data on each of the first four price indexes are publicly available from the FRED database maintained by the Federal Reserve Bank of St. Louis under the following mnemonics (in the order given in the text), (1) PCEPI, (2) PCEPILFE, (3) DPCMRG3M086SBEA, and (4) DPCXRG3M086SBEA. Data and background for the median PCE price index can be obtained from the Federal Reserve Bank of Cleveland online at Median PCE Inflation. Return to 5
- Mathematically, this means that πt,t+h is defined as
πt,t+h = [(yt+h / yt )12/h − 1] × 100,
where y is the headline PCE deflator index and
xt−12,t = (zt / zt−12) × 100,
where z is a particular inflation index. Return to 6 - These model specifications follow Crone et al. (2013) and, before them, Blinder and Reis (2005). Return to 7
- All model estimations are carried out from a Bayesian perspective but with diffuse priors for the parameters. Return to 8
- The word “pseudo” is insinuated into the terminology because the data are subject to revisions. Hence, a truly real-time exercise would require the use of the particular values of each inflation series that were actually available as of each date. Return to 9
- The parameter estimates given in the table are informed by the full sample of data for 1987–2019. Return to 10
References
- Blinder, Alan S., and Ricardo Reis. 2005. “Understanding the Greenspan Standard.” In The Greenspan Era: Lessons for the Future, A Symposium Sponsored by the Federal Reserve Bank of Kansas City. Proceedings of the symposium held in Jackson Hole, Wyoming. Federal Reserve Bank of Kansas City (August 25–27): 11–96.
- Carroll, Daniel R., and Randal J. Verbrugge. 2019. “Behavior of a New Median PCE Measure: A Tale of Tails.” Federal Reserve Bank of Cleveland, Economic Commentary, 2019-10.
- Crone, Theodore, N. Neil Khettry, Loretta J. Mester, and Jason Novak. 2013. “Core Measures of Inflation as Predictors of Total Inflation.” Journal of Money, Credit, and Banking, 45(2-3): 505–519.
Suggested Citation
Bognanni, Mark. 2020. “A Forecasting Assessment of Market-Based PCE Inflation.” Federal Reserve Bank of Cleveland, Economic Commentary 2020-01. https://doi.org/10.26509/frbc-ec-202001
This work by Federal Reserve Bank of Cleveland is licensed under Creative Commons Attribution-NonCommercial 4.0 International

