

- Share
Productivity Growth and Real Interest Rates in the Long Run
Despite the unemployment rate’s return to low levels, inflation-adjusted or “real” interest rates have remained negative. One popular explanation for persistently negative real interest rates is that long-run productivity growth has slowed. I study the long-run relationship between real interest rates and productivity growth from 1914 to 2016 and find a negative correlation between these two variables. Hence, low productivity growth has been historically associated with high real interest rates. Since World War II, the correlation between these variables has been near zero. This suggests that slow long-run productivity growth is not driving real interest rates to be persistently negative.

The views authors express in Economic Commentary are theirs and not necessarily those of the Federal Reserve Bank of Cleveland or the Board of Governors of the Federal Reserve System. The series editor is Tasia Hane. This paper and its data are subject to revision; please visit clevelandfed.org for updates.
The real federal funds rate and the real interest rate on 3-month Treasury bills have been consistently negative since December 2008.1 Historically, negative real interest rates have been associated with high levels of inflation and efforts by the Federal Reserve to reduce high unemployment rates. In contrast, inflation has been low since December 2008, and the unemployment rate has been near or below its pre-2008 average of 5.6 percent since late 2014. Yet negative real interest rates persist. This unusual behavior of real interest rates has motivated economists to search for long-run factors, which are factors that persist even after the unemployment rate has returned to normal, that change real interest rates.
One long-run factor popular for explaining negative real interest rates is the low level of productivity growth in the economy.2 Textbook macroeconomic theory predicts a positive relationship between productivity and real interest rates, implying that a lower trend in productivity growth will lead to persistently lower real interest rates. Motivated by this theory, I study the long-run correlation of real interest rates and productivity growth from 1914 to 2016. Following Lunsford and West (2017), I do so by using rolling averages of the data as well as new statistical techniques that are designed to isolate long-run patterns in the data.
I find that the long-run correlation between real interest rates and productivity growth is actually negative from 1914 to 2016. That is, in contrast to standard economic theory, low real interest rates have been historically associated with high productivity growth.
Because the two world wars and the Great Depression dominate the early part of my sample, I also study the long-run correlation of real interest rates and productivity growth from 1948 to 2016. Over this sample, different measures of the correlation give both positive and negative results. However, the measures are generally small in magnitude and statistically indistinguishable from zero. This suggests that factors other than productivity growth are important for understanding the long-run movements in real interest rates.
The results of this Commentary suggest that low productivity growth is not driving persistently negative real interest rates. The results also indicate that an upward shift in productivity growth will not necessarily lead to higher real interest rates. Finally, the results suggest that low productivity growth does not condemn the economy to low or negative real interest rates. For example, the years from 1985 to 1994 had low productivity growth but relatively high real interest rates.
Theoretical Motivation
The positive theoretical relationship between productivity growth and real interest rates can be found in the Ramsey (1928) model of saving and investment. While this model is relatively simple, it is a staple of macroeconomic theory (Romer, 2006, chapter 2) and has been used in recent research to study trends in interest rates (Council of Economic Advisors, 2015; Rachel and Smith, 2015).
The intuition for the Ramsey model is as follows. First, households like to smooth consumption over time. Second, when productivity growth is low, households suspect that their future income may be lower than their present income. Thus, households save more today in order to supplement low incomes in the future, smoothing out consumption. This high level of desired savings provides more funds to firms for investment. Because firms invest in their most profitable projects first, these additional funds allow firms to invest in less profitable projects, which lowers the interest rate that can be paid. Hence, low productivity growth leads to low interest rates.
Conversely, when productivity growth is high, households save less today because they know they will not need to supplement their future income. This low level of current savings provides fewer funds for investment, causing firms to invest in only the most profitable projects, raising the rate of interest that can be paid. Hence, high productivity growth leads to high interest rates.
The Data and Empirical Methodology
The focus of this Commentary is on the long-run relationship between real interest rates and productivity. Because of this, I use a long data sample from 1914 to 2016 for both real interest rates and productivity growth, covering essentially the entire history of the Federal Reserve System. In addition, I use data at an annual frequency. However, no single interest rate or productivity series covers this entire sample, so I construct these series from multiple sources.
To construct a series of interest rates, I use the interest rate on 3-month Treasury bills from 1934 to 2016, the yield on short-term Treasury securities from 1920 to 1933, and a combination of call money rates and discount rates at the Federal Reserve Bank of New York for 1914 to 1919.3 All data series are monthly annualized rates. To convert to an annual frequency, I take averages over each year. Finally, to compute real interest rates, I subtract annual inflation as measured by the percent change in the consumer price index from December of the preceding year to December of the current year.4
I use total factor productivity (TFP) as my measure of productivity.5 This measure compares the total output of new goods and services in the economy to the combined inputs, such as labor hours, equipment, and commercial buildings, used to produce those goods and services. To construct a series for productivity growth, I use TFP growth from the Long Term Productivity Database for 1914 to 1947,6 and I use TFP growth from John Fernald at the Federal Reserve Bank of San Francisco for 1948 to 2016.7
To study the long-run relationship between real interest rates and productivity growth, I first smooth out each data series in order to focus on the long-run features of the data. Then, I estimate the correlation between the smoothed series.
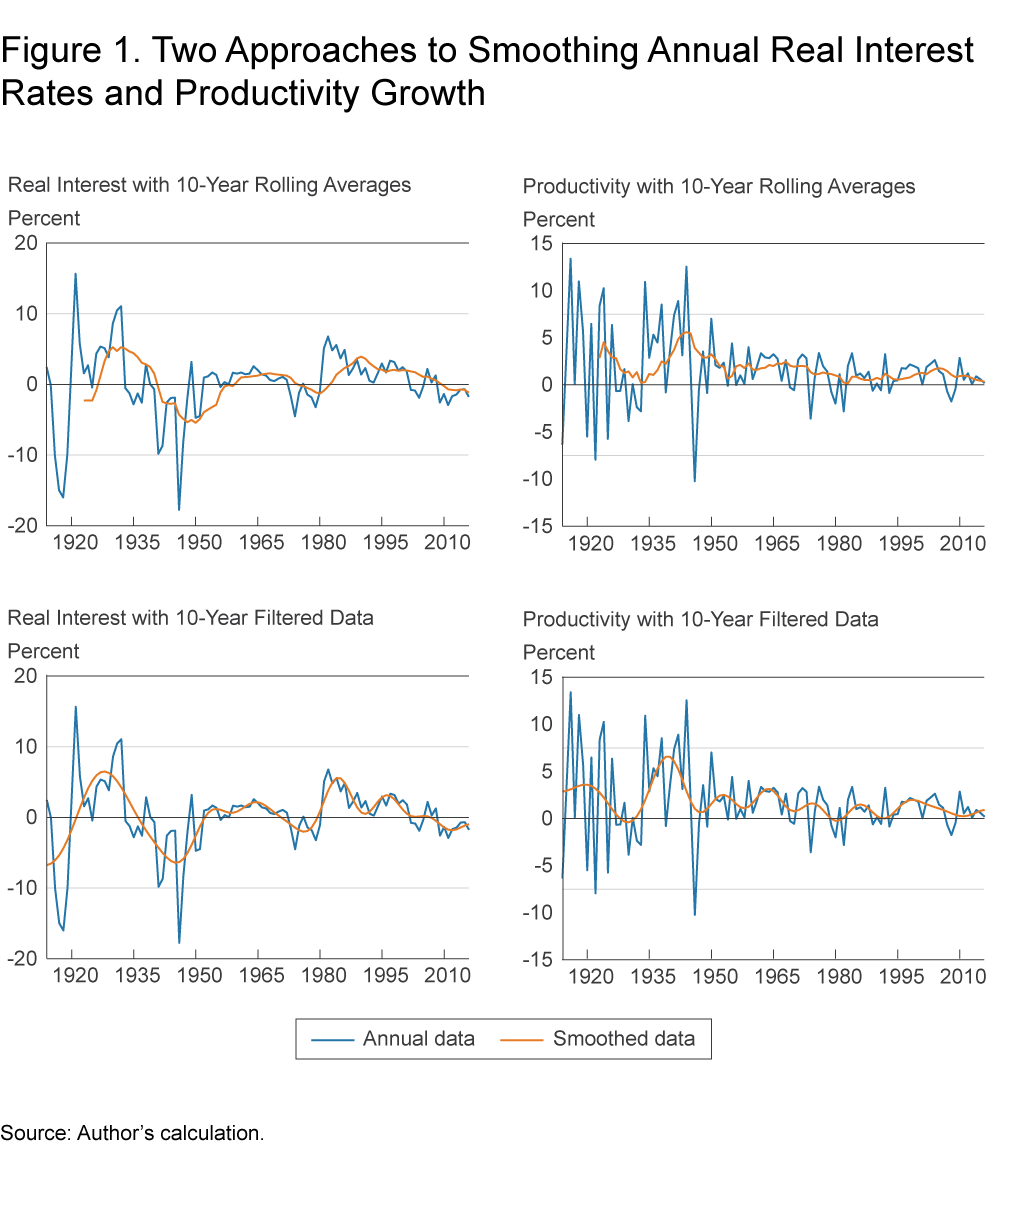
I consider two different methods of smoothing. The first method simply takes rolling averages of the real interest rates and productivity growth rates. Because the definition of long run in this Commentary is periods of time that are long enough for the unemployment rate to return to normal, I consider 10-year, 15-year, and 20-year rolling averages. I choose these average lengths because they are longer than time periods that are commonly associated with the business cycle but short enough to preserve variation in the data needed to estimate correlations.
The second method of smoothing uses a linear regression that is designed to filter out patterns in the data that occur more frequently than a designated cutoff. I refer to this type of smoothing as producing “filtered data.” As with the rolling averages, I use cutoffs of 10 years, 15 years, and 20 years.8 That is, I preserve patterns in the data that occur with periods longer than 10, 15, or 20 years.
Figure 1 shows that both types of smoothing yield similar patterns.9 In particular, they give negative real interest rates and low levels of productivity growth during the past few years. I use both types of smoothed data to compute the correlations in the next section.10
Figure 1. Two Approaches to Smoothing Annual Real Interest Rates and Productivity Growth
Results from 1914 to 2016
Table 1 displays the correlations and the corresponding 90 percent confidence intervals for both types of smoothing and each smoothing length.11 Contrary to what the standard economic theory would predict, the 10-year, 15-year, and 20-year rolling averages all give correlations that are negative and statistically distinct from zero. While the filtered data produce correlations that are closer to zero than the rolling averages and give larger confidence intervals, the filtered data also indicate that the long-run correlation between productivity growth and real interest rates is negative.
| Rolling averages | Filtered data | |
| 10-year correlation | −0.52 | −0.40 |
| 90% confidence interval | (−0.72,−0.32) | (−0.65,−0.03) |
| 15-year correlation | −0.58 | −0.46 |
| 90% confidence interval | (−0.87,−0.29) | (−0.74,−0.01) |
| 20-year correlation | −0.61 | −0.60 |
| 90% confidence interval | (−0.96,−0.27) | (−0.84,−0.11) |
Source: Author’s calculations.
These results suggest that low productivity growth has been historically associated with high real interest rates and vice versa. Two notable time spans in which productivity growth was high and real interest rates were low are 1915 to 1924 and 1935 to 1954. These periods cover the United States’ involvement in the world wars and the immediate postwar periods. Two notable time spans in which productivity growth was low and real interest rates were high are 1925 to 1934 and 1980 to 1994. These periods cover the beginning of the Great Depression and the disinflation associated with Paul Volcker. All of these time spans last at least a decade, cover multiple business cycles as identified by the National Bureau of Economic Research, and provide examples of the negative long-run relationship between real interest rates and productivity growth.
Results from 1948 to 2016
Because the two world wars and the Great Depression dominate the beginning of the 1914 to 2016 sample, I re-estimate the correlations in table 1 using a sample period of 1948 to 2016. I choose 1948 as the beginning of the sample because it is the first full year that the Federal Reserve System allowed interest rates on Treasury bills to rise following World War II. I note here that I do not simply use the above rolling averages and filtered data beginning in 1948. Rather, I start the annual data in 1948 and re-compute the rolling averages and filtered data. This completely removes the influence of the pre-1948 sample.
Table 2 displays the correlations and the corresponding 90 percent confidence intervals for both types of smoothing and each smoothing length.12 As with the whole sample, the rolling averages suggest that the long-run correlation between real interest rates and productivity growth is negative. However, the estimated correlations are closer to zero, and only the 20-year rolling averages give a correlation that is statistically distinct from zero. This suggests that much of the negative correlation in the whole sample is being driven by the years 1914 to 1947.
| Rolling averages | Filtered data | |
| 10-year correlation | −0.04 | 0.03 |
| 90% confidence interval | (−0.48,0.41) | (−0.42,0.47) |
| 15-year correlation | −0.28 | 0.07 |
| 90% confidence interval | (−0.67,0.12) | (−0.47,0.56) |
| 20-year correlation | −0.49 | −0.14 |
| 90% confidence interval | (−0.71,−0.28) | (−0.70,0.54) |
Source: Author’s calculations.
The filtered data give correlations that are both positive and negative. However, all of the correlations are close to zero in magnitude, and none are statistically distinct from zero. As with the rolling averages, this suggests that much of the negative correlation in the whole sample is being driven by the years 1914 to 1947.
Overall, the 1948 to 2016 sample provides less evidence of a negative long-run correlation than the 1914 to 2016 sample. However, the 1948 to 2016 sample does not support the theory that low long-run productivity growth drives low real interest rates. If anything, the rolling averages still suggest a negative relationship, and the filtered data give long-run correlations that are essentially zero.
Summary and Discussion
In contrast to what economic theory would predict, I find a negative long-run correlation between productivity growth and real interest rates from 1914 to 2016. For the more recent subperiod from 1948 to 2016, I find a mix of negative and positive correlations that are generally close to zero.
These results suggest that factors other than productivity growth are important for understanding the long-run movements in real interest rates. One possible long-run factor is demographics. As the baby boomers have aged, they have increased their savings in anticipation of retirement. These savings have provided more funds for investment, pushing down interest rates. Gagnon et al. (2016) suggest that these baby boom effects have been especially important over the past decade.
This Commentary also provides guidance for future research about the natural rate of interest, or r*, which is the level of the real interest rate that produces stable inflation. While the natural rate of interest can be different than the long-run interest rate studied here, economic theory suggests both rates should be positively correlated with long-run productivity growth. This tenet of basic macroeconomic theory is embedded in r* models such as that of Laubach and Williams (2003). However, the results of this Commentary indicate that this theory is not directly evident in historical movements in real rates and productivity growth. More work is needed to develop theoretical models that can explain movements in r* with other determinants.
Footnote
- Throughout this Commentary, I study ex post real interest rates, which subtract realized consumer price inflation from nominal interest rates. Another measure of real interest rates is ex ante rates, which subtract expected consumer price inflation from nominal interest rates. See Lunsford and West (2017) for a study of ex ante rates.Return
- For example, see Rachel and Smith (2015), Fischer (2016, 2017), and Yi and Zhang (2017).Return
- All data are from the FRED database: https://fred.stlouisfed.org/. The series number is TB3MS for the 3-month Treasury bill, M1329AUSM193NNBR for the short-term Treasury securities, M13009USM156NNBR for the Federal Reserve Bank of New York discount rate, and M13001USM156NNBR for the call money rates. To combine the call money rates and discount rates for 1914 to 1919, I use the smaller of the two rates. This reflects the importance of call loans in the early twentieth century as a “convenient form of secondary bank reserve.” (Homer and Sylla, 2005). However, because of the newly formed Federal Reserve System, call loans fell in importance into the 1920s.Return
- The consumer price index is from the FRED data base, and the series number is CPIAUCNS.Return
- Using labor productivity yields quantitatively similar results.Return
- These data are at http://www.longtermproductivity.com/, and Bergeaud et al. (2016) give a description of the database.Return
- These data are from the supplement to Fernald (2012) at http://www.frbsf.org/economic-research/economists/john-fernald/.Return
- Formally, I regress the data on a series of cosine waves as described in Müller and Watson (2008, 2015). Then, I keep the fitted values as the smoothed data. See the technical appendix for more details.Return
- Data smoothed with 15-year and 20-year lengths are not shown for brevity.Return
- Note that the rolling averages do not begin in 1914. Rather, for the 10-year averages, they begin in 1923 because I use the period 1914 to 1923 to compute the first 10-year average. Similarly, the 15-year averages begin in 1928, and the 20-year averages begin in 1933.Return
- Confidence intervals for the rolling averages treat each average as an observation and then use asymptotic inference based on those observations. These rolling averages will be highly serially correlated, and so consistent estimates of the long-run covariance matrix can perform poorly as noted in Section 3.1 of Müller and Watson (2015). Because of this, I use section 4.1 of Müller and Watson (2015) with 10 cosine waves to estimate the long-run covariance matrix. This procedure assumes that the data are stationary. Return
Confidence intervals for the filtered data also assume that the data are stationary and also follow Section 4.1 of Müller and Watson (2015). As a robustness check on the stationarity assumption, I also produce correlation estimates and confidence intervals using computation files for Müller and Watson (2017) that make no ex ante stationarity assumption. These results are quantitatively similar to the results in tables 1 and 2. See the technical appendix for further details. - Confidence intervals follow the same methodologies as for table 1. Return
References
- Bergeaud, Antonin, Gilbert Cette, and Rémy Lecat, 2016. “Productivity Trends in Advanced Countries between 1890 and 2012,” The Review of Income and Wealth, 62(3): 420-444.
- Council of Economic Advisors, 2015. “Long-Term Interest Rates: A Survey.”
- Fernald, John, 2012. “A Quarterly, Utilization-Adjusted Series on Total Factor Productivity.” Federal Reserve Bank of San Francisco, working paper 2012-19.
- Fischer, Stanley, 2016. “Why Are Interest Rates So Low? Causes and Implications.” Speech at the Economic Club of New York on October 17.
- Fischer, Stanley, 2017. “The Low Level of Global Real Interest Rates.” Speech at the Conference to Celebrate Arminio Fraga’s 60 Years, Casa das Garcas, Rio de Janeiro, Brazil, on July 31.
- Gagnon, Etienne, Benjamin K. Johannsen, and David Lopez-Salido, 2016. “Understanding the New Normal: The Role of Demographics.” Finance and Economics Discussion Series, Number 2016-080, Federal Reserve Board.
- Homer, Sidney, and Richard Sylla, 2005. A History of Interest Rates: Fourth Edition. John Wiley & Sons, Inc.
- Laubach, Thomas, and John C. Williams, 2003. “Measuring the Natural Rate of Interest,” Review of Economics and Statistics, 85(4): 1063-1070.
- Lunsford, Kurt G., and Kenneth D. West, 2017. “Some Evidence on Secular Drivers of US Safe Real Rates.” Working paper, forthcoming.
- Müller, Ulrich K., and Mark W. Watson, 2008. “Testing Models of Low-Frequency Variability,” Econometrica, 76(5): 979-1016.
- Müller, Ulrich K., and Mark W. Watson, 2015. “Low-Frequency Econometrics,” NBER Working Paper, No. 21564.
- Müller, Ulrich K., and Mark W. Watson, 2017. “Long-Run Covariability,” NBER Working Paper, No. 23186.
- Rachel, Lukasz, and Thomas D. Smith, 2015. “Secular Drivers of the Global Real Interest Rate,” Bank of England Staff Working Paper, No. 571.
- Ramsey, Frank P., 1928 “A Mathematical Theory of Saving,” Economic Journal, 38(152): 543-559.
- Romer, David. 2006. Advanced Macroeconomics: Third Edition. McGraw-Hill/Irwin.
- Yi, Kei-Mu, and Jing Zhang. 2017. “Understanding Global Trends in Long-Run Real Interest Rates,” Federal Reserve Bank of Chicago, Economic Perspectives, 41(2).
Suggested Citation
Lunsford, Kurt G. 2017. “Productivity Growth and Real Interest Rates in the Long Run.” Federal Reserve Bank of Cleveland, Economic Commentary 2017-20. https://doi.org/10.26509/frbc-ec-201720
This work by Federal Reserve Bank of Cleveland is licensed under Creative Commons Attribution-NonCommercial 4.0 International

