

- Share
New Normal or Real-Time Noise? Revisiting the Recent Data on Labor Productivity
Some economic observers have argued that the weakness of recent productivity data indicates we have entered a new era of low economic growth. To investigate that claim, we study labor productivity between 1968 and 2016 and compare recent productivity growth to its past behavior. We find that though recent productivity data are unambiguously weak, they are not greatly out of line with the variation of productivity over the historical record. We find that when labor productivity has been weak in the past, it did not persist at those levels. In addition, we find a systematic tendency to understate growth in real time, suggesting that the average rate of the past six years will likely be revised up in future.
The views authors express in Economic Commentary are theirs and not necessarily those of the Federal Reserve Bank of Cleveland or the Board of Governors of the Federal Reserve System. The series editor is Tasia Hane. This paper and its data are subject to revision; please visit clevelandfed.org for updates.
The importance of productivity growth to the economy would be difficult to overstate. For example, gains in labor productivity—the amount of real GDP produced per hour of work—are the only known way to increase standards of living over the long run.
Productivity growth also factors into the Federal Reserve’s assessment of appropriate monetary policy. This is because standard macroeconomic models tightly link average productivity growth to a theoretical object known as the long-run neutral real rate of interest, which economists denote as r* (pronounced “r star”).1 This long-run neutral real rate of interest is the real interest rate expected to prevail over the long run when the Federal Reserve is fulfilling the objectives prescribed by its dual mandate of maximum employment and price stability. In these models, a higher level of productivity growth implies a higher value for r*, and, conversely, a lower level of productivity implies a lower r*.
Since the Great Recession of 2007–2009, the average rate of productivity growth has been low compared to the long-run average that prevailed before. Some economic observers have pointed to the relatively weak recent productivity data as a source of concern for the economy’s long-term growth prospects and argued that we have entered a “new normal” characterized by low economic growth. Because of productivity’s link to r*, the new normal would also entail low nominal interest rates to achieve the Fed’s inflation target.2
Broadly speaking, economists tend to break into three camps regarding the interpretation of productivity growth’s recent weakness for long-run growth. The first camp considers the weakness to be emblematic of underlying forces that are likely to persist well into the future. One might call these the “secular stagnationists,” and their view is that we are entering a “new normal.” Expositors of this view, such as Robert Gordon, often point to such factors as an aging population, declining population growth, and the exhaustion of gains from the internet and technology booms.3,4
The second camp argues that the productivity weakness is likely temporary and that such episodes have historically turned around unpredictably. This is the view maintained as part of the Federal Reserve Bank of St. Louis’s monetary framework.5
The third camp argues that there is no productivity weakness at all, but, rather, the weak growth rates in the data are an artifact of mismeasurement in the face of rapidly changing consumer goods and production processes, a view espoused by Hal Varian, chief economist at Google.6
Still other economists, such as Joel Mokyr, have views of the long run that incorporate elements of the second and third camps, but they also argue that the rate of technological innovation will accelerate in the future. They expect the rate of productivity growth to accelerate as well.
This article shows that the historical record warrants some caution in concluding with certainty that the average rate of productivity growth—based on roughly the past six years of data—has permanently fallen. One reason is that there have been times in the past when six-year average productivity growth has fallen to levels like those seen today, but then it has recovered substantially, an observation that meshes well with the view of the second camp. A second reason is that the history of revisions to data on productivity growth suggests it is likely that the average rate of the past six years will be revised up in the future, which one might consider to be a slightly different spin on the views of economists in the “mismeasurement camp.”
The Link between Productivity Growth and Monetary Policy: The Concept of r*
To understand the importance of labor productivity growth for monetary policy, one must first understand the relevance of r*. Generally speaking, a real interest rate (rt ) is a nominal interest rate (Rt ) adjusted for expected inflation in the next period (E[πt + 1]), that is,
(1) rt = Rt − E[πt + 1] .
That r* is the particular value of the real interest rate consistent with the dual mandate can be seen by examining its role in a standard Taylor rule for setting the nominal interest rate, like the policy rules described on the Cleveland Fed’s website (https://clevelandfed.org/policyrules),
Rt = r* + π* + ψ1(πt − π* ) + ψ2 OutputGapt ,
where πt is current inflation, π* is the inflation target, and OutputGapt is the difference between potential and current output. When inflation is at its target (so (πt − π*) is zero) and the economy is producing at its potential (so OutputGapt is zero), the Taylor rule prescribes
(2) Rt = r* + π*.
If consumers and firms expect inflation to continue at the target rate, such that π* = E[πt + 1], the real interest rate becomes
(3) rt = Rt − E[πt + 1] = Rt − π*.
Substituting the Taylor rule’s prescribed value of Rt from equation (2) into equation (3) gives
rt = (r* + π*) − π* = r* ,
and thus r* becomes the real interest rate in time t.
Typically, r* is thought to be determined by macroeconomic fundamentals, such as the average rate of productivity growth, rather than by monetary policy. For example, in one simple macroeconomic model,
r* = γ/β,
where γ is long-run average productivity growth and β is the rate at which the model’s consumers discount the future (typically thought to be a value slightly less than 1, such as 0.99).7 From the relationship among Rt, r*, and π* specified in equation (2), one can see that, through its effect on r*, average productivity growth is a key determinant of the normal level of the nominal interest rate.
Recent Productivity Data in Historical Context
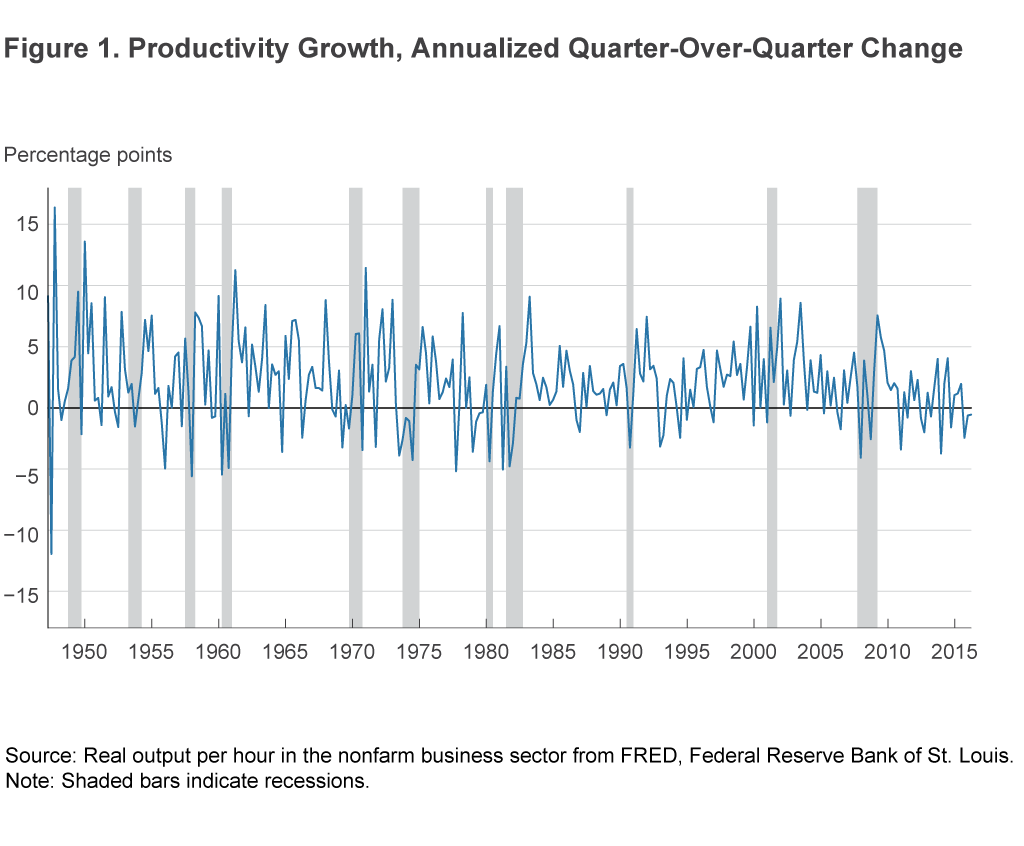
Throughout this article, we focus on a standard measure of labor productivity called “real output per hour in the nonfarm business sector.”8 We begin our analysis by examining the current estimates of the productivity time series.
Figure 1 shows the time series of the growth rate of productivity, which makes one feature of the data immediately apparent: The data are tremendously volatile from quarter to quarter.
The data’s volatility makes it difficult to conclude anything from a handful of observations, which is why economic observers have focused on average growth rates overmultiyear periods. We follow their lead and compute average productivity growth rates over a “rolling window” of a few years’ worth of data. The term “rolling window” means that at each date we compute the average value over a fixed number of data points prior to each date. We can then contextualize the recent data by comparing the average productivity rate of the recent period with those in subperiods of the same length.
In particular, our rolling window consists of 25 quarters of growth rates (slightly more than six years). We choose25 quarters because 2010 is a common starting point for the sample representing “recent” productivity data and, as of our most recent data point of 2016:Q2, the prior 25 growth rates incorporate all of the information from the productivitydata (in levels) from 2010:Q1 onwards.9 This choice of window size is, of course, fairly arbitrary, but none of the conclusions in this article is meaningfully sensitive to our particular choice.10
Figure 2 shows a plot of the rolling window averages, with the current value of productivity growth and the average growth rate from 1968:Q1 to 2010:Q1 highlighted, from which we make a few observations.11 First, we can see that recent productivity growth is as weak as it has ever been since 1968. Second, the weakness is not entirely unprecedented. One comparable episode occurred in the early 1980s after a period of slowing growth, and, notably, this productivity slowdown did not last forever.
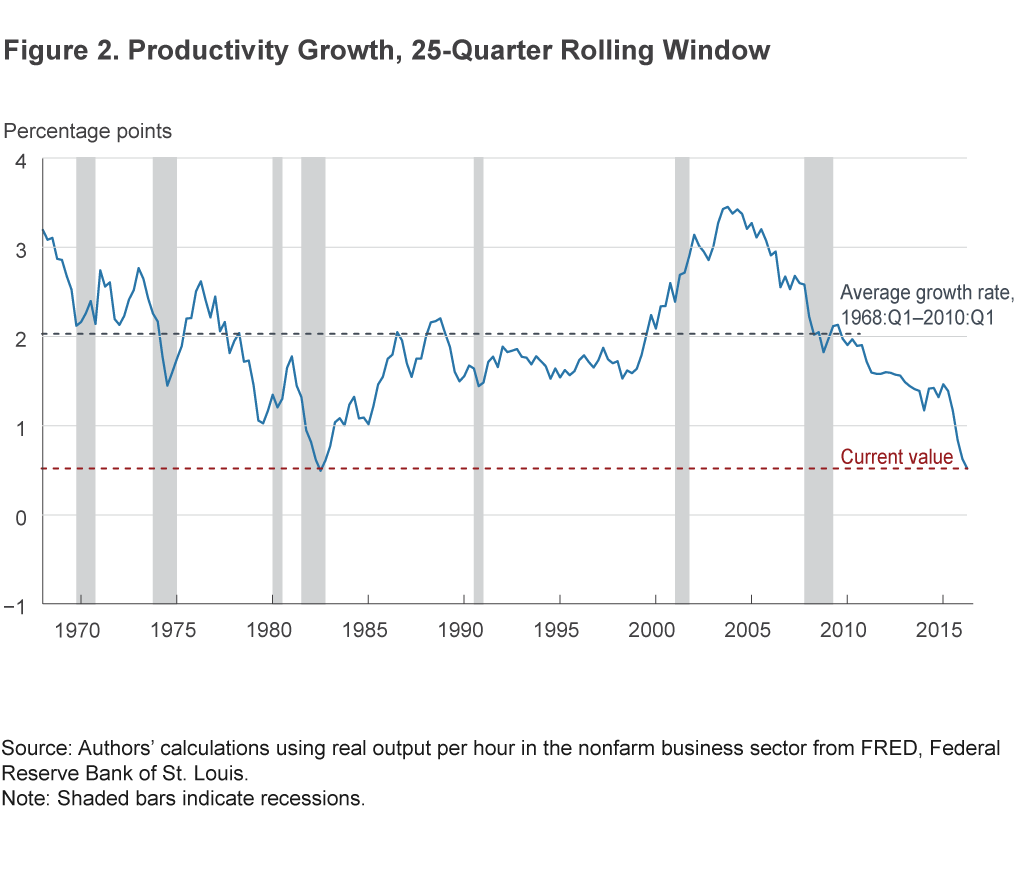
The second observation may seem simple, but it is an important one to keep in mind since most comparisons of the recent productivity data contrast the current value to historical averages over substantially longer periods of time. The fact that we have seen comparable subperiods, which did not persist, is evidence that the period prior to 2010 was not a time of steady 2.0 percent productivity growth from which we have only recently departed. Rather, the economy has regularly moved in and out of high- and low-productivity periods. Having said that, we do acknowledge that, in comparing today to the early 1980s, one thing is quite different: The current average comes entirely from a recovery period, whereas the low in the early 1980s came following two bad recessions.
Recent Productivity Data in Historical Real-Time Context
Recent productivity growth seems unambiguously low when looking at figure 2, but that conclusion ignores the fact that productivity data are inherently real-time data. As noted earlier, the data on productivity are subject to revisions. The revisions occur for two reasons. First, over time, statistical agencies acquire better information about the underlying series, output and labor hours, from which they construct productivity. Second, over time, statistical agencies change their method of measuring the underlying series.12
One might reasonably hope that real-time data are “well-behaved” in the sense that the real-time values turn out to be, on average, correct. However, economists have determined that this is not the case for many macroeconomic variables.13 In particular, productivity data have historically undergone especially large revisions.14
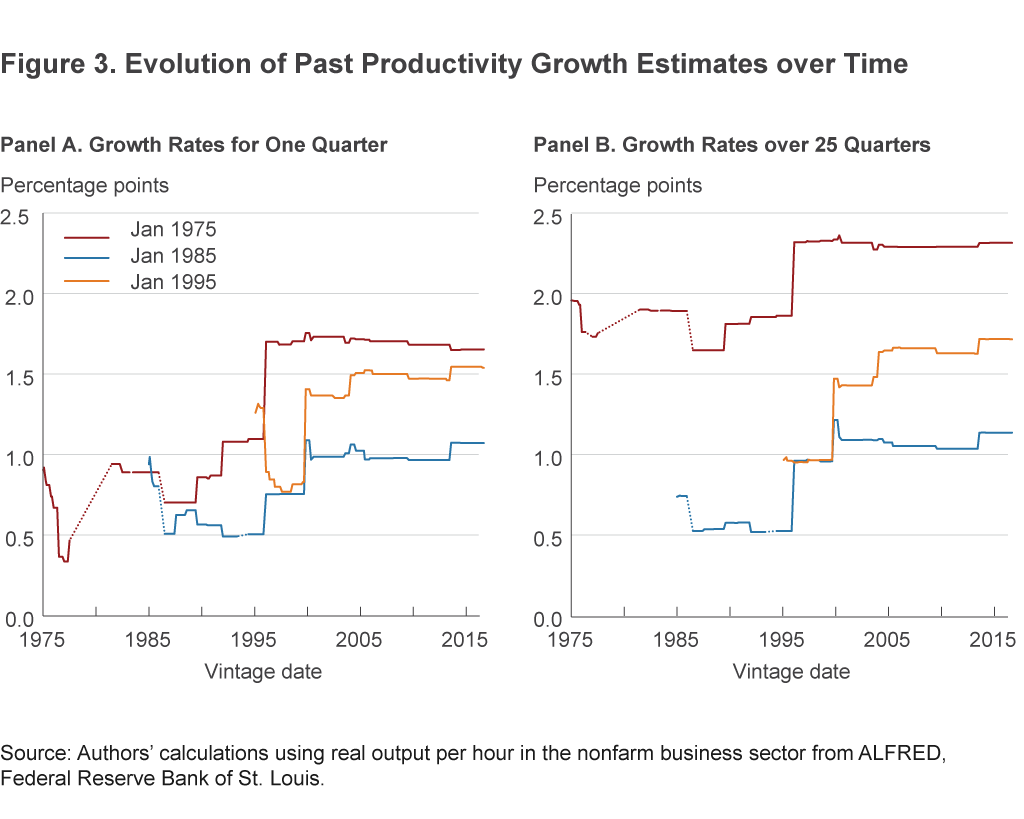
Figure 3 shows three examples of how our assessments of past productivity growth have evolved over time, both for single-quarter growth rates (panel A) and for growth over 25 quarters (panel B). Each line in the figure pertains to the growth rate over a fixed period, say 1975:Q1, and begins when the first report of growth over that period was released. As the line moves rightward to later dates, each value represents the beliefs about productivity growth that occurred in 1975:Q1 but uses all of the information available as of the later date. In other words, the sequence of values moving rightward shows how over time we revised our beliefs about productivity growth in 1975:Q1. The relevant data are occasionally missing, which we signify by connecting the line segments with a dotted line. We can see that the growth rate of a single quarter can easily receive a revision larger in magnitude than the original value, and even a 25-quarter average can easily be revised by more than half a percentage point. As we will see, even more extreme examples exist. Furthermore, the most substantial revisions can easily occur 20 years later.
We cannot know for sure how the current data will ultimately be revised, but we can examine the historical record of real-time data and its subsequent revisions to inform our assessment of the current observations. In this spirit, we ask whether or not there have been other periods in US history in which the real-time data looked similar to the recent data, but which were not evident from our examination of the fully revised data in figure 2. That is, were there periods in which real-time productivity weakness was later revised away? To make this assessment, we need to have different versions of the productivity time series as they were viewed at each date, which economists refer to as different data “vintages.” Fortunately, nearly all vintages of our preferred productivity series, from 1968 onwards, are available from the St. Louis Fed’s ALFRED database.15
Figure 4 shows the same series as figure 2 along with a second series based on real-time data. The real-time series shows average productivity growth over the 25 quarters prior to each date as it was reported at each date. A few periods have no value for the real-time series because the first release of labor productivity growth for those periods did not simultaneously include values for productivity for the previous 25 quarters, so we could not compute the real-time 25-quarter average for those periods. Panel B shows the distance between the two series in panel A, which is the total revision to our beliefs about the 25-quarter change at each date.
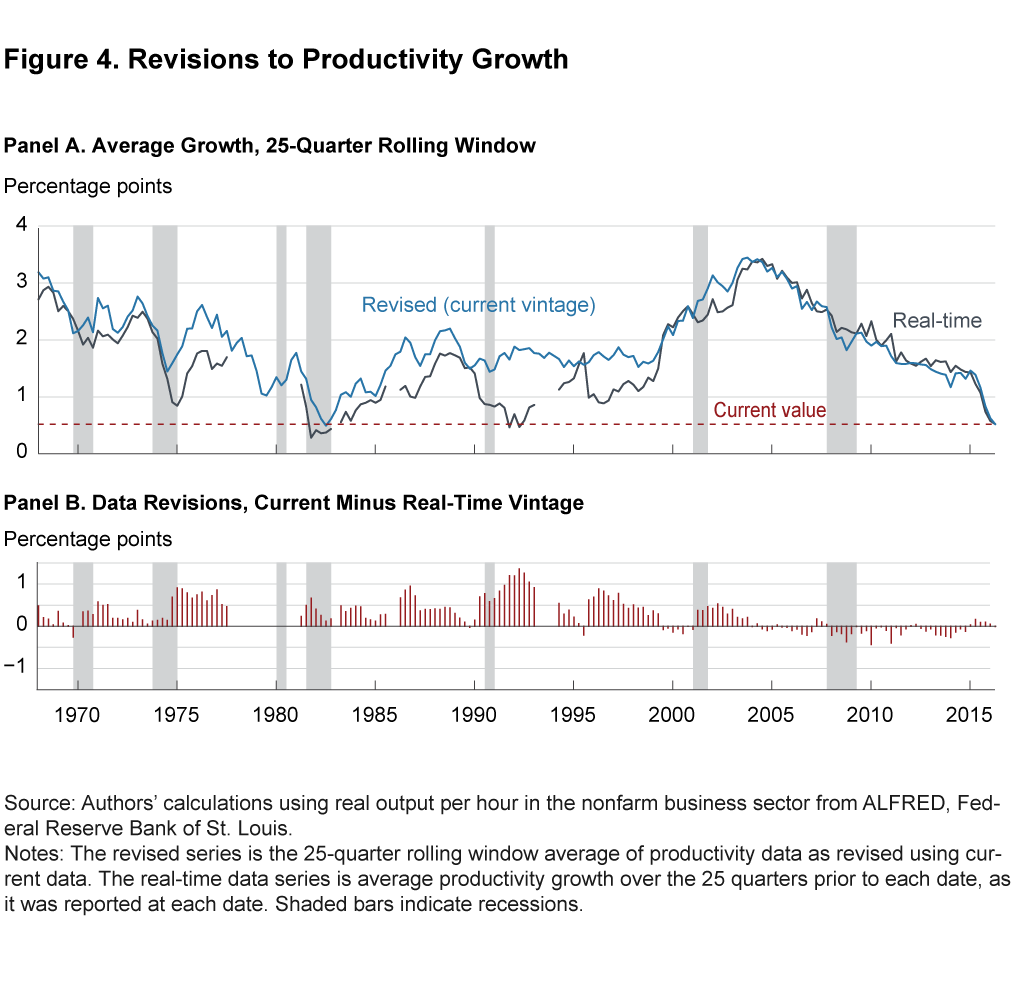
Analyzing the real-time data brings to light a second, and more recent, data point in which productivity growth was thought to be as weak as it is currently. Though not visible from the fully revised data, average productivity growth was believed to be as low as it is currently in the first and second quarters of 1992. Remarkably, these same quarters had the largest positive revisions to their 25-quarter growth rate in the entire sample. To put it another way, the real-time inference about productivity growth was never more wrong (to the pessimistic side) than it was the last time average productivity looked like the recent data.
Examining the Pattern of Revisions
From the revision data shown in panel B of figure 4, it is evident that, historically, revisions have been overwhelmingly likely to be positive. To quantify this relationship, we can directly compare the initial, real-time estimate of productivity growth to the revision based on the current data (mathematically, the current estimate of each period’s productivity growth minus the estimate from the real-time data). Figure 5 shows this relationship in the form of a scatterplot and a linear regression line, with real-time 25-quarter productivity growth along the horizontal axis and the size of the total revisions to that same period along the y axis.16 The negative relationship between the two variables is evident in the figure and the fitted linear relationship; it turns out that the first quarter of 1992 is simply the most extreme example of a general relationship in which the lower a period’s productivity growth is assessed to be in real time, the larger and more positive the typical revision turns out to be. Unusually low growth rates in the preliminary data are associated with unusually large positive revisions.
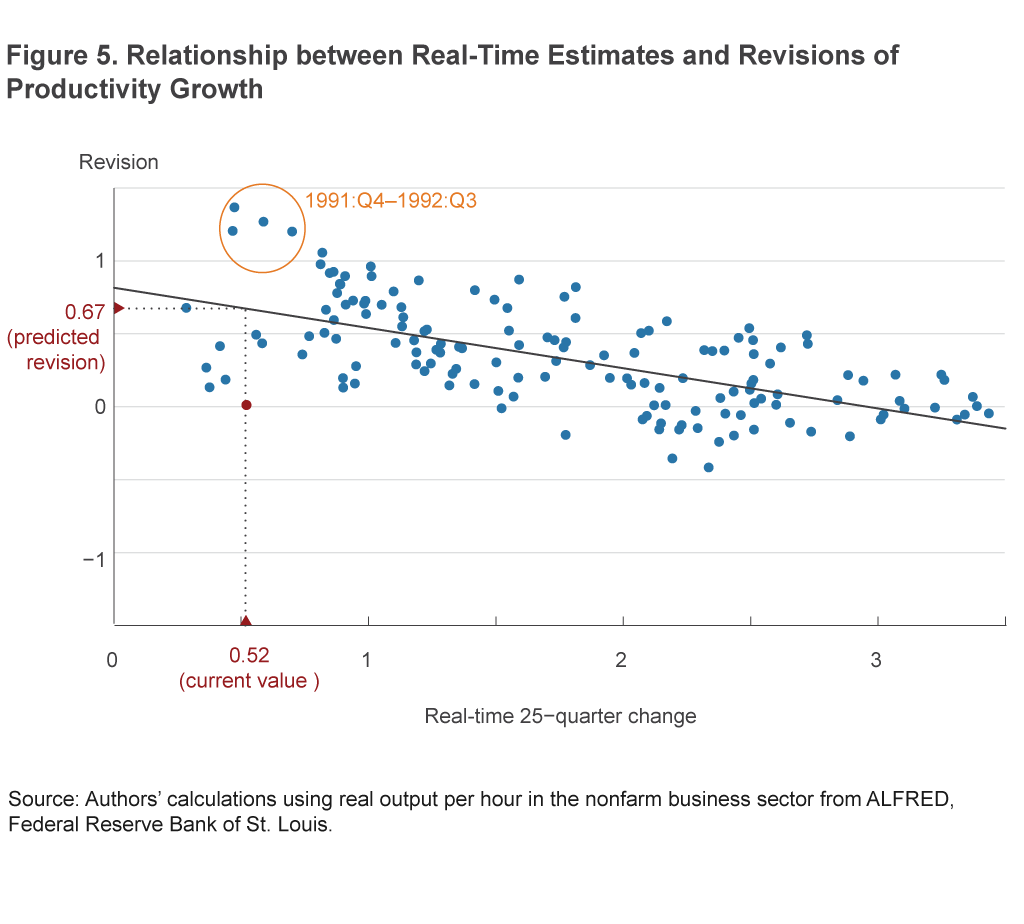
The coefficients defining the regression line quantify the average relationship between these two series. We can use the coefficients to generate a prediction of how the current productivity data are most likely to be revised. Based on the current 25-quarter average value of 0.52, the regression line says that we should expect an upward revision of 0.67 percentage points to the average growth rate, a revision which would more than double the currently reported rate of productivity growth to a value of 1.19 percent. While we would still expect recent productivity to be below the average value over the sample (roughly 2 percent), a value of 1.2 percent would be far less alarming.
While we cannot know for certain how the current data will be revised, patterns in past real-time data and their subsequent revisions provide a basis for quantifying the distinct possibility that the recent weakness in productivity is partially a mirage.
Conclusion
The recent productivity data are unambiguously weak, but they are not greatly out of line with productivity variation over the historical record. Indeed, we find two reasons for optimism in the historical productivity data. First, when labor productivity has been weak in the past, it did not persist at those levels. Second, examination of real-time productivity data and the pattern of their revisions reveals a systematic tendency to understate growth in real time. This evidence suggests that some caution is warranted in using the recent productivity growth to conclude that the United States has entered a permanent “new normal.”
Footnotes
- The choice of the lowercase r follows a convention that real interest rates are denoted as a lowercase r while nominal rates are the capital letter R. Return to 1
- For example, see Brainard (September 12, 2016), Fischer (October 17, 2016), and Blinder (2015). Return to 2
- Even if trend productivity has stayed the same, slower growth in population by itself implies an r* lower than it has been historically. Return to 3
- Expansion of the capital stock on a per-unit-of-labor basis is sometimes known as “capital deepening.” More or less the same view as “exhaustion of gains from the internet and technology booms” is sometimes described as diminishing gains from capital deepening. Return to 4
- See https://www.stlouisfed.org/from-the-president/commentary/2016/new-characterization-outlook-economy. Return to 5
- See http://www.wsj.com/articles/silicon-valley-doesnt-believe-u-s-productivity-is-down-1437100700. Return to 6
- See chapter 1 in Herbst and Schorfheide (2016). Note that in this model r*, γ, and β have the interpretation of quarterly rates, and r* and γ are gross growth rates. Return to 7
- FRED mnemonic OPHNFB (https://fred.stlouisfed.org/series/OPHNFB). Return to 8
- 2010:Q1 to 2016:Q2 entails 26 quarterly observations on levels of productivity and thus 25 observations on first differences of the levels, which is the basis of the growth rate calculation. Return to 9
- We make available a supplementary document containing 31 different versions of the analogue to figure 4, one figure for each choice of window length from 20 quarters (5 years) to 50 quarters (the length of the post-2005 period). Return to 10
- The relevant labor productivity data exist back to 1947:Q1. We focus on the period from 1968:Q1 onwards because that is where the historical record of real-time data begins, data which are the core of our analysis in the next section. Return to 11
- For example, Jacobs and van Norden (2016) highlight the changes of measuring output as GDP rather than as GNP and using chain-weighted indices rather than fixed-weighted indices. Return to 12
- See Aruoba (2008). Return to 13
- A recent academic paper about the large revisions to productivity data, Jacobs and van Norden (2016), points out that “data revisions are surprisingly important, with 80 percent confidence intervals that are larger than the mean annual growth rate of productivity and noise/signal ratios in the range of 0.5–1.0.” Return to 14
- ALFRED mnemonic is OPHNFB (https://alfred.stlouisfed.org/series?seid=OPHNFB). Return to 15
- The set of observations used in this analysis excludes the observations from 2010:Q1 onwards since those observations have not had ample time to receive revisions. Return to 16
References
- Aruoba, S. Boragan, 2008. “Data Revisions Are Not Well Behaved.” Journal of Money, Credit, and Banking, 40(2–3): 319–340.
- Blinder, Alan, 2015. “The Mystery of Declining Productivity Growth,” The Wall Street Journal, op-ed (May 14).
- Brainard, Lael, 2016. “The ‘New Normal’ and What It Means for Monetary Policy.” Speech at the Chicago Council on Global Affairs (September 12).
- Fischer, Stanley, 2016. “Why Are Interest Rates So Low? Causes and Implications.” Speech at the Economic Club of New York (October 17).
- Herbst, Edward P., and Frank Schorfheide. Bayesian Estimation of DSGE Models. Princeton University Press, 2016.
- Jacobs, Jan P.A.M., and Simon van Norden, 2016. “Why Are Initial Estimates of Productivity Growth So Unreliable?” Journal of Macroeconomics, 47: 200–213.
Suggested Citation
Bognanni, Mark, and John Zito. 2016. “New Normal or Real-Time Noise? Revisiting the Recent Data on Labor Productivity.” Federal Reserve Bank of Cleveland, Economic Commentary 2016-16. https://doi.org/10.26509/frbc-ec-201616
This work by Federal Reserve Bank of Cleveland is licensed under Creative Commons Attribution-NonCommercial 4.0 International

