

- Share
An Assessment of the ISM Manufacturing Price Index for Inflation Forecasting
The Institute for Supply Management produces a measure of pricing trends, the manufacturing price index or ISMPI, that is constructed from its periodic surveys of purchasing and supply executives. We investigate this measure’s predictive content for producer and consumer price inflation by assessing its ability to improve inflation forecasts for three broad monthly inflation measures. We find that the ISMPI has some predictive content for producer prices but not for consumer prices.
The views authors express in Economic Commentary are theirs and not necessarily those of the Federal Reserve Bank of Cleveland or the Board of Governors of the Federal Reserve System. The series editor is Tasia Hane. This paper and its data are subject to revision; please visit clevelandfed.org for updates.
One of the timeliest inflation indicators available is the price index released as part of the monthly Manufacturing ISM Report on Business, which we will refer to as the ISMPI.1 For instance, the release of ISMPI data precedes the release of the consumer price index and the personal consumption expenditures price index by roughly 2 and 4 weeks, respectively. The ISMPI is a measure of pricing trends constructed from a survey of a nationwide sample of purchasing and supply executives, in which respondents are asked whether they see the prices of their inputs as increasing, decreasing, or staying the same over the month.2
There are reasons to think that the ISMPI could have predictive content for producer and consumer price inflation. To the extent that there are cyclical movements in inflation, some sectors, such as manufacturing, might show them before the broader consumer and producer price indexes. Furthermore, to the extent that the surveyed manufacturers are largely producing inputs to other goods, one might expect the increasing price pressures they face to show up in the markups they charge to producers at the next link in the production chain and so on before goods are finally sold to consumers. For example, in the most basic version of benchmark macroeconomic models, consumer prices are a fixed “mark-up” over the prices charged by intermediate goods producers.3
However, attractive though the theoretical link between manufacturing prices and broader inflation measures might be, it could instead be the case that the particular construction of the ISMPI differs so much from that of broader inflation measures that the ISMPI ultimately provides more “noise” than “signal” for broader inflation measures.4 Ultimately, the question of whether or not the ISMPI contains useful information for forecasting broader inflation aggregates is an empirical one, and one which has seen little examination to date.5 In this article we take a step toward examining the ISMPI’s information content by assessing its ability to improve inflation forecasts of up to 12 months ahead for producer and consumer prices as measured by three broad monthly inflation measures:6
- Producer price index (PPI) for intermediate processed goods
- Personal consumption expenditures price index (PCEPI)
- Core PCE price index, the PCEPI excluding food and energy (core PCEPI)
We focus on these three inflation aggregates for the following reasons. The ISM emphasizes the predictive capacity of the ISMPI for the PPI for intermediate goods, and, at a minimum, one would hope to find predictive capacity here. The PCEPI is the Fed’s preferred inflation measure for assessing achievement on its stated inflation target and the core PCEPI is a widely used proxy for the trend in the PCEPI. The possibility that predictive content could pass through to these more widely tracked inflation measures follows from the input–output-markup mechanism described above.
As a preview of the results, we will find that the ISMPI has some predictive content for producer prices; however, this property appears not to pass through to predictive content for consumer prices.
Quantitative Relationships to Broader Inflation Measures
In addition to the conceptual arguments mentioned above, a first-pass at the quantitative evidence suggests that the ISMPI could have predictive capacity for broader inflation measures. Figure 1 plots the time series of the ISMPI along with each of the inflation measures, each of which has been standardized to best match the scaling of the ISMPI.7
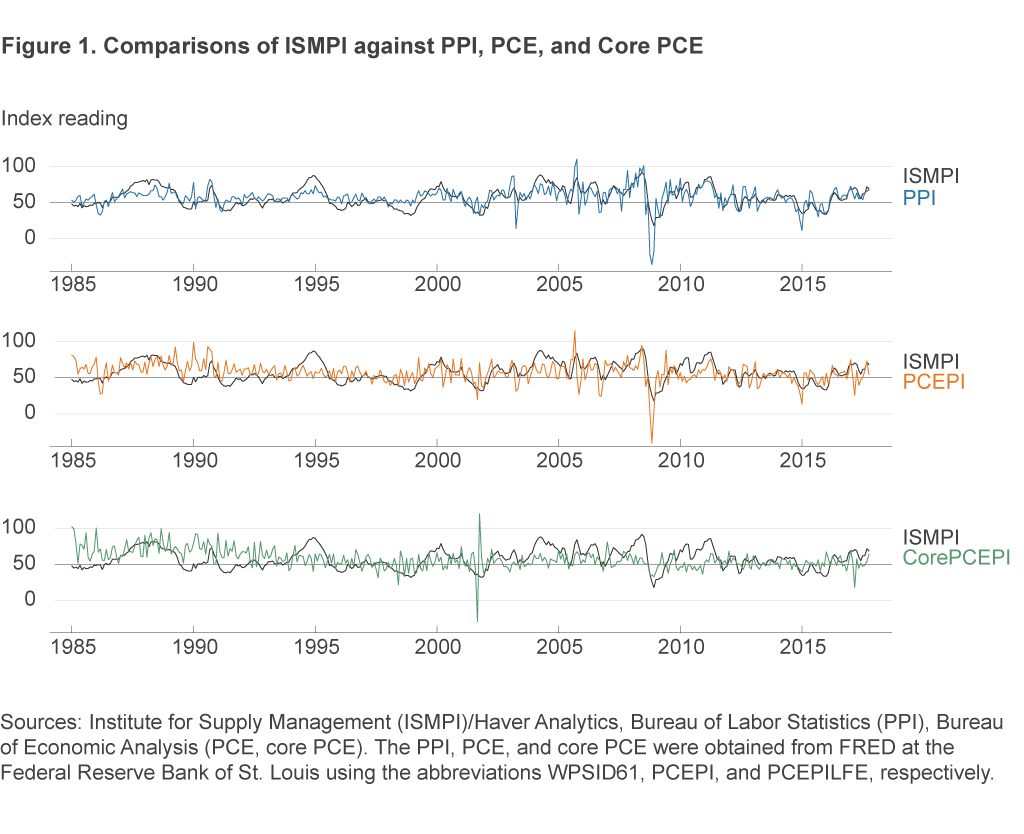
While the relationships contain plenty of noise from one month to the next, some degree of a positive historical relationship between the ISMPI and each of the inflation measures is visually apparent, particularly from 2000 onwards. Using the eyeball test, one might reasonably say that the relationship to the ISMPI appears closest for the PPI, less close for the PCEPI, and almost pure noise for the core PCEPI, and, indeed, quantifying the relationships by computing correlations yields that conclusion.
Figure 2 plots the correlation between the ISMPI and each of the inflation measures, with the ISMPI taken at leads and lags of up to 12 months.8 Each line traces out the values of the computed correlations at the different leads and lags for a given inflation indicator. The values along the horizontal axis indicate the relative timing of the ISMPI to the inflation indicators, with negative numbers indicating a lead of the ISMPI value relative to the inflation indicator. The value of 0 along the horizontal axis of the figure shows the contemporaneous correlation between the ISMPI and each inflation measure, while at a value of –3 the figure shows the correlation of the ISMPI’s value at 3 months prior to the inflation indicators. Substantial positive values for a given line in the left half of the figure would then indicate a systematic positive relationship between the ISMPI and later values of the inflation indicator and thus the potential for predictive capacity in the ISMPI for that indicator.
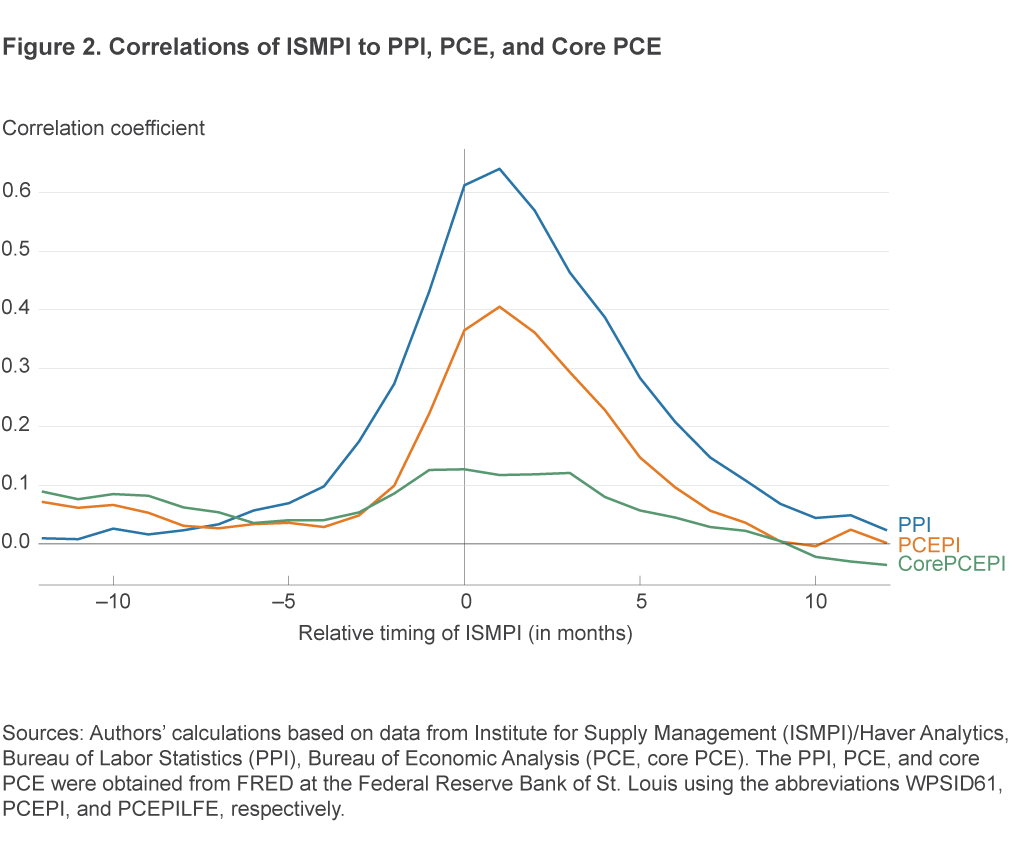
As it happens, the ISMPI indeed does have a substantive positive leading correlation with broader inflation measures, most significantly the PPI but also the PCEPI. The ISMPI two months ahead has correlations of 0.27, 0.10, and 0.09 with the PPI, PCEPI, and core PCEPI, respectively, and, at one month ahead, correlations of 0.43, 0.22, and 0.13. These correlations are not overwhelmingly strong, but nor are they negligible, and they suggest the potential for the ISMPI to contain useful information about near-term inflation.
Assessing the Predictive Content
Building on the results in the previous section, we assess the predictive content of the ISMPI in the context of forecasting models. Research has shown that the persistence of inflation means that past inflation has substantial predictive value for future inflation. For evaluating other predictors, such as the ISMPI, it is common to set up models that embed this idea and then to add the other indicators to see if they improve predictions.
To be more specific, we consider forecasting regressions for average inflation rates of each price index over horizons from 1 to 12 months ahead, with the annualized average inflation rate over the next h periods denoted as πt,t+h.9 The regressions include the value πt−12,t among the predictors, or the inflation rate during the last year, and the value of the ISMPI at time t, ISMPIt. Thus the regressions take the form
(1) πt,t+h = b0 + bπ × πt − 12,t+ + bISM × ISMPIt + et.
The coefficients b0 , bπ, and bISM are values to be estimated from the data. The coefficient b0 is a constant term that reflects the long-run mean of the inflation rate being forecasted, the coefficient bπ gives the effect of a 1 percentage point increase in the average inflation rate over the last year, and the coefficient bISM gives the effect of a one-unit increase in the ISMPIt on the inflation forecast. At each point in time, the forecasts are constructed from the relationship in equation (1) by first estimating all of the b coefficients from historical data and then plugging in the observed values of the data for the inflation rate, πt−12,t, and the ISMPI, ISMPIt .
Data, Estimation, and Forecast Evaluation
In model-based forecasting exercises, choices must be made about which observations to use for the estimation of the econometric models’ parameters and about which observations to use for evaluating the accuracy of each model’s forecasts. We chose the samples by following standard choices in the literature: The estimation of our forecasting models uses data beginning in January 1960, and the forecasting evaluation begins with forecasts from January 1985 and running to October 2017.10
The forecasting exercise is recursive and pseudo-real time. This means that beginning with January 1985, we estimate the parameters of each model and produce forecasts for each forecasting horizon. Moving to the next month, February 1985, we then re-estimate the parameters of all models in light of the additional data point that has become available and produce forecasts, and so on, proceeding one month at a time until the end of the sample.11 With more than 30 years of monthly data in the forecast evaluation sample and 12 different forecasting horizons for each of three distinct inflation indicators, this exercise entails roughly 13,000 separate model estimations.
Having tabulated the forecasts, we assess each model’s forecast accuracy on the basis of root mean squared prediction error (RMSPE). The RMSPE is a standard forecast evaluation metric that penalizes forecasts for how far away they are from the realized value of the forecasted variable. Hence, better forecasting models have smaller RMSPEs, with zero as the best possible value of RMSPE. RMSPE is calculated as
(2) ![]()
wherein the term ![]() is the realized value of the annualized average inflation rate for indicator j over the period from t to t+h, and
is the realized value of the annualized average inflation rate for indicator j over the period from t to t+h, and ![]() is the forecasted value of that inflation rate.
is the forecasted value of that inflation rate.
Forecasting Results
Figure 3 shows the forecasting results. Each panel shows, for a single inflation indicator, the results for all forecasting horizons from both the model with, and the model without, the ISMPI.
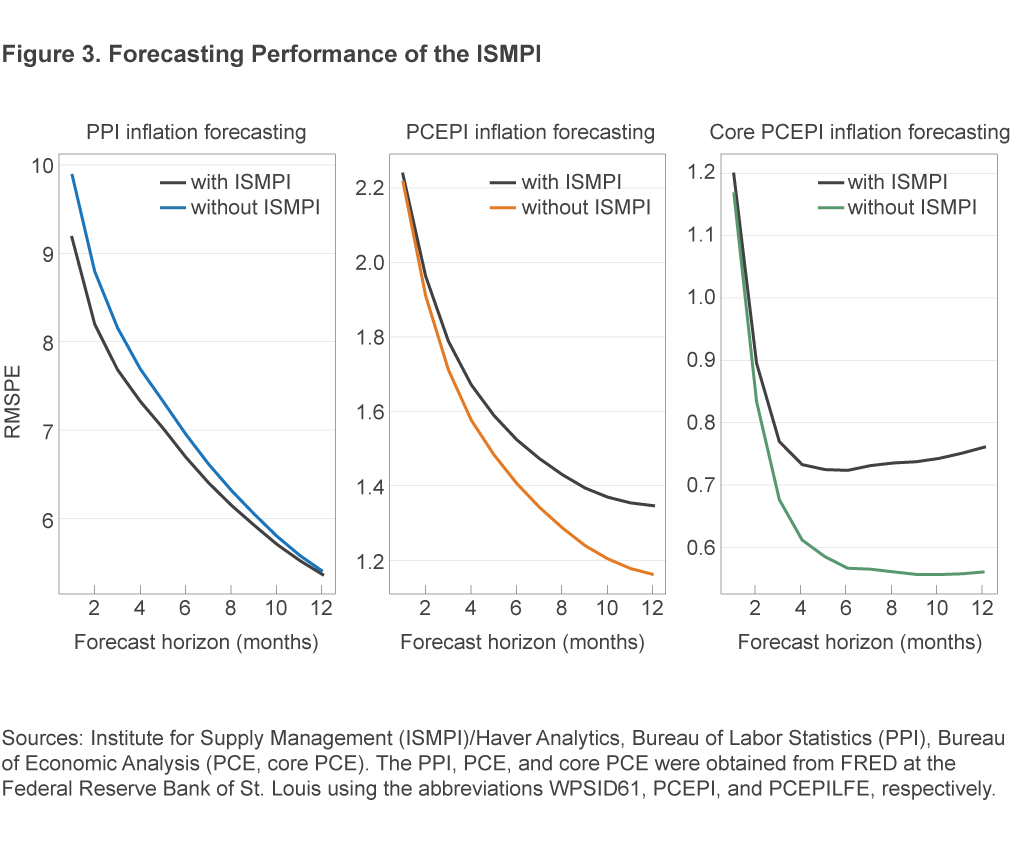
The vertical axis in each panel shows the RMSPE from the forecasting model for annualized average inflation at horizon h indicated by the value on the horizontal axis. The values connected by a line in a given plot are the RMSPEs of the models that include the same set of predictors, namely, the ISMPI or not. Hence, whenever the line representing the models that include the ISMPI lies below the line for models without, this means that the ISMPI improves forecast accuracy relative to the benchmark model.
From the plots, we can see that the ISMPI improves forecast accuracy for the PPI and does so primarily at forecasting horizons of less than 6 months. Specifically, the RMSPE for forecasting PPI inflation falls by 0.72 (roughly a 7 percent smaller RMSPE) relative to the benchmark model when forecasting inflation one month ahead. The 0.72 unit improvement can be seen graphically in figure 3 as the vertical distance between the two lines in the “PPI inflation forecasting” panel. The gains then decline smoothly through the maximum forecasting horizon of 12 months, at which point the gains are virtually 0. On the other hand, the models with the ISMPI forecast PCE inflation and core PCE inflation more poorly than the models without. Forecasts for PCE inflation and core PCE inflation are virtually identical with and without the ISMPI at the one- and two-month horizons, but the extent to which the ISMPI models forecast more poorly than their benchmarks in terms of RMSPE units steadily increases to 0.19 (a 16 percent greater RMPSE) and 0.20 (a 36 percent greater RMSPE) at the 12-month forecasting horizon for PCE inflation and core PCE inflation, respectively.
Note that in any exercise such as this one, there is a question of how confident one can be that the results are not, in some sense, the result of randomness. Even if two models have, on average, equal predictive capacity, in any finite sample of data one model will likely outperform the other. In the context of the results from other forecasting exercises on macroeconomic data, the gains for the short-term PPI inflation forecasts would be near the boundary of gains that would be considered statistically significant, while the differences for PCE inflation and core PCE inflation are likely insignificant.
One might wonder how the inclusion of an extra predictor could worsen the average forecast. This is where the recursive estimation out-of-sample forecasting procedure is key. If the extra indicator lacks a stable relationship with the forecasted variable, then the repeated estimations will yield fluctuations in the estimated value of bISM when new data become available. The fluctuations in bISM will create instability in the forecasts from one period to the next and deteriorate average accuracy. In this fashion, the RMSPE penalizes the inclusion of additional predictors whose relationship to the forecasted variable turns out to be unreliable.
Robustness
We assess the robustness of the results in the previous section to two alternative forecasting specifications in which, rather than using the most recent value of the ISMPI as a predictor, the average value of the ISMPI over the previous 3 months or 6 months is used as a predictor. Figure 4 shows the RMSPEs from these additional models, along with the benchmark model that excludes the ISMPI.
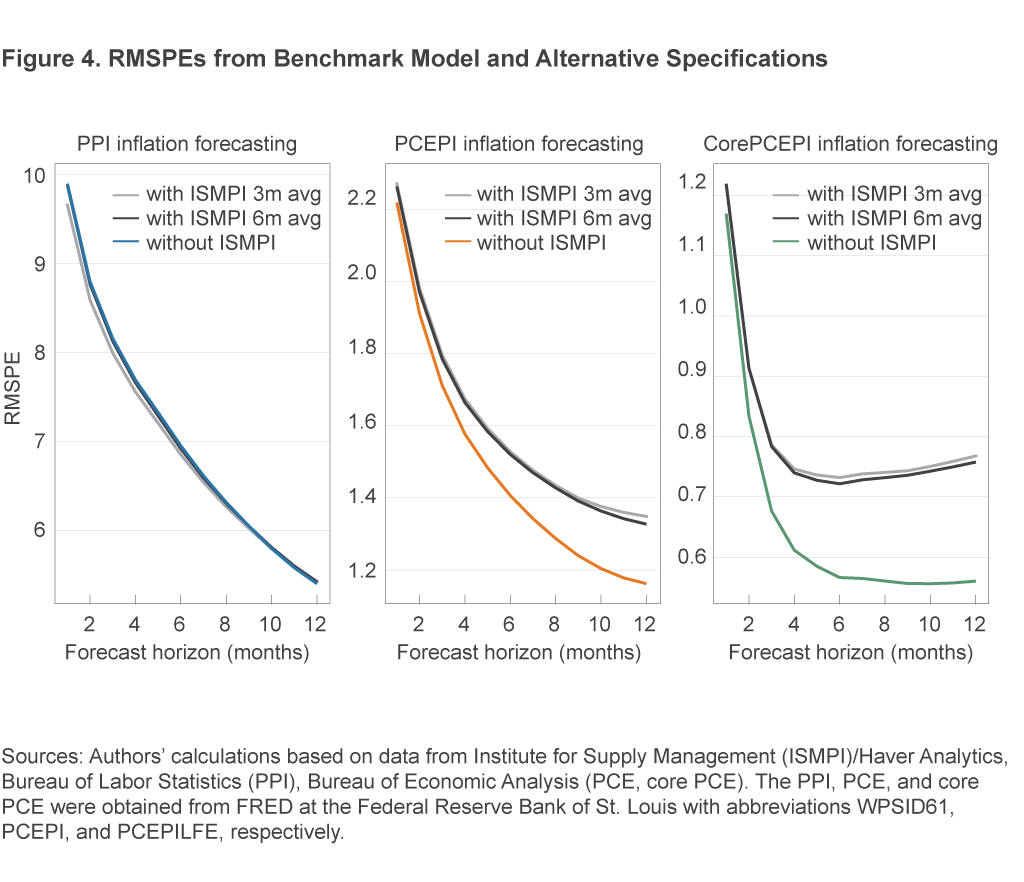
One can see that the results from the two additional models are almost identical to each other; indeed, the lines are difficult to distinguish. The results are also similar to those from the model in the previous section: The inclusion of the ISMPI yields small forecasting gains for the PPI at shorter horizons, though not for PCE inflation and core PCE inflation. The results from the robustness exercise allow us to be more confident that our main results from the previous section are not a fluke resulting from our particular choice of how to use information from the ISMPI in the forecasting regressions.
Conclusion
In this article, we examined the relationship between the ISMPI and broader inflation aggregates. We documented positive correlations between the ISMPI and inflation in the PPI, PCE price index, and core PCE price index. To further explore how these relationships might be used by policymakers, we examined the performance of forecasting regressions with and without the ISMPI among their set of predictors. Looking at the predictive content for annualized average inflation rates over forecasting horizons from 1 to 12 months, we found that the ISMPI improved forecasts of PPI inflation, particularly at shorter horizons. The ISMPI did not yield improved forecasts of PCE inflation or of core PCE inflation.
Footnotes
- The Institute for Supply Management makes the most recent value of the ISMPI available on its website, along with supporting commentary. For the empirical work in this article, we make use of historical values dating back to January 1960, accessed through Haver Analytics. Return
- The way these survey responses are aggregated yields a quantitative measure known as a diffusion index: The index’s reading in a given month is calculated as the percent of “increasing” responses plus one-half of those responses indicating that prices stayed the same. Readings above 50 then indicate that more respondents see prices increasing than decreasing. Return
- See, for example, the small-scale model in An and Schorfheide (2007). Return
- See Clark (1995) for a thorough discussion of similar points regarding why producer prices may or may not help to predict consumer prices. Return
- One recent exception is Armen and Koenig (2017), who examine the ISMPI’s usefulness for inferring the current quarter’s inflation rate, an exercise sometimes referred to as “nowcasting.” Return
- These series are available from the FRED database maintained by the Federal Reserve Bank of St. Louis, which classifies them according to the abbreviations 1) WPSID61, 2) PCEPI, and 3) PCEPILFE. Return
- The inflation indicator is first de-meaned and divided by its sample standard deviation. The resulting series is then multiplied by the standard deviation of the ISMPI and finally the mean of the ISMPI is added. Return
- We compute the correlations over the period from January 1985 to the present; the same period is used for forecast evaluation. Return
- The value πt,t+h is constructed from the underlying price index values of Pt+h and Pt as πt,t+h = 100 × (12/h) × log(Pt+h /Pt ). Return
- These are the dates used in “Forecasting Inflation” in the Handbook of Economic Forecasting by Faust and Wright (2013). Return
- Estimation and forecast evaluation both use currently available data. In addition to choosing the estimation and forecasting evaluation periods, a subtle decision that one must also make regards which observations to take as the truth when assessing the accuracy of forecasts. The reason that researchers face a choice at all along this dimension is that, like many macroeconomic time series variables, aggregate inflation measures are subject to revisions both in the short term and many years after the data were first released. We use currently available data in light of limitations in the available “real-time” data on core PCE prices. Data revisions could yield slightly different results, though such results are usually weaker than those obtained from using the currently available, fully revised data. Return
References
- An, Sungbae, and Frank Schorfheide. 2007. “Bayesian Analysis of DSGE Models,” Econometric Reviews, 26:2-4, 113–172, DOI: 10.1080/07474930701220071.
- Armen, Alan, and Evan F. Koenig. 2017. “Getting a Jump on Inflation,” Economic Letter, 12:9, 1–4.
- Clark, Todd E. 1995. “Do Producer Prices Lead Consumer Prices?” Federal Reserve Bank of Kansas City, Economic Review (August 1).
Suggested Citation
Bognanni, Mark, and Tristan Young. 2018. “An Assessment of the ISM Manufacturing Price Index for Inflation Forecasting.” Federal Reserve Bank of Cleveland, Economic Commentary 2018-05. https://doi.org/10.26509/frbc-ec-201805
This work by Federal Reserve Bank of Cleveland is licensed under Creative Commons Attribution-NonCommercial 4.0 International

