

- Share
Household Formation and the Great Recession
During the Great Recession, the rate at which Americans formed households fell sharply. Though the rate has recently picked up, it isn’t fast enough to make up for the shortfall in household formation that occurred over the last several years. An analysis of recent household formation patterns shows that the greatest shortfall occurred among young adults and that it is related to weak economic conditions. Housing choices have shifted as well, with a greater proportion of young households living in rental housing rather than owner-occupied homes.
The views authors express in Economic Commentary are theirs and not necessarily those of the Federal Reserve Bank of Cleveland or the Board of Governors of the Federal Reserve System. The series editor is Tasia Hane. This paper and its data are subject to revision; please visit clevelandfed.org for updates.
One impact of the Great Recession is that it markedly reduced the rate at which Americans set up households. Compared to the previous 10 years, the growth rate in the number of households was cut by two-thirds between 2007 and 2010. This slowing in household formation reflects the overall weak economy, but it has also negatively impacted the housing market, as lower household formation rates reduce housing demand.
This Commentary documents the shortfall in household formation experienced over the recent cycle, focusing in particular on the decline in household formation rates for younger adults. While younger adults between the ages of 18 and 34 make up a relatively small proportion of heads of households, they account for almost three-quarters of the overall shortfall in household formation. Household formation rates in this younger cohort were related directly to economic conditions. The growth in the number of younger households was lower in metropolitan areas that experienced weaker labor and housing markets, though, to be sure, household formation slowed across the United States, consistent with the widespread nature of the shocks to output, labor, and housing markets that occurred during the Great Recession.
Household Formation Rates
From 1997 to 2007, about 1.5 million households were formed on average each year in the United States. Then the Great Recession hit, and in the ensuing three years, the rate fell to 500,000 per year. This decline in household formation occurred even as the U.S. population was expanding at a rate of 2.7 million per year, only slightly below the rate of 2.9 million a year observed between 1997 and 2007. A modest rebound has since followed during the economic recovery, with 1.1 million new households being created in 2011.1
It is important to distinguish between changes in household formation due to demographics and those due to other factors such as the recession. In the former case, one might expect some changes in household formation as the population ages or shifts across geographic locations.
Recessionary forces, meanwhile, will reduce household formation. For example, younger people may be less willing and able to strike out on their own and more likely to remain living with their parents or in other situations, as employment prospects are diminished. The specific nature of the recent recession—with its bursting of the housing bubble—added another complication by tightening lending standards, which reduced access to mortgage credit for a range of borrowers. This may have increased the incentive of individuals to delay household formation in order to save for a down payment, build credit histories, or repair tarnished credit scores. Moreover, the recession forced some existing households to dissolve and combine with other households.
In order to estimate the shortfall in household formation, a basic model of household formation is estimated that controls for demographic and location variables including age, gender, race, ethnicity, foreign-born status, and the state of residence. The model is estimated on pre-recession data and then used to predict the number of households from 2008 to 2011, based on the distribution of demographic and individual characteristics that are present in each year’s data and the size of the population.
This approach allows us to construct an estimate of the number of households based on the patterns of household formation observed prior to recession, adjusting for the overall changes in population for specific demographic groups.
One additional adjustment needs to be included to account for changes in the overall population that might have occurred absent the deep recession. In particular, the Census Bureau reports that net immigration slowed during the recession, compared to prior years. Our approach adjusts upward the observed growth in the foreign-born population to compensate for the slowing of immigration during the recession. (This issue is analyzed in detail by George Masnick, Daniel McCue, and Eric Belsky in their recent study, “Updated 2010–2020 Household and New Home Demand Projections.”)
Two data sets from the Bureau of the Census are used to estimate the shortfall in household formation—the Current Population Survey (CPS) and the American Community Survey (ACS). The March CPS is used to construct the Census Bureau’s annual estimate of the number of U.S. households, seen in figure 1. (The data in figure 1 differ slightly from the data reported in the Census Bureau’s HH-1 table, as the data in the table are smoothed over time.)
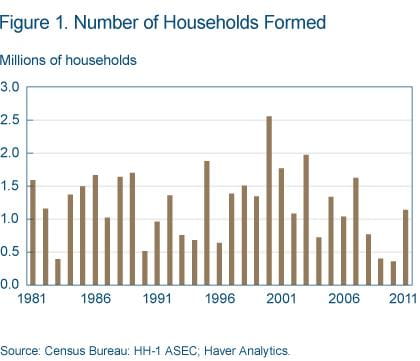
Source: Census Bureau; HH-1 ASEC; Haver Analytics.
The CPS has a long history, which allows analysts to look at household formation over many decades and to construct interyear estimates of changes in the number of households. The ACS is a more recent survey of households, which is carried out annually. Its advantage is that its sample size is much larger, which allows for more precise analysis within demographic groups and enables researchers to look across a wide range of geographical units (that is, states, metropolitan areas, and cities). Its disadvantage is that it is currently only available through 2010.
Using the CPS data, the analysis shows that the gap between the actual number of households and the estimated number of households from the model grew steadily from 2007 through 2010. By 2011, the end of the analysis period, the gap stood at 2.6 million households, with almost the entire shortfall in place by 2010 (table 1). The data from the ACS indicate a similar-sized gap opening over the period.
| Households, millions (CPS) | Shortfall, millions (CPS) | Shortfall, millions (ACS) | |
|---|---|---|---|
| 2007 | 115.9 | — | — |
| 2008 | 116.7 | 0.6 | 1.1 |
| 2009 | 117.1 | 1.7 | 1.9 |
| 2010 | 117.4 | 2.5 | 2.6 |
| 2011 | 118.6 | 2.6 | n/a |
Source: Census Bureau, Current Population Survey, American Community Survey: Integrated Public Use Microdata Series (18 years and older); author’s calculations.
An alternative way to think about the shortfall in household formation is to look at changes in what economists call the headship rate. The headship rate is the probability that a person is the head of a household. In our data, the shortfall in household formation is due largely to the fact that the likelihood of being the head of a household in the United States fell over the period in question from 52.0 percent to 51.3 percent (table 2), a decline of 1.3 percent.
| All age groups, percent | Adults aged 18 to 34, percent | |
|---|---|---|
| 2007 | 52.0 | 37.9 |
| 2008 | 51.9 | 37.4 |
| 2009 | 51.6 | 36.9 |
| 2010 | 51.2 | 35.9 |
| 2011 | 51.3 | 35.8 |
Source: Census Bureau, Current Population Survey; author’s calculations.
However, this decline in the headship rate is not uniform across demographic groups. Not surprisingly, the most affected demographic group is younger individuals, where the headship rate fell from 37.9 percent to 35.8 percent, representing a 5.5 percent decline. This group made up only 22.3 percent of all households in 2007, but it accounts for almost three-quarters of the overall shortfall in household formation over the period. That is, one would have expected 1.9 million more households to have been headed by individuals aged 18 to 34 than we actually saw created by 2011 (table 3).
| Age group | Number of households, millions | Shortfall, millions |
|---|---|---|
| 18–24 | 6.0 | 1.0 |
| 25–34 | 19.6 | 0.9 |
| 35–44 | 21.3 | 0.1 |
| 45–54 | 24.5 | −0.1 |
| 55–64 | 21.8 | 0.2 |
| 65+ | 25.4 | 0.5 |
| Total | 118.6 | 2.6 |
Source: Census Bureau, Current Population Survey; author’s calculations.
The corollary of this point is that a greater share of younger adults (aged 18–34) now lives in a household headed by their parents. This proportion moved up from 28.2 percent in 2007 to 31.0 percent in 2011, reflecting an additional 2.0 million adult children living at home. Of those younger adults who are living with their parents and who are in the labor force (either employed or unemployed), 18.2 percent were unemployed in March 2011, compared to 10.3 percent for individuals that live in other arrangements. Some of the difference in unemployment rates is due to the fact that adult children living at home are younger, but even after controlling for age there remains a large difference in the unemployment rate between the two groups. This higher rate of unemployment for younger adults living with their parents, compared to individuals that live in other arrangements, existed prior to the recession as well. The difference, of course, is that the unemployment rate is much higher in 2011 than it was in 2006 or 2007.
The overall decline in household formation rates is consistent with the weak state of the aggregate economy in 2008 and 2009. The continuation of lagging household formation in 2010 even as the economy improved modestly reflects the fact that forming new households takes time. To be sure, the CPS data do show a reasonable rebound in the growth of the number of households between 2010 and 2011, but the estimates suggest that this rebound closes none of the existing gap that opened up during the prior three years.
Not only has the likelihood of forming a household declined during this period, but the individual’s choice of housing has shifted as well, especially for younger adults. Prior to the recession about one-third of individuals aged 18-34 headed households, and of these individuals, 40 percent headed households that lived in owner-occupied housing (American Community Survey). By 2010, this ownership rate declined to 35.5 percent. The recent shift into rental housing units continued into 2011 and early 2012, and the Census Bureau’s Housing Vacancy and Home Ownership Report (2012) indicates little sign of any abatement in declining homeownership rates for younger households (figure 2). Clearly, reduced access to mortgage credit, the weak economy, and uncertainty about the path of the housing market have decreased the likelihood that young heads of household will live in owner-occupied housing today.
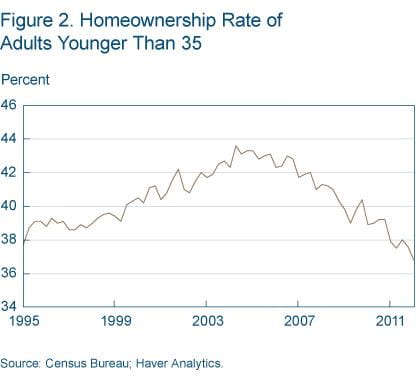
Source: Census Bureau; Haver Analytics.
Regional Variation
One question that arises naturally is whether areas of the country hit harder by the recession had lower household formation rates, especially for younger households, than areas that experienced milder shocks. This issue can be examined by correlating changes in household formation with changes in labor and housing market conditions in local areas.
For this analysis, local labor market conditions are measured using the growth in the employment-to-population ratio from 2007 to 2010 for individuals aged 18-34 in a given metropolitan area. The employment-to-population ratio is used, as opposed to the unemployment rate, because the ratio reflects all individuals in the age group, not just those in the labor force. The construction of the standard unemployment rate excludes those individuals who have left the labor force. To measure housing market conditions, the growth in home prices is constructed for each metropolitan area over the same time horizon.
The results show that changes in the employment-to- population ratio and the growth in house prices are positively correlated with household formation in the younger cohort. Weaker labor markets experienced lower household formation rates, as did housing markets with larger price declines (figure 3 and figure 4). The correlation is somewhat stronger between household formation and the labor market than household formation and house prices. The same pattern holds true for our shortfall measure—the difference between the predicted household formation rate and the actual household formation rate. Weaker labor and housing markets had larger shortfalls.
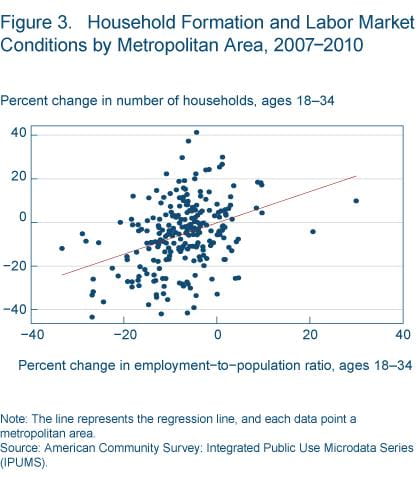
Note: The line represents the regression line, and each data point a metropolitan area.
Source: American Community Survey; Integrated Public Use Microdata Series (IPUMS).
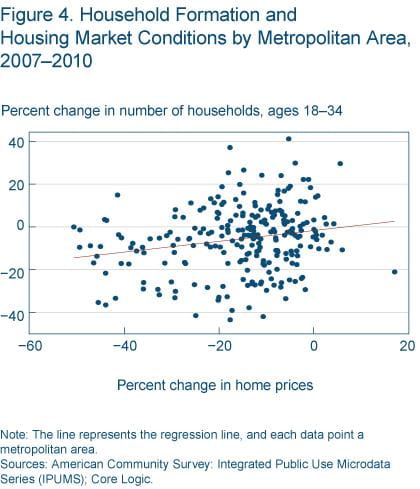
Note: The line represents the regression line, and each data point a metropolitan area.
Sources: American Community Survey; Integrated Public Use Microdata Series (IPUMS); Core Logic.
While household formation is correlated with local economic conditions, the analysis also suggests that other factors are the main drivers of lower household formation rates. In particular, the relatively modest correlations reflect the fact that the shock to the economy was aggregate in nature, lowering household formation rates across the country. This point is evident in the widespread nature of the projected shortfall in formation, which is present in 45 out of the 50 states.
The states and metropolitan areas of the Fourth District also experienced a shortfall in household formation from 2007 to 2010. In 2010, the estimated gap between the actual number of households and the model’s predictions stood at 1.6 percent. This resulted in a projected shortfall of roughly 200,000 households in the Fourth District states of Kentucky, Ohio, Pennsylvania, and West Virginia. This estimated shortfall was less than the rate observed in the rest of the nation (2.1 percent) over the same period.
Young cohorts also accounted for a disproportionate share of the shortfall seen in household formation in Fourth District states, making up three-quarters of the gap in household formation. One difference between the Fourth District states and the rest of the nation is that estimates from the 2011 Current Population Survey show that household formation rates in District states rebounded last year and closed much of the estimated gap that had opened during the recession. This is not true for the United States as a whole, as shown in table 1.
Conclusion
The shortfall in household formation observed over the 2007–2010 period is an outgrowth of the weak economy and does not reflect fundamental changes in underlying demographics. It is not unreasonable to expect that the rate will rebound further as individuals who delayed forming households during the recession and initial recovery set out on their own. The speed of the rebound will depend on the path of the aggregate economy, especially improvements in labor markets.
While such increases in household formation will certainly aid the housing market, it is an open question how increased formation will affect the relative demands for rental or single-family owner-occupied housing. The sharp decline in home ownership rates for the younger cohort shows little sign of recovering, suggesting that when young adults start forming more households, it may have a stronger impact on the demand for rental properties than owner-occupied housing over the near term.
Footnote
- The Census Bureau estimates the number of households in the United States from a number of different sources including the Current Population Survey (CPS), the Housing Vacancy Survey, the American Community Survey (ACS), and the Decennial Census. The specific estimates do not always agree on the level or the rate of household formation. This research employs the CPS and the ACS. Return
References
- “Updated 2010–2020 Household and New Home Demand Projections,” George Masnick, Daniel McCue, and Eric Belsky. Joint Center for Housing Studies, September 2010.
- Integrated Public Use Microdata Series: Version 5.0 [Machine-readable database], Steven Ruggles, J. Trent Alexander, Katie Genadek, Ronald Goeken, Matthew B. Schroeder, and Matthew Sobek, 2010. Minneapolis, Minn.: Minnesota Population Center [producer and distributor].
Suggested Citation
Dunne, Timothy. 2012. “Household Formation and the Great Recession.” Federal Reserve Bank of Cleveland, Economic Commentary 2012-12. https://doi.org/10.26509/frbc-ec-201212
This work by Federal Reserve Bank of Cleveland is licensed under Creative Commons Attribution-NonCommercial 4.0 International

