- Share
A Closer Look at Cleveland's Latest Poverty Ranking
News that Cleveland’s poverty rate is the worst in the nation—and rising—has elevated the community’s concern about conditions in the city. But a closer look at the way poverty rates are calculated suggests that all the possible causes of Cleveland’s ranking have not been fully understood.
The views authors express in Economic Commentary are theirs and not necessarily those of the Federal Reserve Bank of Cleveland or the Board of Governors of the Federal Reserve System. The series editor is Tasia Hane. This paper and its data are subject to revision; please visit clevelandfed.org for updates.
News that Cleveland’s poverty rate is the worst in the nation—and rising—has elevated the community’s concern about conditions in the city. But a closer look at the way poverty rates are calculated suggests that all the possible causes of Cleveland’s ranking have not been fully understood.
Cleveland is the poorest big city in the United States, according to the Census Bureau’s American Community Survey, with nearly a third of the city’s residents living in poverty. This news has received a lot of attention since it was first released, but unfortunately, the numbers on which it is based are easily misinterpreted.
A closer look at those numbers reveals that the clearest picture they paint is one of a region whose poor are concentrated in the central city, while the wealthier live in the suburbs. Many other cities follow the same pattern, but Cleveland’s concentration of poor residents is extreme. Only Detroit has as much poverty concentrated in the central city. Comparing cities’ poverty rates doesn’t give us much information about what Cleveland could do to improve because such comparisons are not apples to apples, as we explain below.
Another hard-to-interpret finding in the latest data is the upward trend in Cleveland’s poverty rate. Does a rising poverty rate indicate that the local labor market has deteriorated? While that could be the case for the city’s residents, other data suggest that the situation in the general metropolitan area has actually been improving. An equally plausible explanation for Cleveland’s rising poverty rate is that people are moving out of the city, and those that leave are disproportionately better-off than those that stay behind.
Poverty Rates in the City of Cleveland versus the Metro Area
To understand the causes of Cleveland’s rising poverty rate, it is important to consider the entire labor market, not just city boundaries. City boundaries are largely historical, and using them to investigate new economic trends could be misleading, especially when it comes to labor markets. Families can typically choose a place to live from a number of different cities without having to change employers, and conversely, city boundaries do not limit their job options. For instance, many people live in Cleveland but work in its suburbs—44 percent, according to the 2000 Census—and many people live in the suburbs but work in the city—twice as many, in fact, as live and work in the city.
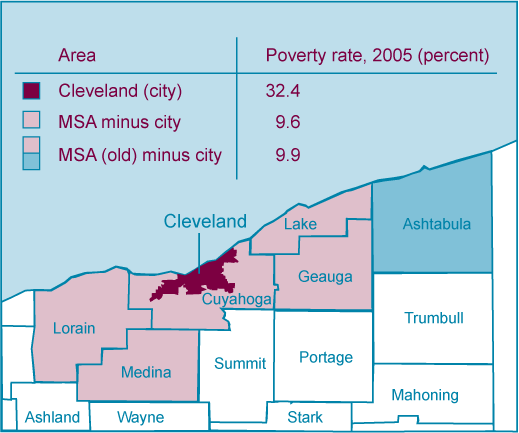
A more useful concept for studying labor markets is the metropolitan statistical area (MSA). It uses the commuting patterns of workers to determine the approximate boundary of the market. The definition of the MSA that contains Cleveland (officially the Cleveland-Elyria-Mentor, OH MSA) has recently changed to exclude Ashtabula County, but under the older definition or the newer one, poverty is far lower outside the city than inside it (figure 1).
Figure 1. Poverty Rates in the Cleveland-Elyria-Mentor, OH MSA

Looking at the poverty rate of the larger metropolitan area reveals that Cleveland is not too different from other U.S. cities. The poverty rate of the Cleveland MSA is just a little above the average for all metropolitan areas in the United States. And like other cities in the country, Cleveland’s suburbs have far lower poverty than the city itself.1
The Role of City Boundaries in the Poverty Rankings
Cleveland is far from the only city central to an MSA where suburban residents have higher incomes than residents of the city. That pattern is repeated in almost every major metropolitan area in the United States, as suburban areas offer newer, larger housing while most central cities are at best stable.
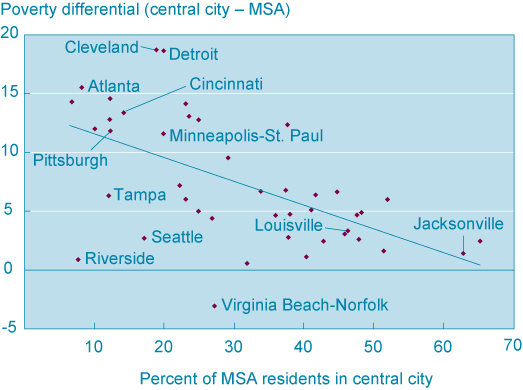
Some central cities house the majority of their metro area’s overall population while others, like Cleveland, contain only a small fraction. Specifically, Cleveland holds just 19 percent of the MSA’s population, while the average central city over 250,000 includes about 30 percent. Cities with a small percentage of the MSA’s population tend to be those that were already large (more than 250,000 residents) in the 1940s, such as Boston, Detroit, and Washington, D.C.
On the other end of the scale, some cities contain half or more of their MSA’s residents. Central city poverty rates for these cities tend to be lower (figure 2). Many have grown substantially in the last couple of decades, going from small to big city in the process, like San Antonio, Texas. Other central cities have absorbed much of the surrounding suburbs to form a unified city and county government. An interesting case is Jacksonville, Florida, which has expansive borders and includes over 63 percent of the metro area’s population. It makes little sense to compare poverty rates within the borders of cities like Cleveland and Jacksonville, where the area bounded by Cleveland’s city limits comprises little of its MSA, while that of Jacksonville’s comprises most of its MSA.
Figure 2. The Role of City Limits in Poverty Rates

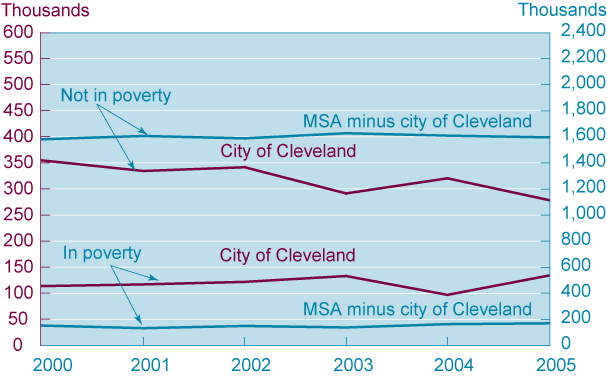
To determine whether the city of Cleveland’s rising poverty rate is the result of deteriorating labor opportunities in the area, we need to look at the labor market of the entire MSA of which it is a part and see if it is declining. And if this broader market is declining, we should see much of the rise in poverty occurring in the suburbs, because more than half of the metro area’s poor live outside the city of Cleveland. Yet the poverty rate of the metro area was relatively flat for most of the five-year period studied in the Census Bureau’s survey. In fact, the 2005 rise in metro-area poverty numbers seen in the figure is almost entirely accounted for by the increase in the number of poor people in the city of Cleveland, rather than in the suburbs. In the 2004–2005 shift that boosted the poverty rate for the MSA, for example, the number of poor people in the MSA grew by 43,522, but most of that increase occurred in the city (36,991).
Other data also suggest that the region’s labor market has gradually stabilized since the 2001 recession. The unemployment rate for the region has dropped: the city’s unemployment rate is now 7.3 percent, down from 7.9 percent three years ago. Similarly, the MSA’s unemployment rate fell from 5.9 percent to 5.6 percent over the last three years. Employment levels dipped in both the MSA and the city after the start of 2000, but have been essentially flat since 2003.
What Else Could Push Up the Poverty Rate?
If individuals who are above or below the poverty line move to new residences, it can have profound effects on poverty rates, if the shifts in residence alter the population of the city. That is what may have happened in Cleveland.
According to the American Community Survey’s figures, Cleveland’s population has declined 11.5 percent, while the total number of poor residents has increased by about 20,000 since 2000 (figure 3). Meanwhile, the number of nonpoor people fell 21 percent (74,000) in the city and rose just slightly in the rest of the MSA (1 percent). The result of this combination is a poverty rate that rises quite a bit in the city and much less so in the rest of the MSA.
Figure 3. Poverty Status

There is no way, short of following individuals with different income levels, that we could be sure that changes in residence were behind Cleveland’s increased poverty rate. But this explanation seems very consistent with the changes in poverty and residence captured in the American Community Survey and worth consideration as the community discusses its options.
An important dimension of the trend in Cleveland’s poverty rates is the high concentration of high school dropouts within the city. More than a quarter of Cleveland’s adult residents do not have a high school diploma (26 percent of those 25 and older). The rate in the suburbs is much lower (11 percent). Cleveland’s dropout population is so high partly because the city’s graduation rates are so low (just 51.8 percent for the 2004–2005 school year), but the accumulation of past generations of dropouts and their lack of mobility also increases their concentration inside the city. While new dropouts contribute a relatively small percentage to the total stock of dropouts in any place (about 2 percent per year in the case of the Cleveland Municipal School District, assuming they do not move out of city), year after year of high dropout rates adds up.
Reducing the dropout rate might be an important step in the fight against poverty among younger citizens, but it is difficult to sort out whether a poor education causes poverty or results from it, because poor kids are likely to face other disadvantages as well. For example, young people who are poor are more likely to have had out-of-wedlock children. Still, after controlling for single parenthood and race, we estimate that high school dropouts are 10 times as likely as high school graduates to slip into poverty each year.1 This is a compelling result, but it does not prove that education will necessarily reduce poverty. In an interesting paper on the subject, Philip Oreopoulos goes further and shows that compulsory schooling laws (which require kids to be in school until they reach a specific age) help boost the incomes of those affected by the laws. This is the case even though many of the problems that these low-achieving students face are likely to remain and the laws are only partially effective at keeping kids in school.
What Can We Do?
If the goal is to improve the incomes of poor people, little could be more appropriate than focusing on improving their skills so that their earnings can rise. Improving the educational outcomes of the Cleveland City Schools could boost the incomes of some of the youth who are most likely to be poor, regardless of where they live. Adding employers to the area or expanding existing firms also wouldn’t hurt, but is unlikely to quickly lower the city’s poverty rate, as these employers would tend to draw workers from the broader metropolitan area.
If the goal is to alter the city’s ranking as the poorest among the big cities, attracting and retaining moderate and middle-income households within the city limits is also critical.
Footnotes
- For consistent comparison since 2000, we add Ashtabula County to the metro area figures. So for our purposes the MSA includes Ashtabula, Cuyahoga, Geauga, Lake, Lorain, and Medina counties. Ashtabula County was dropped from the official metro area definition in 2003 and the ACS changed to this definition beginning in 2005. Return
- This estimate is based on linear probability model of individual poverty status among those aged 24 to 35 in CPS data from 1984 to 2004, after controlling for a broad range of family structures and race of the individuals. Other controls and/or periods of time can lower these estimates; however, the general result that high school dropouts are far more likely to experience poverty remains in any version we tested. Return
Mark Schweitzer is an assistant vice president and economist at the Federal Reserve Bank of Cleveland. Brian Rudick is a research assistant at the Bank.
The views expressed here are those of the author and not necessarily those of the Federal Reserve Bank of Cleveland, the Board of Governors of the Federal Reserve System, or its staff.
This work by Federal Reserve Bank of Cleveland is licensed under Creative Commons Attribution-NonCommercial 4.0 International


