

- Share
Improving Epidemic Modeling with Networks
Many of the models used to track, forecast, and inform the response to epidemics such as COVID-19 assume that everyone has an equal chance of encountering those who are infected with a disease. But this assumption does not reflect the fact that individuals interact mostly within much narrower groups. We argue that incorporating a network perspective, which accounts for patterns of real-world interactions, into epidemiological models provides useful insights into the spread of infectious diseases.


The views authors express in Economic Commentary are theirs and not necessarily those of the Federal Reserve Bank of Cleveland or the Board of Governors of the Federal Reserve System. The series editor is Tasia Hane. This paper and its data are subject to revision; please visit clevelandfed.org for updates.
The COVID-19 pandemic has ignited a resurgence of interest in models of epidemics. As the virus spread first across China, Italy, then other countries in Europe, the United States, and South America, predictions from such models demonstrated the urgent need for a response and helped to guide policies including social distancing and economic lockdowns. Similarly, as measures have taken effect and the spread of the virus has slowed, epidemiological models help guide the path back toward relaxing restrictions and reopening the economy while being aware of the risk of a second wave of infections.
There are a number of different families of models in use today, each with different advantages and disadvantages. This Commentary argues that adopting a network perspective that explicitly accounts for the structure of interactions among individuals can provide important insights regarding both the spread of a disease and the best ways to tackle it, in particular when compared to the class of SIR models, one of the most widely used modeling approaches in epidemiology.
Network models have successfully been employed in many fields to study phenomena for which interrelationships matter. In economics, these include job referrals in labor markets (Calvó-Armengol and Jackson, 2007), patterns of international trade (Chaney, 2014), the diffusion of technology (Banerjee et al., 2013), and contagion in financial markets (Elliott, Golub, and Jackson, 2014).1 In all of these areas, adopting network models has led to new perspectives and novel insights, and we argue that network models can do the same to advance our understanding of epidemics.
The Baseline SIR Model
There are many models that track the behavior of an epidemic as it infects a population. Most of these are categorical models in which individuals are categorized by disease status. A particularly prominent example of such a model is the SIR model introduced by Kermack and McKendrick (1927).2 In this model individuals are either susceptible (S), infected (I), or removed (R). Individuals start out in S and, depending on their interaction with already contagious individuals and the characteristics of the disease (such as how contagious it is), proceed to I and then R, which includes individuals who have either recovered (or are otherwise immune) or died. Other categorical models include the SIS (“susceptible-infected-susceptible”) model, in which recovered individuals can be reinfected and thus re-enter the pool of the susceptible, and the SEIR (“susceptible-exposed-infected-removed”) model, which incorporates a new health status for individuals that have been exposed to the virus and are contagious but are as yet asymptomatic. The key parameters describing the epidemic in the SIR model are the infection parameter, called reproduction number, which describes how quickly infected individuals infect others, and the recovery rate, which describes how quickly infected individuals recover and thereby stop being infectious.
Once the parameters are fixed, the flow of newly infected individuals in these models depends on both the number of already infected individuals and the number of susceptible individuals at a given point in time. In the standard SIR model, the flow from susceptible to infected is proportional to the total numbers of both the susceptible and the infected. This approach seeks to capture the idea that for a given transmissibility of a virus the likelihood of infection depends on how frequently already infected individuals interact with those who are still susceptible.
In the SIR model, a disease to which no individual has immunity (as is likely the case with COVID-19) starts with a small number of infected and a large pool of susceptible individuals. As the infection spreads among the population and the number of infected individuals increases, the rate of new infections increases rapidly while the rate of removal remains constant, causing the number of those infected to increase more rapidly.3 Without any interventions or changes in behavior, the number of new infections per day increases up to a peak and declines from then on. The decline arises from the fact that fewer and fewer susceptible individuals are found in the population, limiting opportunities for further transmission. As the number of susceptible individuals declines further and a larger share of the population is immune by having recovered, the spread of the disease will slow down and at some point begin to peter out. The large number of immune individuals then provides protection to the population, resulting in herd immunity.4
Figure 1 illustrates these infection dynamics for a simple setting with parameters based on the early COVID-19 experience.5 The top panel shows for any point in time the share of the population that is currently infected. The bottom panel shows for any point in time the share of the population that has ever been infected up that point; that is, it includes both those currently infected as well as those previously infected but now recovered.
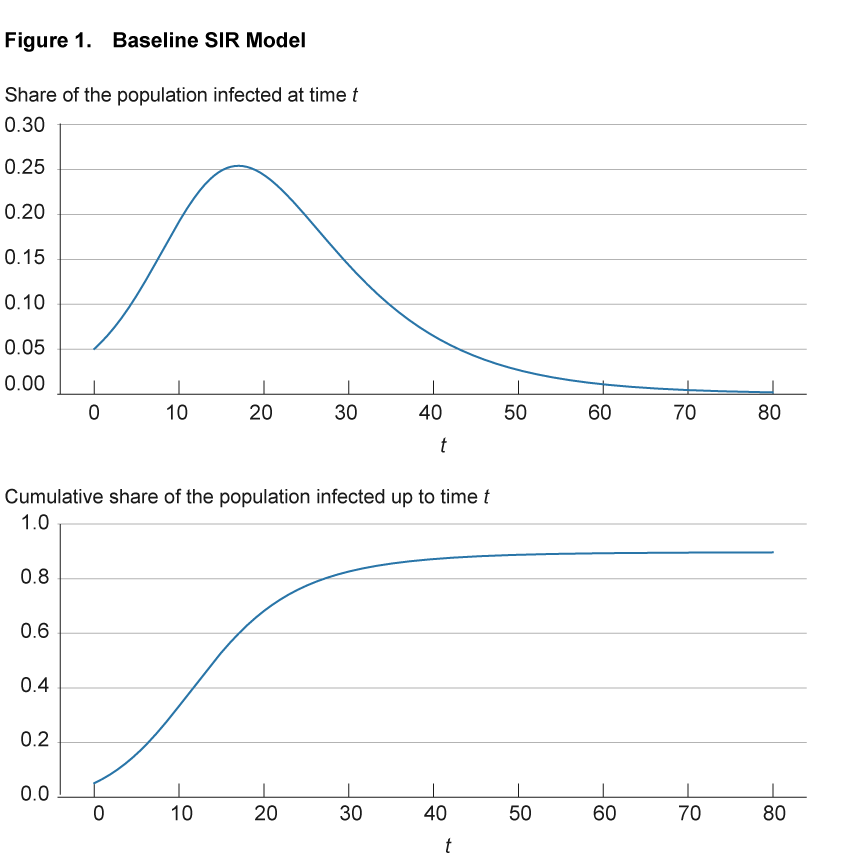
Notes: The top panel shows for any point in time the share of the population that is currently infected. The bottom panel shows for any point in time the share of the population that has ever been infected up to that point, that is, it includes both those currently infected as well as those previously infected but now recovered.
Source: Authors’ simulations.
Vaccines work in an SIR setting by protecting vaccinated individuals themselves, and by also increasing the share of immune individuals, thereby slowing down the spread of disease. If sufficient numbers are vaccinated, the population will reach herd immunity without large portions of the population ever becoming infected.
The SIR model has long been a standard tool used in epidemiology to study the spread of infectious disease.6 Because both infection rates and mitigation efforts such as social distancing have a large impact on economic behavior, economists are now working with these models to better understand the interrelationships between public health measures and economic activity.7 However, like any model, it is not without shortcomings. The key limitation of the SIR model for the purposes of this Commentary is the assumption it makes regarding the frequency at which infected individuals meet with those who are susceptible, thereby generating opportunities for disease transmission. The SIR model assumes uniform mixing across the entire population, meaning that infections evolve as if any susceptible individual interacts with and could be infected by any infected individual across the population with equal probability. However, it is well documented that social interactions are not organized in this stylized way. Instead, individuals interact mostly within much narrower groups, shaped, for example, by family ties, work and social environments, and geography. Network models provide a route into analyzing epidemics in a way that takes these patterns of interaction into account.
A Network SIR Model of Epidemics
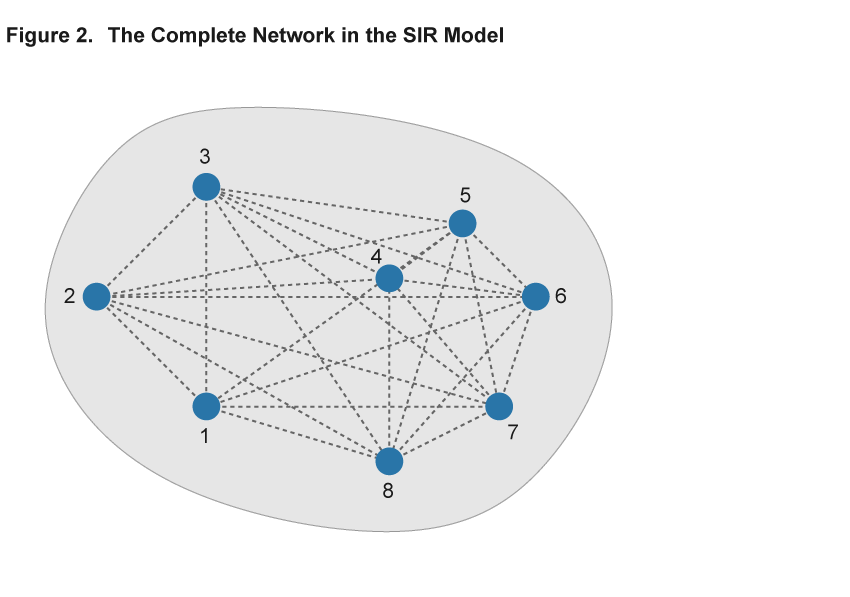
The key component of adopting the network approach to modeling an epidemic is the description of patterns of interaction using a network, consisting of nodes and links.8 Nodes represent individuals or households, and the links describe the interactions that potentially spread disease. The existence of a link could indicate, for example, that two individuals work in the same plant or attend the same school, and a disease could be transmitted between them in that environment. Importantly, in the absence of a link, for example, because two individuals live at opposite ends of the country, the disease does not pass directly from one to the other. Figures 2 and 3 illustrate two sample networks that will be useful in the discussion below. Nodes are represented by numbered blue circles and the lines between them are links.
The elements of the baseline SIR model can be accommodated within this network framework. Individual nodes are either “susceptible,” “infected,” or “removed,” and the transitions between these states work as before: A susceptible individual interacting with many infected contacts will be more likely to become infected than an individual with only few or no infected contacts in their network. Just as in the SIR model, the epidemic is then modeled by simulating the spread of the virus among individuals that interact. The difference is that the interactions are explicitly described by a network that permits more complex patterns of interaction than the baseline SIR model.
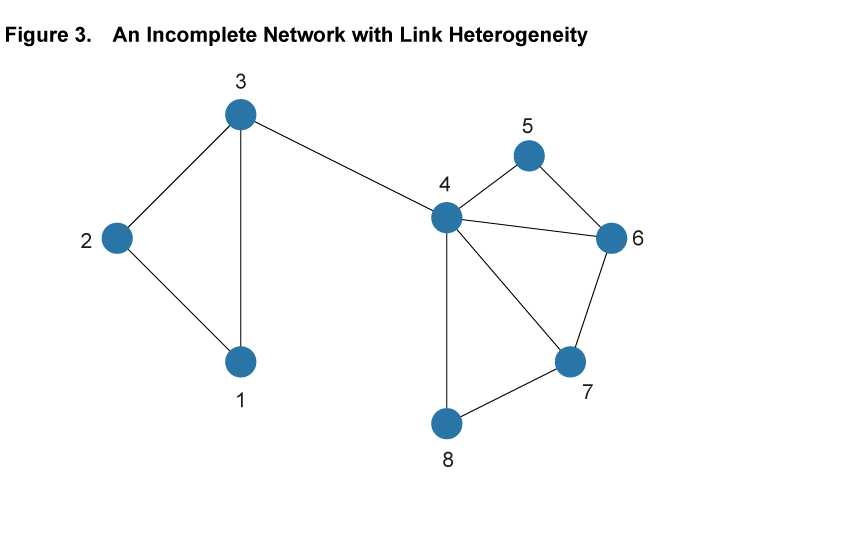
Within the framework of a network model, the baseline SIR model is a special case with two properties: First, each and every pair of individuals across the entire population is potentially linked (such a network is said to be complete). Second, each and every individual has the same number of links as all other individuals (such a network is homogeneous in its structure). Figure 2 illustrates these assumptions in a simple setting with eight nodes. Every pair of nodes is linked by a dashed line, indicating that in the SIR setting the disease can potentially be transferred between every pair of individuals in the population. This is an extreme case, and in most settings the assumptions of completeness and homogeneity are not satisfied. Figure 3 shows a different network using the same eight nodes but adding heterogeneity to the link patterns—not all nodes are directly connected by a link and there is variation in the number of links that each node has. We will argue that ignoring such variation hides some important aspects of disease spread that a more flexible network model can uncover.
The greater granularity of the network model does not come without costs. For example, the data required to map out a given interaction network fully may be prohibitively costly to acquire. In addition, network models can be harder to work with than simpler classes of models and often can only be solved using simulations. However, we argue that the useful insights such models can offer about the spread of disease may make it worthwhile to incur the costs.
Insights from a Network Perspective
Relaxing the assumption of uniform random mixing and explicitly modeling interaction patterns via a network can provide a number of important insights about the spread of a disease that are not present in the baseline model. We focus on the insights that come from two features of real-world networks that network models can capture: (1) heterogeneity in the number of connections, and (2) network clustering. Below we show that both of these affect the evolution of the epidemic in meaningful ways.
The first useful feature that can be captured by a network model is that it can accommodate differences in the number of interactions between individuals in a population. For example, some individuals may live in rural environments with relatively few contacts through their work or social life, while others live in dense urban centers, using crowded public transport, working in high-contact occupations, and interacting with many others outside of work.9 While the baseline SIR model does not allow for such differences in interaction frequency, a network model can readily accommodate it, most directly by having nodes with different numbers of links. For example, in the network in figure 3 Node 1 has only two links, while Node 4 has five. In the context of a spreading disease, it makes a substantial difference whether an infected individual is more like the former or more like the latter. In epidemiological research of certain diseases, it is not uncommon that highly connected individuals, so-called “super-spreaders,” turn out to be particularly important in the early stages of a disease, helping it spread rapidly based on their high degree of interaction with others.
Another, more subtle, effect of the variability in the number of contacts is that, given a fixed share of infected individuals who are uniformly distributed, individuals are more likely to become infected if their number of interactions is higher. This greater connectedness of those who get infected then implies that they are also more likely to pass on the disease themselves. This pattern of the network can contribute to accelerating the spread of the disease in the early stages. Conversely, in later stages of a disease once many highly connected individuals have recovered, infected individuals will tend to have fewer connections and thus fewer opportunities to pass on the disease.
Many structural models of network behavior in an epidemic are much more complicated about how the number of links are distributed than the simple example we illustrate here. For example, how widely connected are the “super-connected”? Do highly connected people tend to seek out and connect with more highly connected individuals? These and other questions have been examined, both with respect to measuring actual connections, and with respect to measuring the behavior of an epidemic during actual historical (and current) outbreaks.10
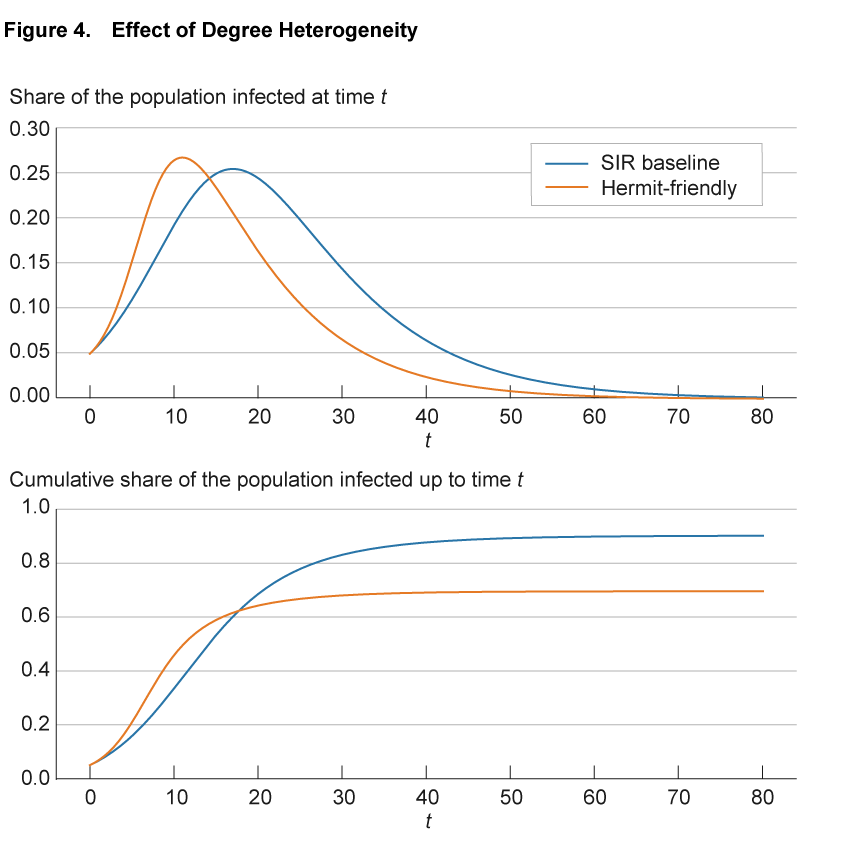
Figure 4 illustrates the impact of heterogeneity in the number of connections on the progression of an epidemic. The blue line shows the baseline SIR model. To make the SIR baseline model comparable to the network models, we convert the SIR model to a network. We create 100,000 nodes and endow each with exactly 50 connections, so that the network is homogeneous. Furthermore, we allocate these connections randomly across all other individuals in the population to reflect the completeness of the network of potential links in the SIR model. Finally, we adjust the infection parameter so that the infection dynamics with these 100,000 nodes and 50 links on average are exactly the same as in the SIR model without a network structure. With these adjustments, the blue line is exactly the same as the continuous blue line in figure 1. The solid orange line shows a variation in which we assume that there are two groups of individuals: one that interacts significantly less at 10 connections (hermit) and one that interacts significantly more at 90 connections (friendly). We calibrate the model so that the average number of connections across all individuals remains 50. All other model parameters are identical between the two lines.
Source: Authors’ simulations.
Compared to the benchmark case, in the hermit-friendly model the disease initially spreads significantly faster, through the highly connected individuals, but spread then slows down and the number of infected approaches zero earlier. Interestingly, in the hermit-friendly model, the long-run share of the population that ever gets infected is significantly lower than in the SIR model. This reflects the fact that as the infection progresses, fewer “friendly” individuals remain susceptible and are infected and the share of “hermit” individuals increases. With fewer connections to facilitate transmission, the disease spreads more slowly and herd immunity is reached earlier.11
The second feature that network models can capture is that social networks tend to exhibit a significant degree of overlapping relationships among groups of individuals who move in the same circles. Among coworkers in a given plant, for example, it is likely that a large share of the interactions of one worker in the workplace as well as in other social circles overlap significantly with those of another worker at the same plant. This feature is illustrated in figure 3 by the two easily distinguished clusters involving Nodes 1, 2, and 3, and Nodes 4 to 8, respectively. Within the clusters, nodes are tightly connected, but there is only one link across, from Node 3 to 4.
This phenomenon, termed “clustering” in the networks literature, has important implications for the spread of a disease. With a high degree of clustering, as the share of infected individuals in one part of the network increases, the likelihood of infecting another individual in that part decreases, as fewer and fewer contacts remain susceptible. This slows down the spread of the disease.
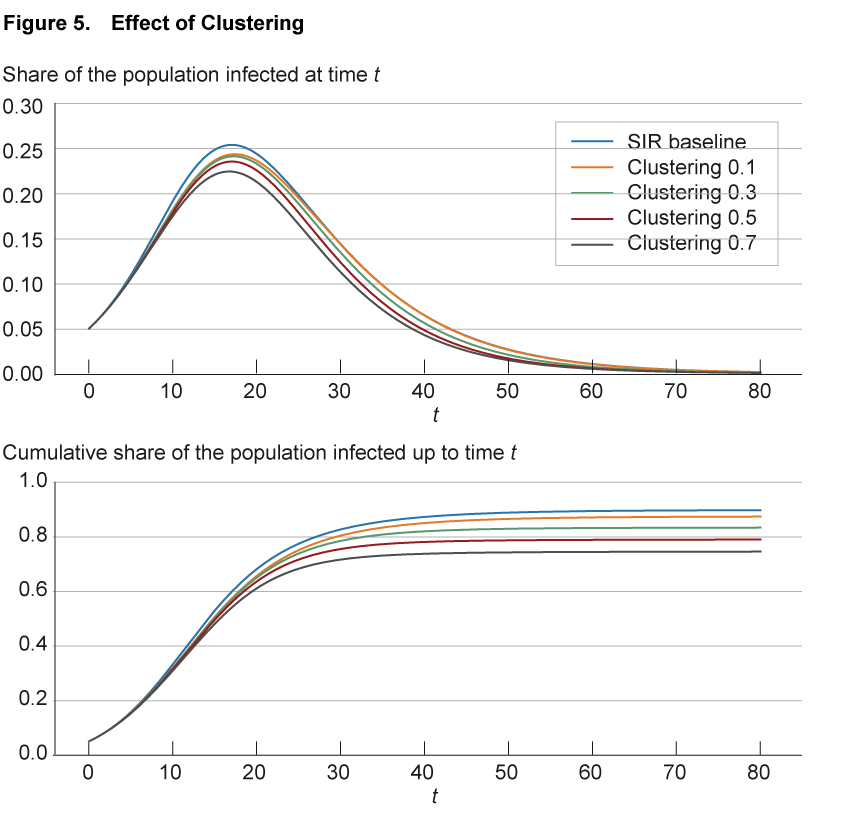
The effect of clustering in the aggregate is illustrated in figure 5. As before, the blue line shows the baseline SIR model replicated in a network of nodes with 50 connections each, randomly assigned across the population. The solid lines of different colors show simulations with different levels of clustering. These differences are achieved by maintaining 50 links per node but assigning these links no longer randomly as in the SIR baseline, but such that the fraction of shared neighbors on average hits a specified level from 0.1 to 0.7. For comparison, in the SIR baseline case with random assignment, the fraction of neighbors that are shared goes to zero as the network becomes large.
Source: Authors’ simulations.
The simulations show how in the aggregate greater clustering leads to a small slowdown in the spread of the disease compared to the benchmark case. Note that higher clustering is also associated with a slightly shorter duration of the disease compared to the benchmark, and a lower share of the population becoming infected at some point.12
Locally, the result of clustering is an acceleration of spread within the cluster. In the context of COVID-19, there were a number of notable local networks of individuals with significant clustering, such as on the Diamond Princess cruise ship, where the disease spread aggressively until new infections petered out as fewer and fewer susceptible passengers or crew were around. Similar dynamics have been at work in the various outbreaks in prisons across the country. In contrast, in a classic SIR model there is no space for such local saturation and the disease is able to draw on the complete pool of susceptible individuals across the population.
Implications for Economic Activity and Policy
Beyond the insights on disease spread discussed above, adopting a network perspective provides insights on the implications for economic activity and opens up a way to understand some additional policy options available to combat an epidemic.
Network models of disease provide insights that can enrich the analysis of the economic implications of a pandemic. For example, as the simple hermit-friendly model above illustrates, significant heterogeneity in connections can accelerate the early spread of disease while reducing the share of the population that is affected in the long run. This result affects the relative benefits of lockdown policies in models that trade off economic disruption for a slowdown in the spread of the disease, such as in Eichenbaum, Rebelo, and Trabandt (2020). In addition, the model suggests that allowing for heterogeneity in economic analyses of the disease’s impact can provide substantial benefits, as different groups might contribute differently to economic output as they do for disease outcomes. Recent work by Acemoglu et al. (2020) employs this approach to great effect.
Furthermore, the clustering of connections and the implications this network pattern has for the way the disease spreads suggest that the economic disruptions caused by the disease might exhibit similar behavior. For example, in a network model a local outbreak in an industrial town or plant can quickly spread in that area. Economic output in that area will then likewise quickly be severely disrupted in part because a large share of employees are sick or stay at home even though the statewide or national share of infections is limited. Such instances occurred within the meat processing industry throughout the spring and summer of 2020, causing substantial supply chain disruptions and price increases that affected families throughout the country.13
As pathways of disease transmission are explicitly described in a network model, a network model can accommodate the tracing of contacts (and isolation) of known infected individuals, a policy commonly used in combating epidemics and also advocated for in the context of the COVID-19 pandemic. Indeed, such aggressive use of information on contact networks has been part of the policy response to COVID-19 in South Korea that is widely regarded as having been more successful than that in many other countries.14 At a much cruder level, the quarantining of the Diamond Princess and other cruise ships represents a similar response that exploits the pattern of relationships among individuals—in this case, the absence of interactions outside the ship as long as it remained at sea.
In addition to tracing contacts of known infected individuals, network information can also be exploited for targeted testing. By focusing limited testing resources on highly connected individuals such as workers in healthcare or public transport, these resources can be put to the best use.
In a basic SIR model, every individual is potentially connected to everyone else and thus the set of “contacts” is always potentially the full population. Therefore, this modeling approach does not capture the potential for targeted, localized policies that have been key to responding to past epidemics. One implication of this limitation is that short of letting an epidemic play out until herd immunity is achieved, defeating a fast-spreading virus such as COVID-19 requires finding and distributing an effective vaccine or restricting interactions sufficiently until the virus is fully extinguished. Otherwise, within an SIR model, once restrictions are lifted, any remaining infected individuals are able to spread the disease again to any individual still susceptible, potentially necessitating a return to population-wide lockdowns. The network view allows policymakers to think about more nuanced policies, such as lifting general restrictions but following up with targeted responses to any new clusters of infections that might occur using targeted testing and contact tracing.
Conclusion
This Commentary has made the case that adopting a network perspective can offer useful insights when modeling the spread of infectious diseases such as COVID-19. We have shown that the baseline SIR model commonly used implicitly makes assumptions about the pattern of interactions among individuals that are unlikely to hold true in the real world. More importantly, we have demonstrated how incorporating some commonly observed network patterns, such as heterogeneity in the number of contacts individuals have and the clustering of contacts, can change the behavior of the model in important ways, affecting the speed of the disease spread, long-run health outcomes, and the effects of the disease on economic activity. Furthermore, by accounting for the patterns of interaction among a population, a network model offers additional nuance for the analysis of the economic effects of COVID-19 and better informs the discussion of targeted policies such as contact tracing and testing that have been successfully used to help combat infectious diseases.
Footnotes
- For a broader background on the economics of networks see Jackson (2008). Return to 1
- See Brauer, van den Driessche, and Wu. (2008) for a textbook treatment. Return to 2
- For the disease to spread in this manner, the infection must be sufficiently contagious at this point. This is captured in the SIR model by the condition that the basic reproduction number, before any mitigation is taking place, is greater than 1; that is, on average each infected individual infects more than one other individual. If fewer new infections than removals take place right from the beginning, the disease never takes off. Return to 3
- Formally, herd immunity is reached in the SIR model when the share of immune individuals is sufficiently large so that the reproduction number effectively falls below one. At this point effective recoveries occur faster than new infections (as so many individuals are already immune) and any limited outbreaks peter out. Return to 4
- The chart shows the evolution of a simulated epidemic in the SIR framework. There is a wide range of parameters that are consistent with the early data on COVID-19. See, for example, the scenarios set out by the CDC at https://www.cdc.gov/coronavirus/2019-ncov/hcp/planning-scenarios.html. Our parameters follow the baseline setting in Atkeson (2020b). We assume infected individuals recover on average over 8 days. The disease is assumed to have a basic reproduction number of 2.5; that is, without any mitigation and before large numbers of individuals are immune, on average an infected individual spreads the disease to 2.5 additional people before recovering. Note these infectiousness parameters do not incorporate the widespread mitigation efforts that have changed the dynamics of the spread of COVID-19. Our simulation starts with 5 percent of the population being infected. For the formal description of the model see the online appendix to this Commentary. Return to 5
- See Hethcote (2000) for a comprehensive review of the literature on mathematical models of infectious disease, including a major section on SIR models. Return to 6
- Since early 2020 a large number of papers on the economics of pandemics and of COVID-19 have been published, including Atkeson (2020a), Eichenbaum, Rebelo, and Trabandt (2020), Alvarez, Argente, and Lippi (2020), Piguillem and Shi (2020), Berger, Herkenhoff, and Mongey (2020) and Toda (2020). For a discussion of this literature and additional references, see Hur and Jenuwine (2020). Return to 7
- Our discussion below is based on Kiss, Miller, and Simon (2017). For further reading, this book provides a comprehensive treatment of the use of networks in epidemiology. We focus in this Commentary in particular on aspects and models discussed in Chapters 4 and 5. Return to 8
- The technical term for the number of links of a node is “degree.” Return to 9
- See Keeling and Eames (2005), in particular, Section 3, for an overview of this and related research. Return to 10
- For further treatments of heterogeneity in SIR models of epidemics, see Britton, Ball, and Trapman (2020) and for the economic perspective, see Ellison (2020) and Acemoglu et al. (2020). Return to 11
- We present a simple example to highlight the potential effects of clustering in networks. For deeper treatments see, for example, Keeling and Rohani (2008), Rand (1999), and House and Keeling (2010). Return to 12
- In June 2020, beef and veal prices increased by 25.1 percent compared to June 2019. Source: https://www.bls.gov/news.release/archives/cpi_07142020.htm. Return to 13
- See the discussion of policy scenarios supporting the exit from quarantine and lockdowns in Humphrey et al. (2020). Return to 14
References
- Acemoglu, Daron, Victor Chernozhukov, Iván Werning, and Michael D Whinston. 2020. “Optimal Targeted Lockdowns in a Multi-Group SIR Model.” National Bureau of Economic Research, Working Paper No. 27102. https://doi.org/10.3386/w27102.
- Alvarez, Fernando E., David Argente, and Francesco Lippi. 2020. “A Simple Planning Problem for COVID-19 Lockdown.” National Bureau of Economic Research, Working Paper No. 26981. https://doi.org/10.3386/w26981.
- Atkeson, Andrew G. 2020a. “What Will Be the Economic Impact of COVID-19 in the US? Rough Estimates of Disease Scenarios.” National Bureau of Economic Research, Working Paper No. 26867. https://doi.org/10.3386/w26867.
- Atkeson, Andrew G. 2020b. “On Using SIR Models to Model Disease Scenarios for COVID-19.” Quarterly Review, 41(1). https://doi.org/10.21034/qr.4111.
- Banerjee, A., A. G. Chandrasekhar, E. Duflo, and M. O. Jackson. 2013. “The Diffusion of Microfinance.” Science, 341(6144). https://doi.org/10.1126/science.1236498.
- Berger, David, Kyle Herkenhoff, and Simon Mongey. 2020. “An SEIR Infectious Disease Model with Testing and Conditional Quarantine.” Preprint. Staff Report. https://doi.org/10.21034/sr.597.
- Brauer, Fred, Pauline van den Driessche, and J. Wu. 2008. Mathematical Epidemiology. Springer Science and Business Media. https://doi.org/10.1007/978-3-540-78911-6.
- Britton, Tom, Frank Ball, and Pieter Trapman. 2020. “The Disease-Induced Herd Immunity Level for COVID-19 Is Substantially Lower than the Classical Herd Immunity Level.” ArXiv:2005.03085 [Physics, q-Bio]. https://doi.org/10.1101/2020.05.06.20093336.
- Calvó-Armengol, Antoni, and Matthew O. Jackson. 2007. “Networks in Labor Markets: Wage and Employment Dynamics and Inequality.” Journal of Economic Theory, 132(1): 27–46. https://doi.org/10.1016/j.jet.2005.07.007.
- Chaney, Thomas. 2014. “The Network Structure of International Trade.” American Economic Review, 104(11): 3600–3634. https://doi.org/10.1257/aer.104.11.3600.
- Eichenbaum, Martin S., Sergio Rebelo, and Mathias Trabandt. 2020. “The Macroeconomics of Epidemics.” National Bureau of Economic Research, Working Paper No. 26882. https://doi.org/10.3386/w26882.
- Elliott, Matthew, Benjamin Golub, and Matthew O. Jackson. 2014. “Financial Networks and Contagion.” American Economic Review, 104(10): 3115–3153. https://doi.org/10.1257/aer.104.10.3115.
- Ellison, Glenn. 2020. “Implications of Heterogeneous SIR Models for Analyses of COVID-19.” National Bureau of Economic Research, Working Paper No. 27373. https://doi.org/10.3386/w27373.
- Hethcote, Herbert W. 2000. “The Mathematics of Infectious Diseases.” SIAM Review, 42(4): 599–653. https://doi.org/10.1137/S0036144500371907.
- House, Thomas, and Matt J. Keeling. 2010. “The Impact of Contact Tracing in Clustered Populations.” PLOS Computational Biology, 6(3): e1000721. https://doi.org/10.1371/journal.pcbi.1000721.
- Humphrey, Lia, Edward W. Thommes, Roie Fields, Naseem Hakim, Ayman Chit, and Monica Gabriela Cojocaru. 2020. “Testing, Tracing, and Social Distancing: Assessing Options for the Control of Covid_19.” MedRxiv preprint. https://doi.org/10.1101/2020.04.23.20077503.
- Jackson, Matthew O. 2008. Social and Economic Networks. Princeton University Press. https://doi.org/10.1515/9781400833993.
- Keeling, Matt J., and Ken T.D. Eames. 2005. “Networks and Epidemic Models.” Journal of the Royal Society Interface, 2(4): 295–307. https://doi.org/10.1098/rsif.2005.0051.
- Keeling, Matt J., and Pejman Rohani. 2008. Modeling Infectious Diseases in Humans and Animals. Princeton University Press. https://doi.org/10.2307/j.ctvcm4gk0.
- Kermack, William Ogilvy, and A. G. McKendrick. 1927. “A Contribution to the Mathematical Theory of Epidemics.” Proceedings of the Royal Society of London. Series A, 115(772): 700–721. https://doi.org/10.1098/rspa.1927.0118.
- Kiss, István Z., Joel C. Miller, and Péter L. Simon. 2017. Mathematics of Epidemics on Networks: From Exact to Approximate Models. Springer International Publishing. https://doi.org/10.1007/978-3-319-50806-1.
- Piguillem, Facundo, and Liyan Shi. 2020. “The Optimal COVID-19 Quarantine and Testing Policies.” Einaudi Institute for Economics and Finance, Working Paper No. 20/04. http://www.eief.it/eief/images/WP_20.04.pdf.
- Rand, D.A. 1999. “Correlation Equations and Pair Approximations for Spatial Ecologie.” In Advanced Ecological Theory: Principles and Applications, edited by Jacqueline McGlade. John Wiley & Sons. https://doi.org/10.1002/9781444311501.ch4.
- Toda, Alexis Akira. 2020. “Susceptible-Infected-Recovered (SIR) Dynamics of COVID-19 and Economic Impact.” ArXiv:2003.11221 [Econ, q-Bio, q-Fin]. http://arxiv.org/abs/2003.11221.
Suggested Citation
Craig, Ben R., Tom Phelan, Jan-Peter Siedlarek, and Jared Steinberg. 2020. “Improving Epidemic Modeling with Networks.” Federal Reserve Bank of Cleveland, Economic Commentary 2020-23. https://doi.org/10.26509/frbc-ec-202023
This work by Federal Reserve Bank of Cleveland is licensed under Creative Commons Attribution-NonCommercial 4.0 International

