

- Share
Residual Seasonality in GDP Growth Remains after Latest BEA Improvements
Measuring economic growth is complicated by seasonality, the regular fluctuation in economic activity that depends on the season of the year. The BEA uses statistical techniques to remove seasonality from its estimates of GDP, but some research has indicated that seasonality remains. As a result, the BEA began a three-phase plan in 2015 to improve its seasonal-adjustment techniques, and in July 2018, it completed phase 3. Our analysis indicates that even after these latest improvements by the BEA, residual seasonality in GDP growth remains. On average, this residual seasonality makes GDP growth appear to be slower in the first quarter of the year and more rapid in the second quarter of the year. Rapid second-quarter growth is particularly noticeable in recent years. As a result, business economists and policymakers may want to take seasonality into account when using GDP to assess the health of the economy.

The views authors express in Economic Commentary are theirs and not necessarily those of the Federal Reserve Bank of Cleveland or the Board of Governors of the Federal Reserve System. The series editor is Tasia Hane. This paper and its data are subject to revision; please visit clevelandfed.org for updates.
Seasonality, or the regular fluctuation in economic activity that depends on the season of the year, is large.1 Because of its size, seasonality makes it difficult to assess the state of the business cycle. Thus, the Bureau of Economic Analysis (BEA) uses statistical techniques to remove seasonality from its estimates of GDP, and these estimates are commonly treated as reliable economic indicators that are free of seasonality. However, some previous research has found that seasonality still exists in estimates of GDP and that it often shows up as slow GDP growth in the first quarter of the year.2 Responding to recent research findings, the BEA has been revising its methodology to remove residual seasonality in GDP, culminating in its July 2018 benchmark revision.3
In this Commentary, we test if residual seasonality has persisted even after the BEA’s July 2018 benchmark revision.4 Following the methodology of Lunsford (2017), we use the low-frequency econometrics of Müller and Watson (2008, 2015) to perform these tests.5 Using the newly revised data for GDP and its components from 1985 to 2018, we find that residual seasonality remains. On average, first-quarter GDP growth has residual seasonality of annualized −0.6 percent, and second-quarter GDP growth has a seasonal component of annualized 0.5 percent on average. These estimates are slightly smaller in magnitude than those found by Lunsford (2017), indicating improvement in the BEA’s seasonal adjustment methods. However, the bounce-back effect, where GDP growth is slow on average in the first quarter of the year and rapid in the second quarter of the year, is still present. This is particularly noticeable in recent data. From 2014 to 2018, published GDP growth was faster in the second quarter of a given year than any other quarter of that year. Thus, despite the attention given to slow first-quarter GDP growth, rapid second-quarter GDP growth also appears to be an ongoing feature of the data. An assessment of the components of GDP indicates that several components—in particular, private investment and federal defense spending—drive the residual seasonality of GDP.
These findings indicate that, notwithstanding the BEA’s improvements to the seasonal adjustment of GDP, some evidence of residual seasonality persists. Using a shorter sample and a different statistical technique, Wright (2018) also finds that residual seasonality remains after the 2018 update, although the statistical significance of the seasonality varies with the method used to test for it. As a result, business economists and policymakers should take seasonality into account when using GDP to assess the health of the economy. One option is to directly adjust the not-seasonally-adjusted GDP data the BEA now publishes.6
Methodology and Evidence of Residual Seasonality
We model GDP growth with three components: a business-cycle (cyclical) component (ct), a seasonal component (st), and an irregular component (it). These components yield GDP growth as follows:
yt = ct + st + it.
The business-cycle component includes fluctuations in GDP growth associated with recessions and recoveries as well as the average level of GDP growth from 1985 to 2018. The seasonal component is the regular deviation from the business-cycle component that corresponds to a given quarter of the year. Finally, the irregular component contains any fluctuations in GDP growth that cannot be attributed to the business cycle or seasonal components.7
To test for seasonality in GDP growth, we first subtract an estimate of the business cycle from GDP growth. With seasonally adjusted data such as GDP growth, we expect the seasonal component to be zero in all quarters and for the data to have only cyclical and irregular components. Hence, the difference between GDP growth and the cyclical component should only equal an irregular component and average to zero in every quarter. Our test of residual seasonality looks for evidence that this difference is distinct from zero in some quarters.
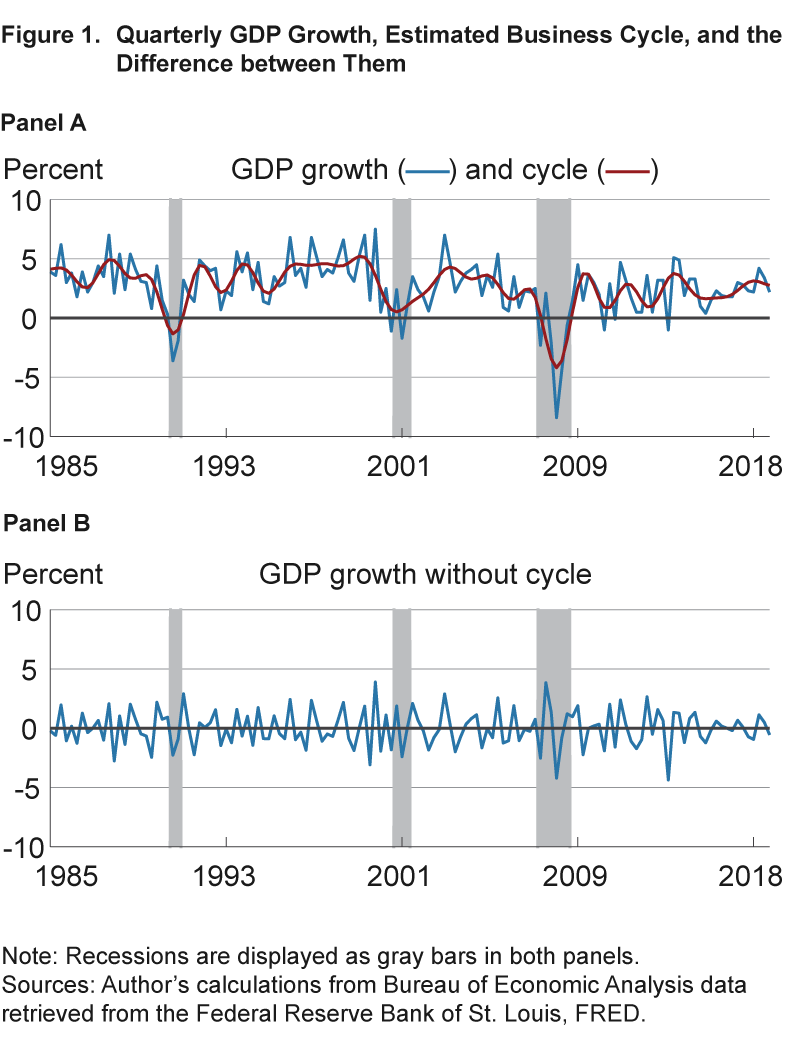
To subtract the business-cycle component from GDP growth, we use the linear-regression approach described in Lunsford (2017) to capture patterns in the GDP growth data that are associated with fluctuations lasting two years or more. Using this timeframe allows us to capture economic recessions and expansions without interfering with potential seasonal patterns that occur within the year. Panel A of figure 1 shows in red the estimated business-cycle pattern we have extracted from the newly revised GDP data from 1985 to 2018 alongside actual GDP growth.8 The estimated cycle is a smoothed version of GDP growth, and it picks up much of the fluctuation in GDP growth around all three recessions in the sample. Panel B displays the difference between GDP growth and the estimated cycle. The data in this panel should be free of any influence from the business cycle, and on visual inspection this appears to be the case.
Next, we calculate the average quarter-by-quarter difference between GDP growth and the estimated business cycle and produce 95 percent confidence intervals for the averages. We use this process to check if the difference between GDP growth and the cyclical component is non-zero for each quarter of the year.
Figure 2 shows the results. The first quarter has an average seasonal effect of −0.6 percent. Further, because the confidence interval for this average is entirely below zero, we reject the hypothesis that the seasonal component is zero in the first quarter, indicating the presence of residual seasonality. We also find that for quarter 1 the difference between GDP growth and the estimated business cycle was negative throughout the 1990s.
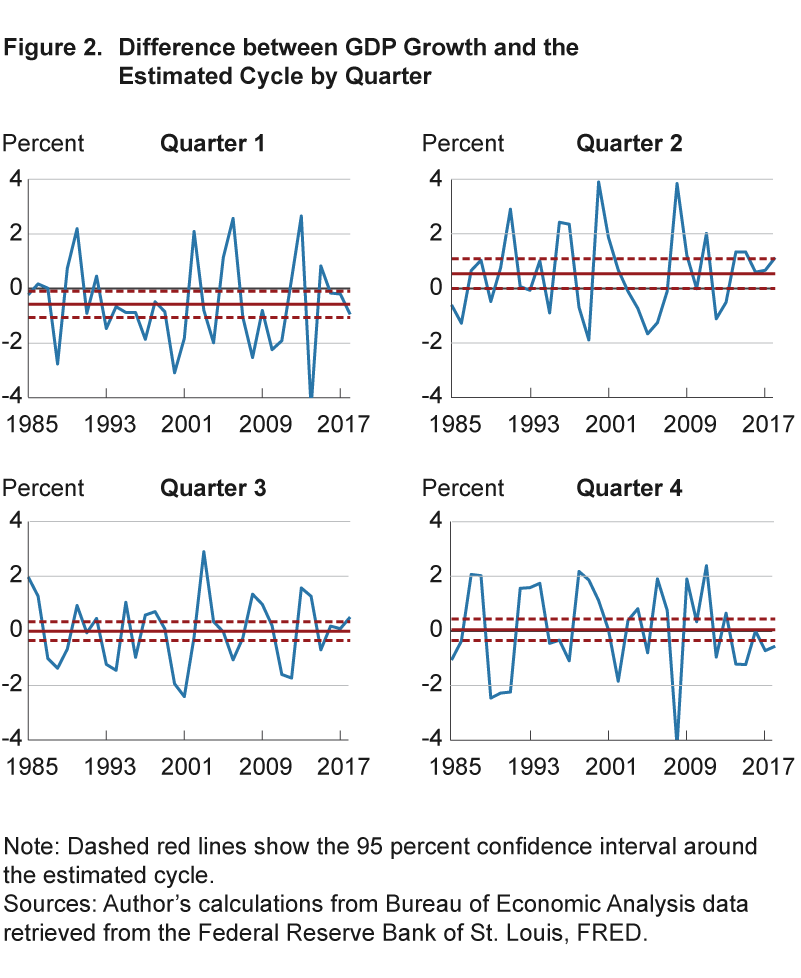
Figure 2 also shows that the second quarter has an average seasonal effect of 0.5 percent. Because any seasonal effect that might exist averages out over the course of the year, figure 2 indicates that the negative effect of seasonality on growth in the first quarter is almost entirely corrected in the second quarter. That is, on average we see GDP growth bounce back in the second quarter after its first-quarter slump. This bounce-back is particularly noticeable in recent years. From 2014 to 2018, the second quarter of the year had the fastest published GDP growth relative to other quarters within the same year.
The final result from figure 2 is that the third and fourth quarters each have an average seasonal component of −0.0 percent and 0.0 percent, respectively. However, these averages are not statistically significant, indicating no residual seasonality in these quarters.
Our findings are qualitatively similar to those of Lunsford (2017), which tests for residual seasonality over 1985–2015 after the first round of BEA revisions. We do see an attenuation in our estimates of seasonality in GDP for the first and second quarters compared to the estimates in Lunsford (2017), indicating some improvement in the BEA’s seasonal adjustment methodology since the first phase of its three-phase plan. However, Lunsford (2017) notes that the difference between GDP growth and the estimated business cycle for quarter 1 indicates that GDP growth was consistently below the business cycle throughout the 1990s, and our results indicate that this is still the case post-revisions.
What Is Driving the Seasonality?
The BEA’s estimates of GDP come from four main components: consumption, private investment, net exports, and government consumption and investment. Each main component is also estimated from subcomponents. Part of the BEA’s three-phase plan to address residual seasonality was to examine each component of GDP growth and to target components that they found were particularly affected by lingering seasonality. We test each component and its subcomponents for residual seasonality, applying the same method that we applied for GDP growth.
Table 1 displays the average seasonal effect in percent for each component and subcomponent of GDP growth for each quarter. We also indicate when these seasonal effects are statistically significant at the 5 percent and 10 percent levels. Of the four major components of GDP, two have contributed the most to the residual seasonality in the first and second quarters of our sample: private investment and government consumption and investment. We find statistically significant seasonality in several components in the third quarter, but the additive nature of the national income and product accounts’ subcomponents means that the residual seasonality in one subcomponent can be offset by another, and thus they do not add up to statistically significant seasonality in GDP for this quarter.
|
|
First quarter | Second quarter | Third quarter | Fourth quarter |
|---|---|---|---|---|
| GDP | −0.58** | 0.54** | −0.01 | 0.04 |
| Consumption | −0.13 | −0.00 | 0.31* | −0.17 |
| Durable goods | −0.09 | 0.01 | 0.26 | −0.18 |
| Nondurable goods | −0.02 | −0.00 | −0.03 | 0.05 |
| Services | −0.02 | −0.01 | 0.08** | −0.04 |
| Private investment | −0.31* | 0.30* | −0.16 | 0.18 |
| Nonresidential structures | −0.06 | 0.08 | 0.02 | −0.03 |
| Nonresidential equipment | −0.07 | 0.08 | 0.09 | −0.10 |
| Nonresidential intellectual property | −0.01 | 0.00 | −0.01 | 0.01 |
| Residential investment | −0.02 | 0.06* | −0.03* | −0.02 |
| Change in private inventories | −0.15 | 0.07 | −0.23 | 0.31 |
| Net exports | 0.01 | 0.05 | −0.14 | 0.08 |
| Exports | −0.17 | 0.12 | −0.07 | 0.12 |
| Imports | 0.18 | −0.06 | −0.07 | −0.05 |
| Government consumption and investment | −0.13 | 0.20** | −0.02 | −0.04 |
| Federal: national defense | −0.13* | 0.17** | 0.05 | −0.09 |
| Federal: nondefense | 0.01 | −0.00 | −0.04 | 0.04 |
| State and local | −0.01 | 0.03 | −0.03 | 0.01 |
Notes: One star indicates statistical significance at the 10 percent level, and two stars indicate statistical significance at the 5 percent level. Values reported are rounded, so 0 can be positive or negative because the actual unrounded value is positive or negative.
Sources: Author’s calculations from Bureau of Economic Analysis data retrieved from the Federal Reserve Bank of St. Louis, FRED.
While government consumption and investment in total is not statistically significant in the first quarter of the year, it is significant at the 5 percent level in the second quarter. We find that residual seasonality in the national defense subcomponent is relatively large, contributing about one-fourth of the first-quarter residual seasonality in GDP growth and about one-third of the second-quarter residual seasonality in GDP growth.
When looking at the subcomponents of private investment, it appears that no single subcomponent is driving the residual seasonality. No subcomponent of private investment is statistically significant in either the first quarter or the second quarter. However, all of the subcomponents are negative in the first quarter and positive in the second quarter, suggesting that correlation in the seasonality of the subcomponents of private investment may be driving the seasonality in total private investment.
Conclusion
This Commentary provides evidence of lingering residual seasonality in GDP growth from 1985 to 2018, even after the comprehensive revision by the BEA that improved seasonal adjustment methods. With our methodology, we find that first-quarter GDP growth has residual seasonality of annualized −0.6 percent and that second-quarter GDP growth has residual seasonality of annualized 0.5 percent. We note that residual seasonality in second-quarter GDP growth has been particularly apparent in recent years. As in Lunsford (2017), residual seasonality in GDP growth is driven by private investment and national defense spending. Although our estimates of residual seasonality are smaller in magnitude than those found in Lunsford (2017), the presence of residual seasonality post-revisions can complicate policymakers’ and business economists’ ability to monitor the pace of economic growth and watch for potential recessions in real time.
Another important result from our analysis is that residual seasonality appears to be especially pronounced in the 1990s for the first quarter of the year. A previous phase of the BEA’s strategic plan to address seasonality included revisions to historical source data that had not been previously adjusted. In 2018, the BEA extended these revisions to a number of series back to 2002. To account for seasonality that may be present over longer time spans, the BEA targeted several historical series, including federal consumption expenditures, back even further.9 Despite these historical improvements by the BEA, we find persistently low GDP growth in the first quarter during the 1990s, suggesting the presence of residual seasonality over this time span that may remain unaddressed. Given that historical GDP data are often incorporated into statistical models of forecasting and policy analysis, users of these models may want to consider seasonally adjusting GDP growth before producing forecasts or analyzing economic policy.
Footnotes
- Real, not-seasonally adjusted, annualized GDP growth averaged −13 percent, 11 percent, 4 percent, and 8 percent, in the first, second, third, and fourth quarters, respectively, from 2003 to 2018. Return to 1
- For example, see Gilbert, Morin, Paciorek, and Sahm (2015), Groen and Russo (2015), Rudebusch, Wilson, and Mahedy (2015), Stark (2015), Lengermann, Morin, Paciorek, Pinto, Sahm (2017), and Lunsford (2017). Return to 2
- See Moulton and Cowan (2016) and Cowan, Smith, and Thompson (2018), for further details on the BEA’s three-phase plan. Return to 3
- Formally, we test the null hypothesis that no residual seasonality is present. Return to 4
- In technical terms, we use Müller and Watson’s (2008, 2015) low-frequency econometrics to estimate long-run variances for constructing confidence intervals. Müller (2007) shows that long-run variance estimators of the type used in Müller and Watson (2008, 2015) maintain the targeted statistical size for moderately persistent data. Return to 5
- As part of the 2018 update described in Cowan, Smith, and Thompson (2018), the BEA introduced not-seasonally-adjusted estimates for GDP and its major components back to 2002. Return to 6
- This decomposition of GDP growth into three components parallels the decomposition used in the Census Bureau’s X-13 seasonal adjustment filter. The only difference is that we use the vocabulary “business-cycle” component in place of the Census Bureau’s “trend” component. Return to 7
- GDP growth is from line 1 of the national income and products accounts (NIPA) table 1.1.2. Return to 8
- Federal consumption expenditures were revised back to 1978. Other historical revisions include Treasury Department data for components of government spending, and exports of services, which were revised back to the 1970s and 1960s, respectively. Return to 9
References
- Cowan, Benjamin D., Shelly Smith, and Sarahelen Thompson. 2018. “Seasonal Adjustment in the National Income and Product Accounts: Results from the 2018 Comprehensive Update,” Bureau of Economic Analysis, Survey of Current Business (August).
- Gilbert, Charles, Norman Mori, Andrew D. Paciorek, and Claudia R. Sahm. 2015. “Residual Seasonality in GDP,” Board of Governors of the Federal Reserve, FEDS Notes, 2015-05-14.
- Groen, Jan, and Patrick Russo. 2015. “The Myth of First-Quarter Residual Seasonality,” Federal Reserve Bank of New York, Liberty Street Economics (June 8).
- Lengermann, Paul, Norman Morin, Andrew Paciorek, Eugenio Pinto, and Claudia R. Sahm. 2017. “Another Look at Residual Seasonality in GDP,” Board of Governors of the Federal Reserve, FEDS Notes (July 28).
- Lunsford, Kurt G. 2017. “Lingering Residual Seasonality in GDP Growth.” Federal Reserve Bank of Cleveland, Economic Commentary, 2017-06.
- Moulton, Brent R. and Benjamin D. Cowan. 2016. “Residual Seasonality in GDP and GDI: Findings and Next Steps,” Bureau of Economic Analysis, Survey of Current Business (July).
- Müller, Ulrich K. 2007. “A Theory of Robust Long-Run Variance Estimation,” Journal of Econometrics, 141(2): 1331–1352.
- Müller, Ulrich K., and Mark W. Watson. 2008. “Testing Models of Low-Frequency Variability.” Econometrica, 76(5): 979–1016.
- Müller, Ulrich K. and Mark W. Watson. 2015. “Low-Frequency Econometrics,” NBER Working Paper, 21564.
- Rudebusch, Glenn D., Daniel Wilson, and Tim Mahedy. 2015. “The Puzzle of Weak First-Quarter GDP Growth,” Federal Reserve Bank of San Francisco, Economic Letter, 2015-16.
- Stark, Tom. 2015. “First Quarters in the National Income and Product Accounts,” Federal Reserve Bank of Philadelphia, Research Rap Special Report (May 14).
- Wright, Jonathan H. 2018. “Seasonal Adjustment of NIPA Data,” NBER Working Paper, 24895.
Suggested Citation
Consolvo, Victoria, and Kurt G. Lunsford. 2019. “Residual Seasonality in GDP Growth Remains after Latest BEA Improvements.” Federal Reserve Bank of Cleveland, Economic Commentary 2019-05. https://doi.org/10.26509/frbc-ec-201905
This work by Federal Reserve Bank of Cleveland is licensed under Creative Commons Attribution-NonCommercial 4.0 International

