

- Share
Are Millennials with Student Loans Upwardly Mobile?
Students have been amassing ever-growing levels of debt to attend college. The situation has raised concerns about whether the debt is high enough that the benefits of borrowing—in terms of students’ future socioeconomic outcomes—are compromised. This Commentary investigates relationships between student debt, mobility, and upward social mobility. The findings suggest that student debts have not become so burdensome that they undo the advantages of higher skills. However, the advantages enjoyed by heavily indebted millennial students relative to nonborrowers have declined substantially from the advantages enjoyed by the heaviest borrowers in Generation X.

The views authors express in Economic Commentary are theirs and not necessarily those of the Federal Reserve Bank of Cleveland or the Board of Governors of the Federal Reserve System. The series editor is Tasia Hane. This paper and its data are subject to revision; please visit clevelandfed.org for updates.
Student debt has ballooned to unprecedented levels in recent years. The growth has affected not only the total amount of debt outstanding, but also the proportion of students taking out loans and the average amount of debt taken on by individuals. From 2007 to 2015, outstanding debt rose 116 percent and now amounts to $1,190 billion. The share of people between the ages of 26 and 32 who have student loan balances increased from 23 percent to 37 percent, and their median balance rose 36 percent (adjusted for inflation) to $16,808. Moreover, the share of borrowers with balances in excess of $25,000 has more than doubled—rising from 12 percent to 34 percent.
We might be concerned that debts this large would offset or delay the benefits of attending college. In this Commentary, we investigate relationships between student debt, mobility and upward social mobility. In general, we would expect student-loan borrowing to be positively correlated with measures of upward mobility, because young people who attend college or earn a degree are generally higher-skilled than those who do not. The differences in skills should lead to differences in upward mobility regardless of the amount of debt students have taken on. But perhaps there is a critical point at which the debt becomes too large.
This analysis focuses on several measures of mobility and social mobility, including household formation, moving between metro areas, moving to better neighborhoods, and homeownership. The findings suggest that student debt has not become so burdensome that it is undoing the advantages of higher skills. Young people who borrowed heavily during the recent expansion of student loan debt have been more likely to move up to higher-status neighborhoods than their peers who borrowed less or borrowed nothing. While students who borrow more do delay purchasing a home, they are not substantially more likely to continue living with their parents. Millennials with student loans are still likely to be upwardly mobile. However, if we examine the same measures for Gen-Xers, we find that student loan borrowers used to be more upwardly mobile and experience greater advantages over nonborrowers than is the case for today’s heavily indebted millennials.
The Data
The data used in this analysis are from the Federal Reserve Bank of New York/Equifax consumer credit panel. It is a sample that includes approximately 5 percent of all Americans with credit histories. Although all identifying information is removed, the data do indicate the individual’s census tract. Using the tract, it is possible to see if the person moved to a different neighborhood or metro area. The neighborhoods can be linked to tract-level estimates of educational attainment and income from the American Community Survey.
The analysis focuses on 932,005 individuals born from 1983 through 1989. In 2007, these young people were between the ages of 18 and 24, and in 2015 they were 26 to 32. These cohorts are young enough to have participated in the large increase in student loans and old enough to have their upward-mobility outcomes observed.
Each individual’s measure of student-loan balances is the maximum of their balance in 2007 and 2015. For the older cohorts, the 2007 balance is probably close to their lifetime high, while their 2015 balance may have been paid down significantly. For the younger cohorts, they may be just starting to accumulate loans in 2007 but would be near their lifetime high in 2015. Individuals are grouped into four categories. First, there are nonborrowers, which includes about 51 percent of the sample. Individuals with any student loan balance are categorized into three equal-sized groups with low, medium, and high balances. The loan balance categories are separated at $9,396 and $26,605.
Household Formation and Migration
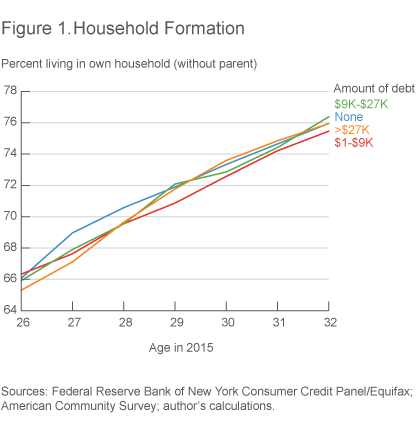
Among the first concerns accompanying the rise of student debt is the dampening effect the debt burden could have on household formation. We can get a sense of how many millennials might not yet have started their own household by noting whether they are living with someone who is old enough to be their parent. The credit panel data includes the ages of other people who are living at the same address with the millennials in the sample. We know from census data that when we observe a young adult (26 to 32) living with a substantially older adult (16 or more years older), the older adult is the young person’s parent in eight cases out of ten.
Figure 1 shows the percentage of borrowers of each age who are not living with their parents, grandparents, or another older adult. While this estimate of household formation displays a strong relationship to age, there are only small differences between those who have borrowed nothing, a small amount, or a large amount via student loans. At each age, borrowers carrying more than $26,605 in student-loan debt are more likely to have formed their own household than people who are just one year younger and have no student debts. In other words, a heavy student loan burden might be delaying household formation by a year at most.
As millennials move out to form their own households, their student debts do have a relationship with how far away they land. Those with more debt are more likely to move farther away. Twenty-five percent of the individuals with $0 in student-loan debt moved to a different metro area between 2007 and 2015 (table 1), while 39 percent of those with over $26,605 in student-loan debt did.
Table 1. Within and between Metro-area Mobility, 2007-2015
| Amount borrowed |
Same neighborhood |
Different neighborhood |
Different metro area |
|---|---|---|---|
| None | 36.3 | 38.7 | 25.0 |
| $1-$9K | 30.7 | 40.0 | 29.3 |
| $9K-$27K | 27.5 | 39.2 | 33.3 |
| > $27K | 25.8 | 34.8 | 39.4 |
Sources: Federal Reserve Bank of New York Consumer Credit Panel/Equifax; author’s calculations.
Moving to Better Neighborhoods
By observing the characteristics of the neighborhoods in which both movers and nonmovers live, we can investigate whether the millennials in the sample have realized some degree of socioeconomic mobility. To measure upward mobility, we focus on two characteristics of neighborhood quality—the share of residents with a college degree and median neighborhood income.
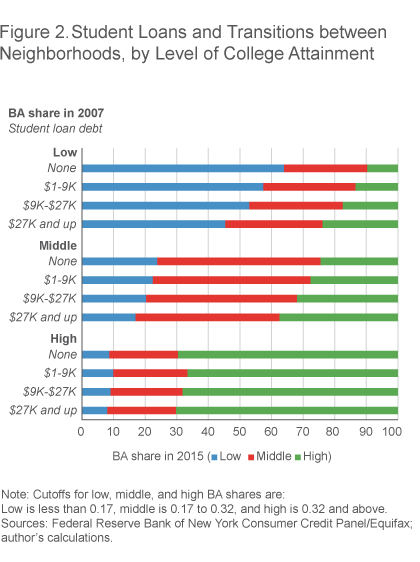
Of the young people who were living in highly-educated neighborhoods in 2007 (where over 32 percent of adults held a college degree), a large majority were still living in highly-educated areas eight years later (figure 2). For these people, there appears to be little relationship between borrowing and movement to other types of neighborhoods. In contrast, for young people who were living in areas with either midrange or low levels of educational attainment, there is a clear positive correlation between student-loan borrowing and moving to a neighborhood with more educated neighbors.
If we repeat the same exercise with income levels, we find that the mobility impacts of student loans are more concentrated among young people who started off in low-income neighborhoods (figure 3). To do this calculation, we first divide neighborhoods into three categories based on median household income: a bottom quarter, a middle half, and a top quarter.
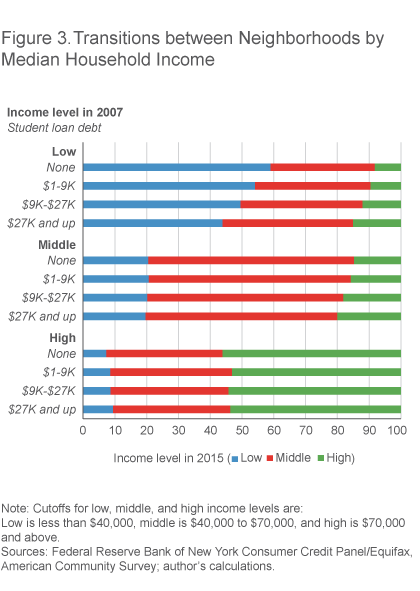
For young people who were living in an upper-income neighborhood in 2007, the percentages in each category of neighborhood in 2015 are roughly the same regardless of the individuals’ student loan balances. For young people who were in middle-income neighborhoods, the share that has moved up a category rises from 15 percent to 20 percent as the student loan balances rise. For young people from low-income neighborhoods, the probability of moving to a middle- or upper-income neighborhood is higher if the individual borrows more.
It is notable that all subgroups except one have a greater than 50 percent chance of living in the same type of neighborhood at the beginning and end of the period: Students who were living in a low-income neighborhood in 2007 and who borrowed more than $26,605 for school are able to leave their low-income neighborhood 56 percent of the time. Overall, the percentage of young people who take on student debt and move out of a low-income neighborhood is quite small. They are only 5.1 percent of the sample and only 0.18 percent of the general population.
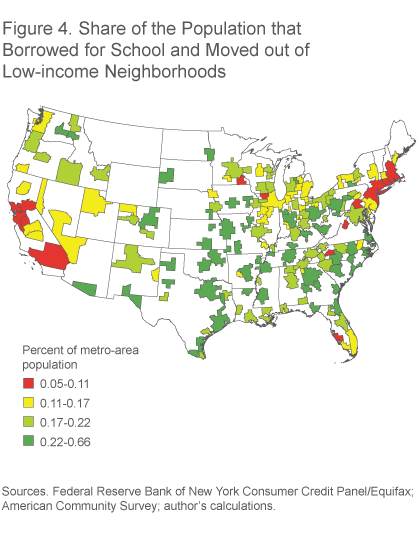
The discussion of mobility leads to a question of geographic variation. Are there some regions where this upward socioeconomic mobility is more likely to happen? A look at figure 4 shows that higher shares of these upwardly mobile borrowers are found in the South and some parts of the Midwest (Columbus, Indianapolis, Kansas City). Relatively few upwardly mobile millennials are found in the Northeast corridor and California despite the high median household incomes in those areas. Of the country’s large metro areas (above 500,000 people), those with the highest shares of upwardly mobile millennials are Lexington (0.36 percent), Little Rock (0.37 percent), and Des Moines (0.38 percent).
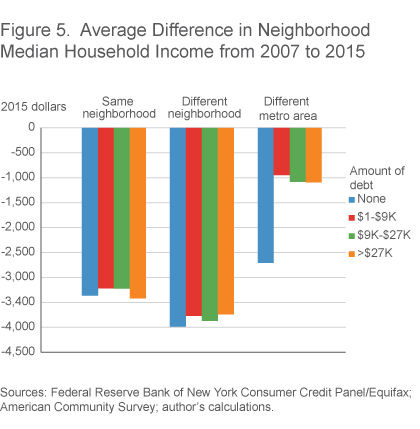
Over this same time period we have been investigating, most neighborhoods’ median real incomes fell. The typical census tract decline in real median income was $3,293. Young people who stayed in the same neighborhood from 2007 to 2015 experienced declines in their neighborhood’s real income that reflect the declines seen nationwide, regardless of student borrowing. Young people who moved to another neighborhood in the same metro area actually experienced an additional decrease in the median household income of their neighborhood.
Given the varying labor markets in different metro areas, we might ask if investing in human capital is a substitute or complement for migration. That is, can people improve their neighborhood incomes as much by moving as they can by getting more education, or can they improve even more by doing both?
As measured by differences in neighborhood income, it appears that moving and studying are complementary. Individuals who borrowed for school and moved to another metro area realized a gain of $1,758 in neighborhood median income between 2007 and 2015 over people who did neither. Those who borrowed but did not leave their metro area realized an average gain of just $250 more.
At the same time, migration appears to be a substitute for education for some. Individuals who did not borrow but who moved did slightly better—in that their neighborhood incomes fell less—than those who borrowed heavily and did not move. Migrants with no debt experienced a decline of $2,708 in neighborhood median income, while high-level borrowers who did not move experienced a decline of $3,417 (figure 5). However, this difference could be driven in part by interregional migrants who managed to complete their degrees with no student debt.
Homeownership
Another of the concerns voiced about the increase in student loans is that the debt burden will prevent borrowers from purchasing homes. Mortgage balances are reported in the credit panel data, and positive balances can serve as a measure of homeownership.
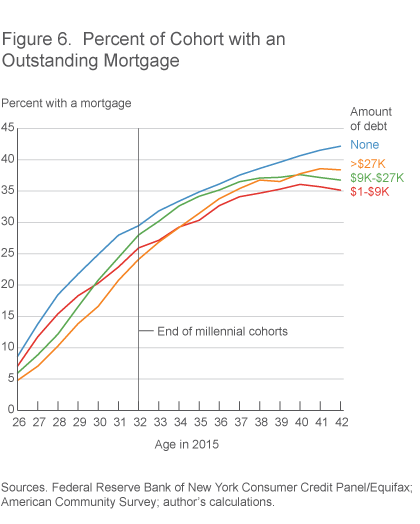
Among the 26 to 32 year-old cohorts, people with no student debt have the highest homeownership rates. We might suspect that this advantage is based on timing. People who start their careers after high school might soon be ready to commit to a location and a mortgage payment. Young people who pursue graduate degrees and professional careers that require relocation would delay home buying.
Figure 6 below extends the comparison to people who are older than the oldest millennials. For cohorts in their late twenties, lower student loan balances are associated with a higher likelihood of having a mortgage. The ordering completely reverses between the ages of 30 and 40. However, while people with mid and high levels of student-loan debt catch up to people with small balances, the age trends suggest that nonborrowers may have a permanent advantage in homeownership. The share of individuals with a mortgage is continuing to increase for nonborrowers over age 40, but it plateaus for borrowers. As we will see below, this was not the case a decade ago.
Have Advantages for Student Borrowers Risen as Much as Debt Levels?
So far, we have looked at differences between millennials who took out student loans and those who did not. However, we do not know whether or not the favorable outcomes for student borrowers have been improving as the debt levels have grown.
To observe a cross section with lower levels of debt throughout the distribution, we repeat the analysis with earlier cohorts who borrowed less. If the gaps in outcomes between heavy borrowers and nonborrowers have shrunk from earlier to later cohorts, it would suggest that the higher levels of debt carried by the later cohorts could be creating a drag on borrowers’ upward mobility. The limitation of this comparison is that the earlier cohorts graduated into a much stronger economy, so it is not clear what portion of the differences are due to student loans specifically. The results suggest that heavy student loan borrowers are still better off by most measures, but their advantages over nonborrowers have declined. Table 2 summarizes several of the main findings for both sets of cohorts.
Table 2. Outcomes for Earlier and Later Cohorts
| 1975–1981 cohorts (observed in 1999 and 2007) |
1983–1989 cohorts (observed in 2007 and 2015) |
|||||
|---|---|---|---|---|---|---|
| Top third of borrowers | Nonborrowers | Difference | Top third of borrowers | Nonborrowers | Difference | |
| Household Formation (percent with no coresident adult 16+ years older) | 82.2 | 82.3 | –0.1 | 72.9 | 72.2 | 0.8 |
| Migrated to a different metro area, percent | 52.9 | 32.5 | 20.4 | 39.5 | 25.0 | 14.5 |
| Percent of those initially in a low-education neighborhood who moved up | 71.5 | 53.5 | 18.0 | 54.6 | 36.0 | 18.6 |
| Percent of those initially in a low-income neighborhood who moved up | 69.2 | 51.3 | 17.9 | 56.1 | 41.0 | 15.2 |
| Change in neighborhood household income (in dollars) for migrants to a different metro area | 7,644 | 4,679 | 2,965 | –1,094 | –2,708 | 1,614 |
| Homeownership (percent with an outstanding mortgage) | 31.2 | 29.9 | 1.3 | 16.0 | 19.8 | –3.9 |
Sources: Federal Reserve Bank of New York Consumer Credit Panel/Equifax; American Community Survey; author’s calculations.
The rate of household formation fell for high-level borrowers across the two sets of cohorts (from 82 percent to 73 percent), but the difference between these borrowers and nonborrowers in each set of cohorts remains less than one percentage point. In terms of the probability of moving to another metro area, the gap between nonborrowers and high-level borrowers was greater for the earlier cohorts.
Young people who started off in neighborhoods with lower levels of education in the later cohorts were much less likely to move to neighborhoods with higher levels of education. Again, borrowers in early cohorts, who borrowed less than those in later cohorts, were more likely to move up to more educated neighborhoods. Moving from a low-income neighborhood to a middle- or upper-income neighborhood also appears to have become more difficult for the later cohorts. The decline in movement to higher-income neighborhoods was greater for top-tier borrowers, and their advantage over nonborrowers declined by 2.6 percentage points (compared to 17.9 percent in the earlier cohorts).
Changes in neighborhood income were more advantageous for people who moved from one metro area to another in both cohorts, but the increase in income obtained by moving fell in the later cohort (in inflation-adjusted terms). The increase in neighborhood income realized by young people who both borrowed heavily and migrated was $7,644 in 2007 (end of the earlier cohort), and that was $2,965 more than the gains of the nonborrowers who migrated. By 2015, that difference had declined to $1,614.
Finally, there is an interesting reversal that coincides with the unraveling of the housing boom. People aged 26 to 32 in 2007 were more likely to own a home if they also had high student debts. By 2015, this relationship had reversed, and people with the highest student loans were less likely to own a home compared to nonborrowers by 3.9 percentage points. If we disaggregate the early cohorts (as in figure 6), all types of borrowers catch up to nonborrowers between the ages of 26 and 30. In 2007, student loan borrowers older than 30 consistently had higher rates of homeownership.
Returning to the question of whether the gains realized by student borrowers have improved as levels of student debt have risen, the evidence is not encouraging. By every measure examined here, today’s most endebted student borrowers are less mobile and upwardly mobile than the top-third borrowers of the last decade. The observed advantages of heavy borrowers over nonborrowers have either remained steady or declined.
Conclusion
In general, we would expect student-loan borrowing to be positively correlated with measures of mobility and upward social mobility, since student debt supports the acquisition of skills and education. The analysis presented here suggests that this continues to be the case, despite the heavy debt burdens young adults are now carrying.
As measured by household formation and moving to better neighborhoods, our findings here suggest student debts have not become so burdensome that they undo the advantages of higher skills. Millennials with student loans are still more likely to be upwardly mobile than nonborrowers. However, the advantages do seem to have declined somewhat since 2007. Student-loan borrowers are now less likely to purchase a home than nonborrowers. These challenges may be caused by the debt itself, or they may reflect the relatively weak economic recovery.
Suggested Citation
Whitaker, Stephan D. 2015. “Are Millennials with Student Loans Upwardly Mobile?” Federal Reserve Bank of Cleveland, Economic Commentary 2015-12. https://doi.org/10.26509/frbc-ec-201512
This work by Federal Reserve Bank of Cleveland is licensed under Creative Commons Attribution-NonCommercial 4.0 International

