

What’s Gone Wrong (and Right) in the Industrial Heartland?
The historically Midwestern manufacturing region, sometimes referred to as the “Rust Belt,” faced another challenging period after 2000 when manufacturing employment declined by 1.2 million jobs. This Commentary investigates the relative economic performance of this region versus other US metropolitan areas during and following these job losses. The analysis shows that while unemployment rates have recovered in the metro areas of the industrial heartland, other economic indicators lag behind the manufacturing-intensive metro areas outside of the region.
The views authors express in Economic Commentary are theirs and not necessarily those of the Federal Reserve Bank of Cleveland or the Board of Governors of the Federal Reserve System. The series editor is Tasia Hane. This paper and its data are subject to revision; please visit clevelandfed.org for updates.
The industrial Midwest, often referred to disparagingly as the “Rust Belt,” has long been recognized both as a distinct economic region and an important contributor to the US economy. In 1969, the region accounted for about a third of all US manufacturing employment despite containing less than a quarter of the US population. Since 1969, manufacturing as a share of total employment in the region has declined significantly, as it has in other parts of the United States, but to this day, most of the Midwest remains relatively manufacturing-intensive.
Prior research has emphasized the role that losses in the manufacturing sector have played in the economic weakness of several Midwestern states and cities, particularly in the late 1970s and early 1980s. In recent years, the region has again experienced economic challenges and received extra attention in the public discourse, but there are no official measures either of the region’s actual performance or of the potential connections of the region’s performance to its manufacturing roots. A recently published Federal Reserve Bank of Cleveland analysis (Schweitzer 2017), from which this Commentary draws, seeks to address these gaps.
The analysis begins by precisely defining the boundaries of the region, designating it the industrial heartland. Next the analysis clarifies the region’s economic performance during and following two periods of decline in manufacturing employment, one dating from the late 1970s to the early 1980s, and the other from 2000 to 2010. Results show that the region’s economic performance is related to the trend decline in manufacturing employment. In terms of getting the population back to work after the two major shocks to manufacturing employment, the region has performed well, but on other measures, such as per capita income, the region has fared less well than other manufacturing-intensive areas.
The Industrial Heartland
No official definitions exist for the Rust Belt, the industrial Midwest, or the industrial heartland, despite frequent use of these terms and abiding interest in the region. Schweitzer (2017) starts with Safford’s (2009) definition of the Rust Belt: “… an area of the United States spreading from New York through Pennsylvania and Ohio and on to the shores of Lake Michigan.”1 Using this rough geographical outline, Schweitzer identifies the metropolitan statistical areas (MSAs) within it that had concentrations of manufacturing employment above the US average in 1969 to arrive at his working definition of the industrial heartland. Figure 1 shows the included MSAs.2
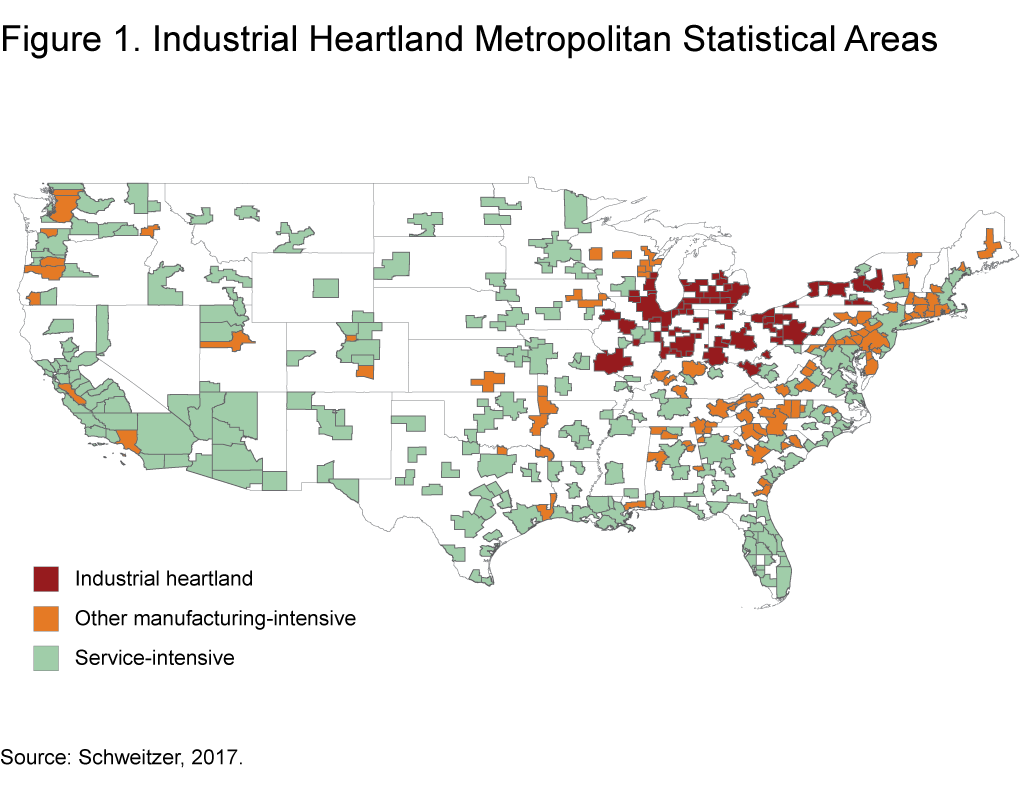
This simple definition of the industrial heartland includes 64 of the nation’s 382 MSAs.3 For comparison purposes, Schweitzer splits the remaining 318 MSAs into two categories—“other manufacturing-intensive” and “service-intensive”—based on whether their shares of 1969-derived manufacturing fell above or below the national average. The other manufacturing-intensive category includes 95 MSAs that are outside of the industrial heartland and that had shares of earnings from manufacturing above the national average in 1969. These represent a set of MSAs similarly exposed historically to national manufacturing declines but which are, by definition, outside of any purely regional impacts associated with the industrial heartland. Finally, the service-intensive category includes 223 MSAs lying outside the industrial heartland region. These MSAs had concentrations in manufacturing below the national average in 1969.
Manufacturing Employment Losses
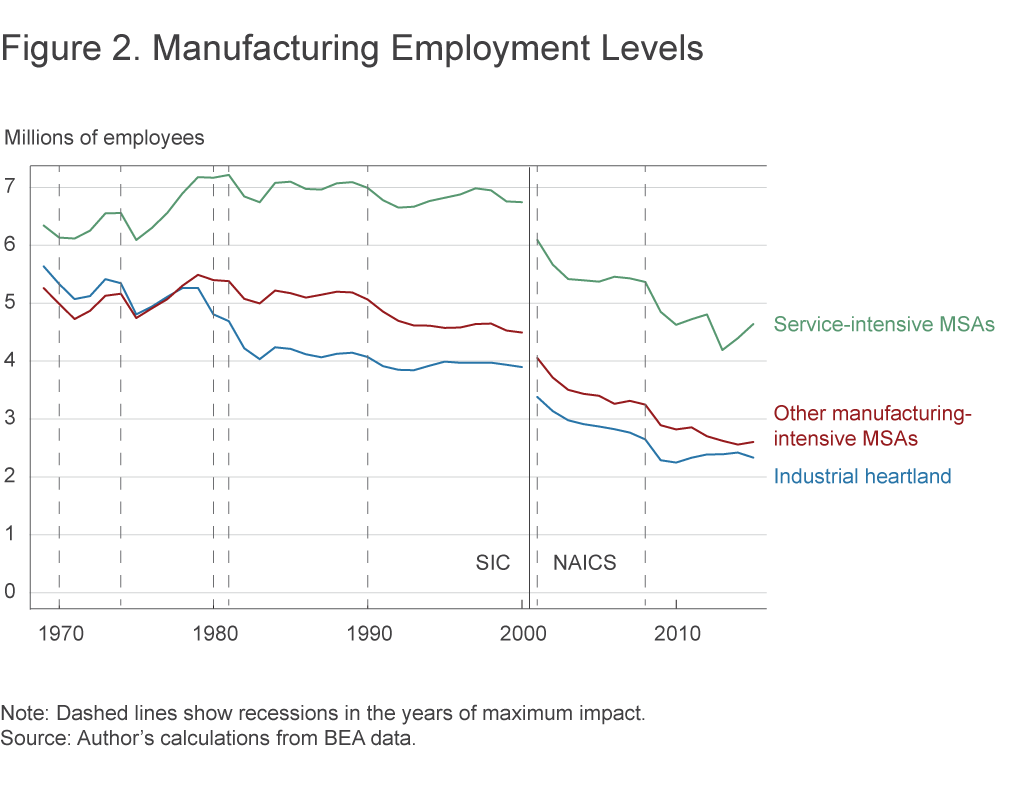
Manufacturing employment has changed dramatically over time in the three types of MSAs, both in terms of levels and location (figure 2).4 From 1979 to 1983, the industrial heartland was hit by its first major shock as manufacturing employment in the region declined by 1.2 million jobs. Declines in the other two types of MSAs occurred but were considerably smaller, and manufacturing employment recovered a larger fraction of its losses. A second major decline in manufacturing employment occurred from 2001 to 2010, and while this episode was longer than the first and the decline in manufacturing employment occurred more slowly, the loss in manufacturing jobs in the industrial heartland was as large as during the first shock—1.2 million. Moreover, while the other two sets of MSAs also experienced large declines in manufacturing jobs during the second episode (1.2 million in other manufacturing-intensive MSAs and 1.5 million in the service-intensive MSAs), they largely recovered from the declines. Through all of the change and diversification in manufacturing across regions, the industrial heartland remains in 2015 the most manufacturing-intensive of the three sets of MSAs, with 20 percent of its earnings derived from manufacturing after 2009.
The Effect of Manufacturing Losses on Regional Economies
To calculate the effects of manufacturing employment losses on a number of economic outcomes within the MSAs, Schweitzer (2017) conducts a regression analysis. Results of the regression reveal that larger manufacturing employment losses were associated with weaker nonmanufacturing employment growth, a larger rise in unemployment, and weaker per capita income growth during and after both episodes of manufacturing employment declines. To ensure that the analysis is not just associating the general decline in manufacturing with other broad trends in the US economy, the analysis uses only variation between metro areas to identify the effect. So while manufacturing employment declined for most MSAs in both periods, the model ignores the general declines and associates only larger declines with larger effects (and smaller declines with smaller effects) on other employment, unemployment, and per capita income. The analysis also identifies cases in which the measured effects are larger in the industrial heartland, indicating that there may be important differences in outcomes by region. While the statistical analysis is important to show that the results are reliable, the key results for these distinct sets of MSAs can be illustrated in three simple figures.
Total Employment Has Grown Less in the Industrial Heartland
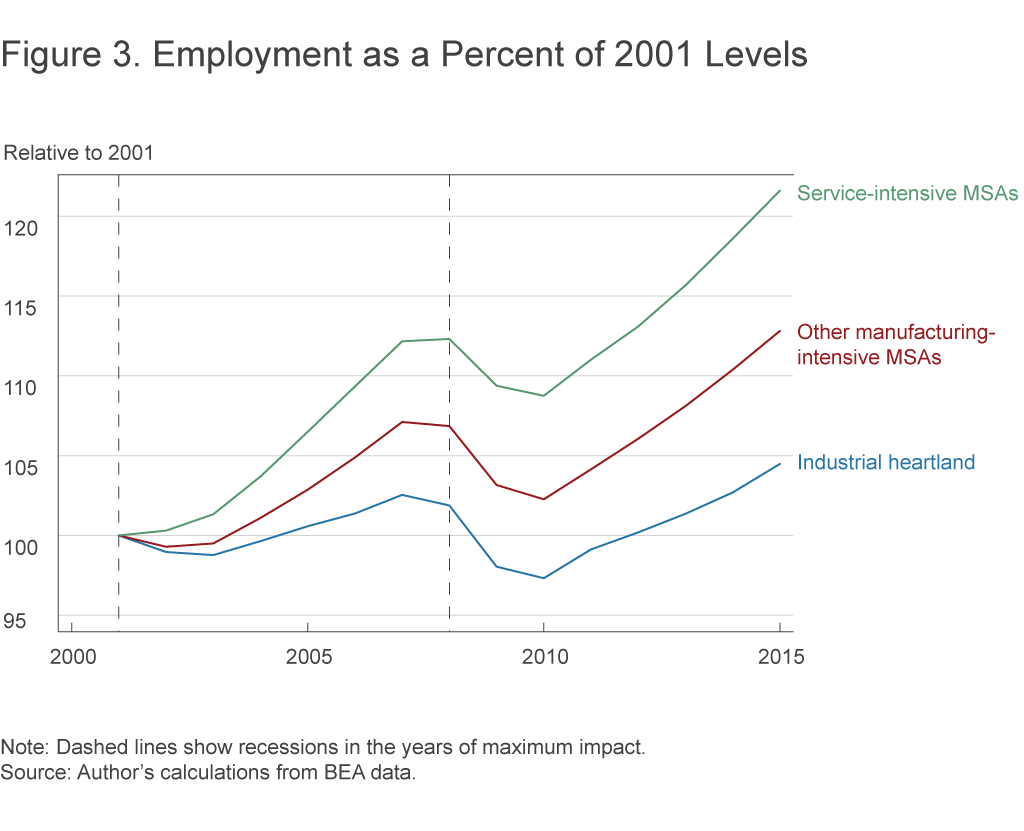
Total employment in the industrial heartland recovered far more slowly from the 2001 recession than in the two other groups of MSAs. By 2007, employment in the region had risen only 2.6 percent above its 2001 level, compared to 7.2 percent in other manufacturing-intensive MSAs (figure 3). The Great Recession pulled down employment throughout the United States, particularly in construction-heavy MSAs, but the employment growth disparities between the industrial heartland and other manufacturing-intensive MSAs and the service-intensive MSAs have continued to grow.
Most employment in all metro areas is not in the manufacturing sector, so total employment trends depend primarily on the amount of nonmanufacturing employment growth. However, to the extent that losses in manufacturing employment are positively correlated with losses in nonmanufacturing employment, these trends can have outsized effects. Indeed, the regression analysis revealed that places with greater manufacturing employment losses also experienced substantially weaker nonmanufacturing employment growth. Moreover, the results reveal that the MSAs of the industrial heartland experienced sharper nonmanufacturing employment effects for a given loss in manufacturing employment than the other two types of MSAs. Thus, the sharper response to employment losses in manufacturing in the industrial heartland helped to accentuate the differences in total employment performance in the industrial heartland and in the other groups of MSAs.
Despite Weak Employment Growth, Unemployment Has Generally Converged back to Low Levels
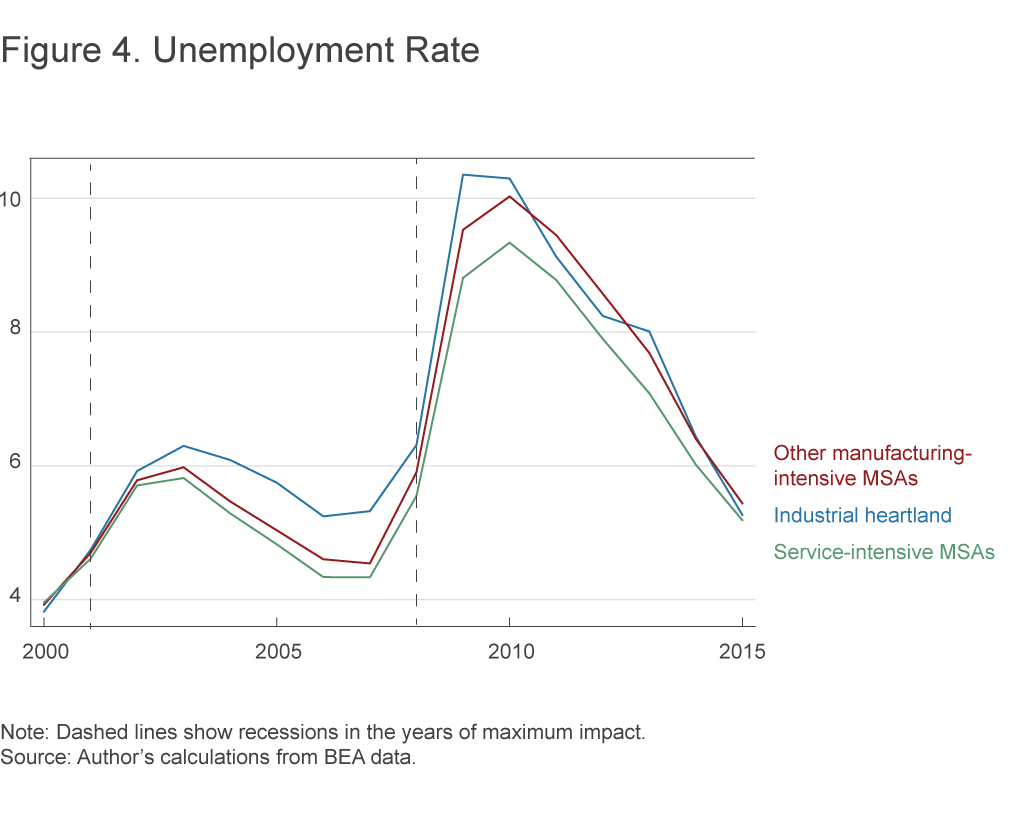
Unemployment rates are, not surprisingly, boosted by manufacturing employment losses during the periods when they occur, but those increased unemployment rates tend to be reversed in the subsequent five-year periods. This pattern was one of the highlights of the prior work on regional shocks that focused on the manufacturing job losses in the Rust Belt in the late 1970s.5 This pattern is again evident during and following the manufacturing employment decline from 2001 to 2010 (figure 4). Indeed, while both the industrial heartland and other manufacturing-intensive MSAs saw relatively elevated unemployment rates in 2010, unemployment rates in these two sets of MSAs have fallen more steeply over the subsequent five years and are now very close to the average unemployment rate of the service-intensive MSAs. So the good news is that, despite weaker employment growth in the industrial heartland, labor markets have gradually tightened in the region as in the rest of the nation.
Unemployment rates can decline even if employment growth is weak, provided weak gains in employment are offset by slower growth in the workforce (or even by outright contractions). Schweitzer (2017) shows that population growth has been much slower on average in the industrial heartland region during and following the second decline in manufacturing employment. However, in the case of population growth, only a small portion of the difference in the regional population growth rates is associated with MSAs with larger manufacturing employment losses. Weaker population growth has been experienced in most industrial heartland MSAs regardless of the size of the manufacturing losses.
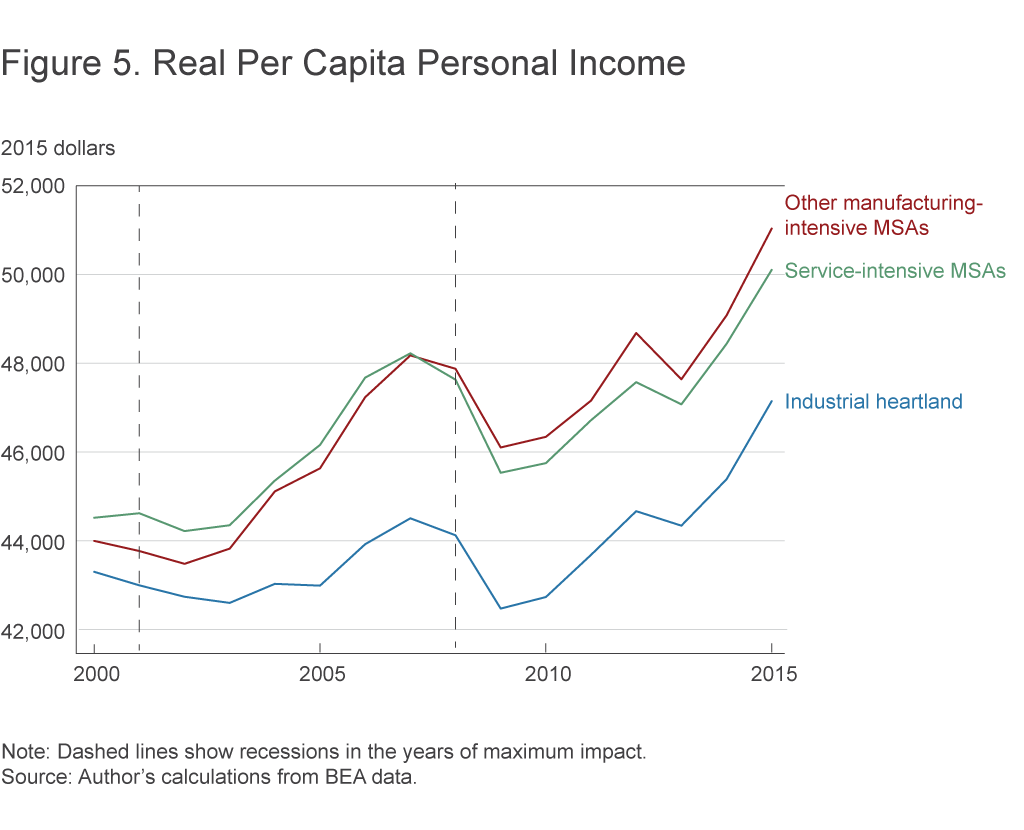
Real Per Capita Income Trends Diverged Beginning in the 2000s
The industrial heartland had a reputation in the 1950s and 1960s as a relatively high-income region; however, Bureau of Economic Analysis data generally show that incomes in the three groups of MSAs were actually quite close to each other from 1969 to the late 1990s.
During the period of steep manufacturing losses from 1979 to 1983, industrial heartland incomes fell to 3.4 percentage points below the national average, but this disadvantage gradually declined to 0.7 percentage points by 1997. During the 2001 to 2010 period, however, the gap between the industrial heartland’s income level and the income levels of the other two groupings of MSAs widened considerably, as shown in figure 5. In 2000, the industrial heartland MSAs had an average per capita income that was 2.4 percentage points below the national average, but by 2007 this had ballooned to 6.8 percentage points. Relative to the other manufacturing-intensive MSAs, the industrial heartland’s income level was more than 8 percentage points lower in 2007. Since 2008, small relative gains in the income levels of the industrial heartland have been realized, but the gaps between the industrial heartland and both the nation and the other manufacturing-intensive MSAs were still large in 2015: 5.7 percentage points and more than 8 percentage points, respectively.
The regression analysis of both periods of concentrated manufacturing employment losses shows that MSAs with larger losses in manufacturing employment had significantly weaker per capita income growth, and MSAs with smaller losses experienced stronger per capita income growth. This result suggests that manufacturing employment losses were likely a factor in relative income growth in the different sets of MSAs. While reduced income growth following manufacturing job losses is identified as a statistically significant source of the differences in income observed across the three types of MSAs, the size of the shocks and the estimated effects are again notably larger in the industrial heartland than in other manufacturing-intensive MSAs and service-intensive MSAs.
Concluding Thoughts
That the period from 2001 to 2010 was not a robust period of growth in the industrial heartland is not a new observation. However, my analysis on the specific set of MSAs comprising the region clarifies the scale and the nature of the industrial heartland’s weaker economic performance.
While employment gains were notably lower in both the industrial heartland’s manufacturing sector and its nonmanufacturing sector, labor markets in all of the region’s MSAs still typically recovered to the point where unemployment rates are now near the national average. That said, real per capita income, which is primarily derived from wages and salary income, grew much more slowly in the industrial heartland than in other parts of the United States in the 2000s. The gap between incomes in the region and in other parts of the country remained historically large through 2015.
Many of these effects are highly correlated with manufacturing losses. Importantly, there are informative differences in the economic performance of individual MSAs in the region, which are demonstrated in additional performance analyses that have been undertaken by the Cleveland Fed for the Cleveland, Pittsburgh, and Cincinnati MSAs (forthcoming). Nonetheless, there is still much to learn about why this region, defined as it is around its historical connection to manufacturing, has not performed more similarly in recent years to other manufacturing-intensive areas of the United States.
Footnotes
- Sean Safford (2009) page 3. Return to 1
- While some counties that currently have substantial manufacturers are excluded from this definition, we are aiming for a 1969 definition. Because today’s MSA boundaries include many counties that were previously viewed as mostly rural, the level of concentration in the early period is probably understated. Using MSAs instead of counties also avoids most nondisclosure problems. BEA data outside metropolitan areas is more frequently subject to nondisclosure rules that suppress employment figures when there are only a small number of employers in a given industry. Return to 2
- All of these MSAs, except Terre Haute, Indiana, and Wheeling, West Virginia, had above-average levels of manufacturing intensity in 1969. These two MSAs were included because they appear in most descriptions of the region and they did have significant manufacturing employment in 1969. Return to 3
- One complication in these data series is the change from the SIC coding system to NAICS in 2001. This change (shown in figure 2) causes a discrete shift down in the number of manufacturing jobs and income produced in the sector. It is important to be aware of this coding shift and to avoid comparisons across the shift. Return to 4
- Notably, Feyer, Sacerdote, and Stern (2007) and Blanchard and Katz (1992). Return to 5
References
- Sean Safford, 2009. Why the Garden Club Couldn’t Save Youngstown. Harvard University Press.
- Feyer, James, Bruce Sacerdote, and Ariel Dora Stern, 2007. “Did the Rust Belt Become Shiny? A Study of Cities and Counties That Lost Steel and Auto Jobs in the 1980s.” Brookings-Wharton Papers on Urban Affairs, 2007: 41-102.
- Blanchard, Olivier, and Bruce Katz, 1992. “Regional Evolutions,” Brookings Papers on Economic Activity, 1992(1): 1-75.
- Schweitzer, Mark E., 2017. “Manufacturing Employment Losses and the Economic Performance of the Industrial Heartland,” Federal Reserve Bank of Cleveland Working Paper, no. 17-12.
Suggested Citation
Schweitzer, Mark E. 2017. “What’s Gone Wrong (and Right) in the Industrial Heartland?” Federal Reserve Bank of Cleveland, Economic Commentary 2017-14. https://doi.org/10.26509/frbc-ec-201714
This work by Federal Reserve Bank of Cleveland is licensed under Creative Commons Attribution-NonCommercial 4.0 International


- Share