

The Evolution of US Bank Capital around the Implementation of Basel III
Following the Global Financial Crisis of 2007–2008, the capital standards for banks operating in the United States were tightened as US banking regulators implemented the Basel III framework. This Economic Commentary briefly presents the key elements of Basel III relevant to bank capital and analyzes the timing of the evolution of regulatory capital ratios for US bank holding companies during that time. It shows that, on average, banks’ capital ratios increased notably between 2009 and 2012, plateauing before the new rules came into force. While larger and better-capitalized banks increased capital ratios soon after the financial crisis, it took smaller and less-well-capitalized banks longer on average to start that process.
The views authors express in Economic Commentary are theirs and not necessarily those of the Federal Reserve Bank of Cleveland or the Board of Governors of the Federal Reserve System. The series editor is Tasia Hane. This work is licensed under a Creative Commons Attribution-NonCommercial 4.0 International License. This paper and its data are subject to revision; please visit clevelandfed.org for updates.
Introduction
Bank capital standards are a key pillar of modern banking regulation. They require banks to operate with a minimum amount of capital relative to the loans, securities, and other assets on their balance sheets. This capital, mostly in the form of shareholder equity, is first in line in case of losses, for example, from loan defaults, and thereby provides a cushion to protect depositors and other debt holders in the bank. Shortfalls in bank capital were seen as a contributing factor to the financial crisis of 2007–2008 and the subsequent major recession. In response, regulators across the world sought to tighten regulation following this financial crisis to help prevent future similar crises. These efforts included a tightening of bank capital regulation, requiring banks to hold both more and higher-quality capital, thereby increasing the resilience of the banking system. More recently, following the failures of Silicon Valley Bank and other banks in March 2023, bank capital regulation has once again been under scrutiny, and a new reform package modifying capital requirements, known as “Basel III endgame,” has been proposed by US bank regulators.1
This Economic Commentary presents the evolution of banks’ regulatory capital ratios around the introduction of higher capital requirements that were part of the post-financial crisis Basel III reforms, analyzing the path of capital ratios across groups of different sizes and across the distribution of tier 1 capital ratios both before and after the introduction of this framework. This analysis of capital ratios around an earlier episode of increased capital requirements can be informative for thinking about banks’ possible responses to new capital regulations.
The Tightening of Capital Requirements after 2008 under Basel III
Going into the financial crisis, regulatory capital requirements for banks operating in the United States were based on the Basel II framework published by the Basel Committee on Banking Supervision (BCBS) in 2004. This framework maintained the two main minimum capital ratios of the earlier Basel I framework, first published by the BCBS in 1988: (1) tier 1 capital to risk weighted assets (RWA) of at least 4 percent, and (2) total capital to RWA of at least 8 percent.2 Following the financial crisis of 2007–2008, the regulatory requirements in Basel I and Basel II were widely regarded by banking regulators as deficient, and there was a concerted international effort to strengthen banking regulation, a process which resulted in the Basel III framework published in September 2010 by the BCBS.
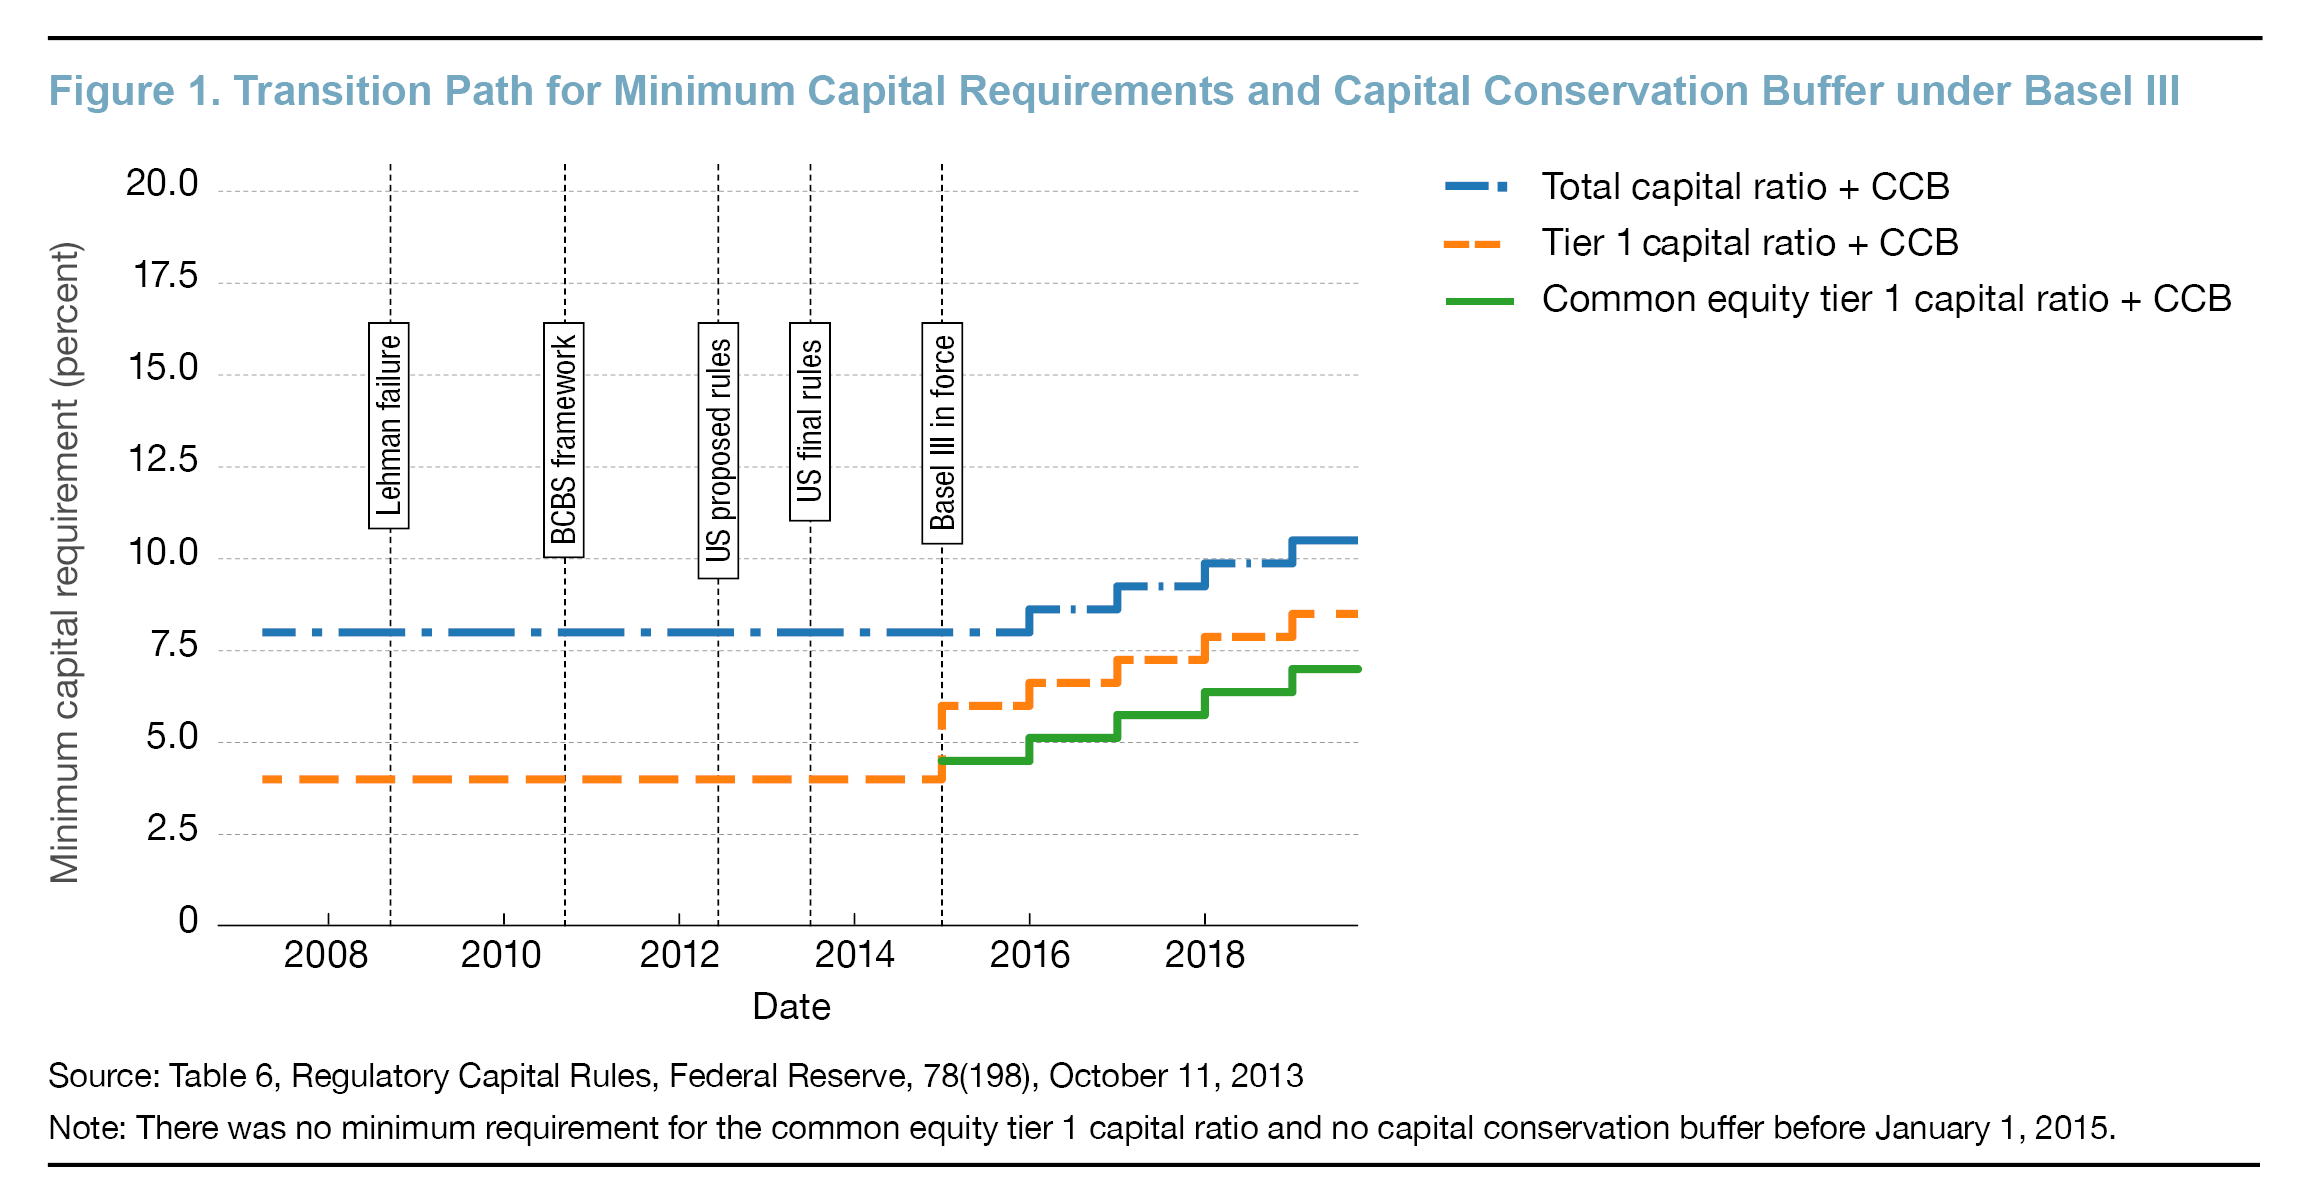
Among other elements of tightening banking regulation, Basel III strengthened minimum capital requirements in several ways.3 First, it introduced a new, narrower category of capital called “common equity tier 1” (CET1) capital with a minimum CET1 capital-to-RWA ratio requirement of 4.5 percent. CET1 capital presents the highest quality regulatory capital, able to absorb losses as they occur. The CET1 measure comprises mostly common stock and retained earnings and does not include the additional instruments that are permitted under the less strict tier 1 capital measure.
Second, Basel III tightened the minimum tier 1 capital ratio, both narrowing what banks could count toward tier 1 capital relative to previously and increasing the existing minimum tier 1 capital-to-RWA ratio from 4 percent to 6 percent. Third, under Basel III, banks are expected to build up various capital buffers on top of these strict minimums, including the capital conservation buffer (CCB) of 2.5 percent applicable to all banks and an additional surcharge for the “global systemically important banks” (G-SIB), the very largest and systemically important institutions.4 The new capital buffers on top of the minimum capital requirements are meant to provide an additional layer of protection and act as an early warning mechanism. A failure to meet the required buffer levels leads to restrictions on payouts, such as dividends and bonuses, and thereby helps to keep earnings within the bank.
In the United States, the Basel rules were implemented by the financial sector regulators including the Federal Reserve, the Federal Deposit Insurance Corporation (FDIC), and the Office of the Comptroller of the Currency (OCC). A proposed rule was published in June 2012 and, following a comment period, the final rule was released in July 2013. The new regulatory capital minimums became binding for most banks on January 1, 2015, while the additional CCB and G-SIB buffers were phased-in between 2016 and 2019, as shown in Figure 1.5 In terms of the minimum tier 1 capital ratio, the new rules implied a jump from 4 percent to 6 percent by 2015, increasing for most banks to 8.5 percent including the capital conservation buffer by 2019, with an additional G-SIB surcharge on top for some of the largest banks.
The Basel III implementation was not the only major revision of bank regulation during the time. In parallel, the largest United States banks were also subject to additional new regulations originating in the Dodd–Frank Act of 2010, including compulsory regulatory stress tests for large banks with more than $50 billion in total assets.
Regulatory Capital Ratios of United States Banks Increased Following the Financial Crisis
How did United States banks’ capital ratios evolve over this period of changes in capital regulation? Figure 2 shows the mean tier 1 capital ratios from 2007 to 2018 for United States bank holding companies above $1 billion in assets. The data are from Federal Reserve quarterly regulatory filings Consolidated Financial Statements for Holding Companies (Y-9C). The sample covers bank holding companies and financial holding companies operating in the United States with at least $1 billion in total assets. For the analysis, the banks are grouped by balance sheet size as measured by total assets, distinguishing between community banks (less than $10 billion), regional banks ($10 billion to $50 billion), and larger banks (more than $50 billion).6
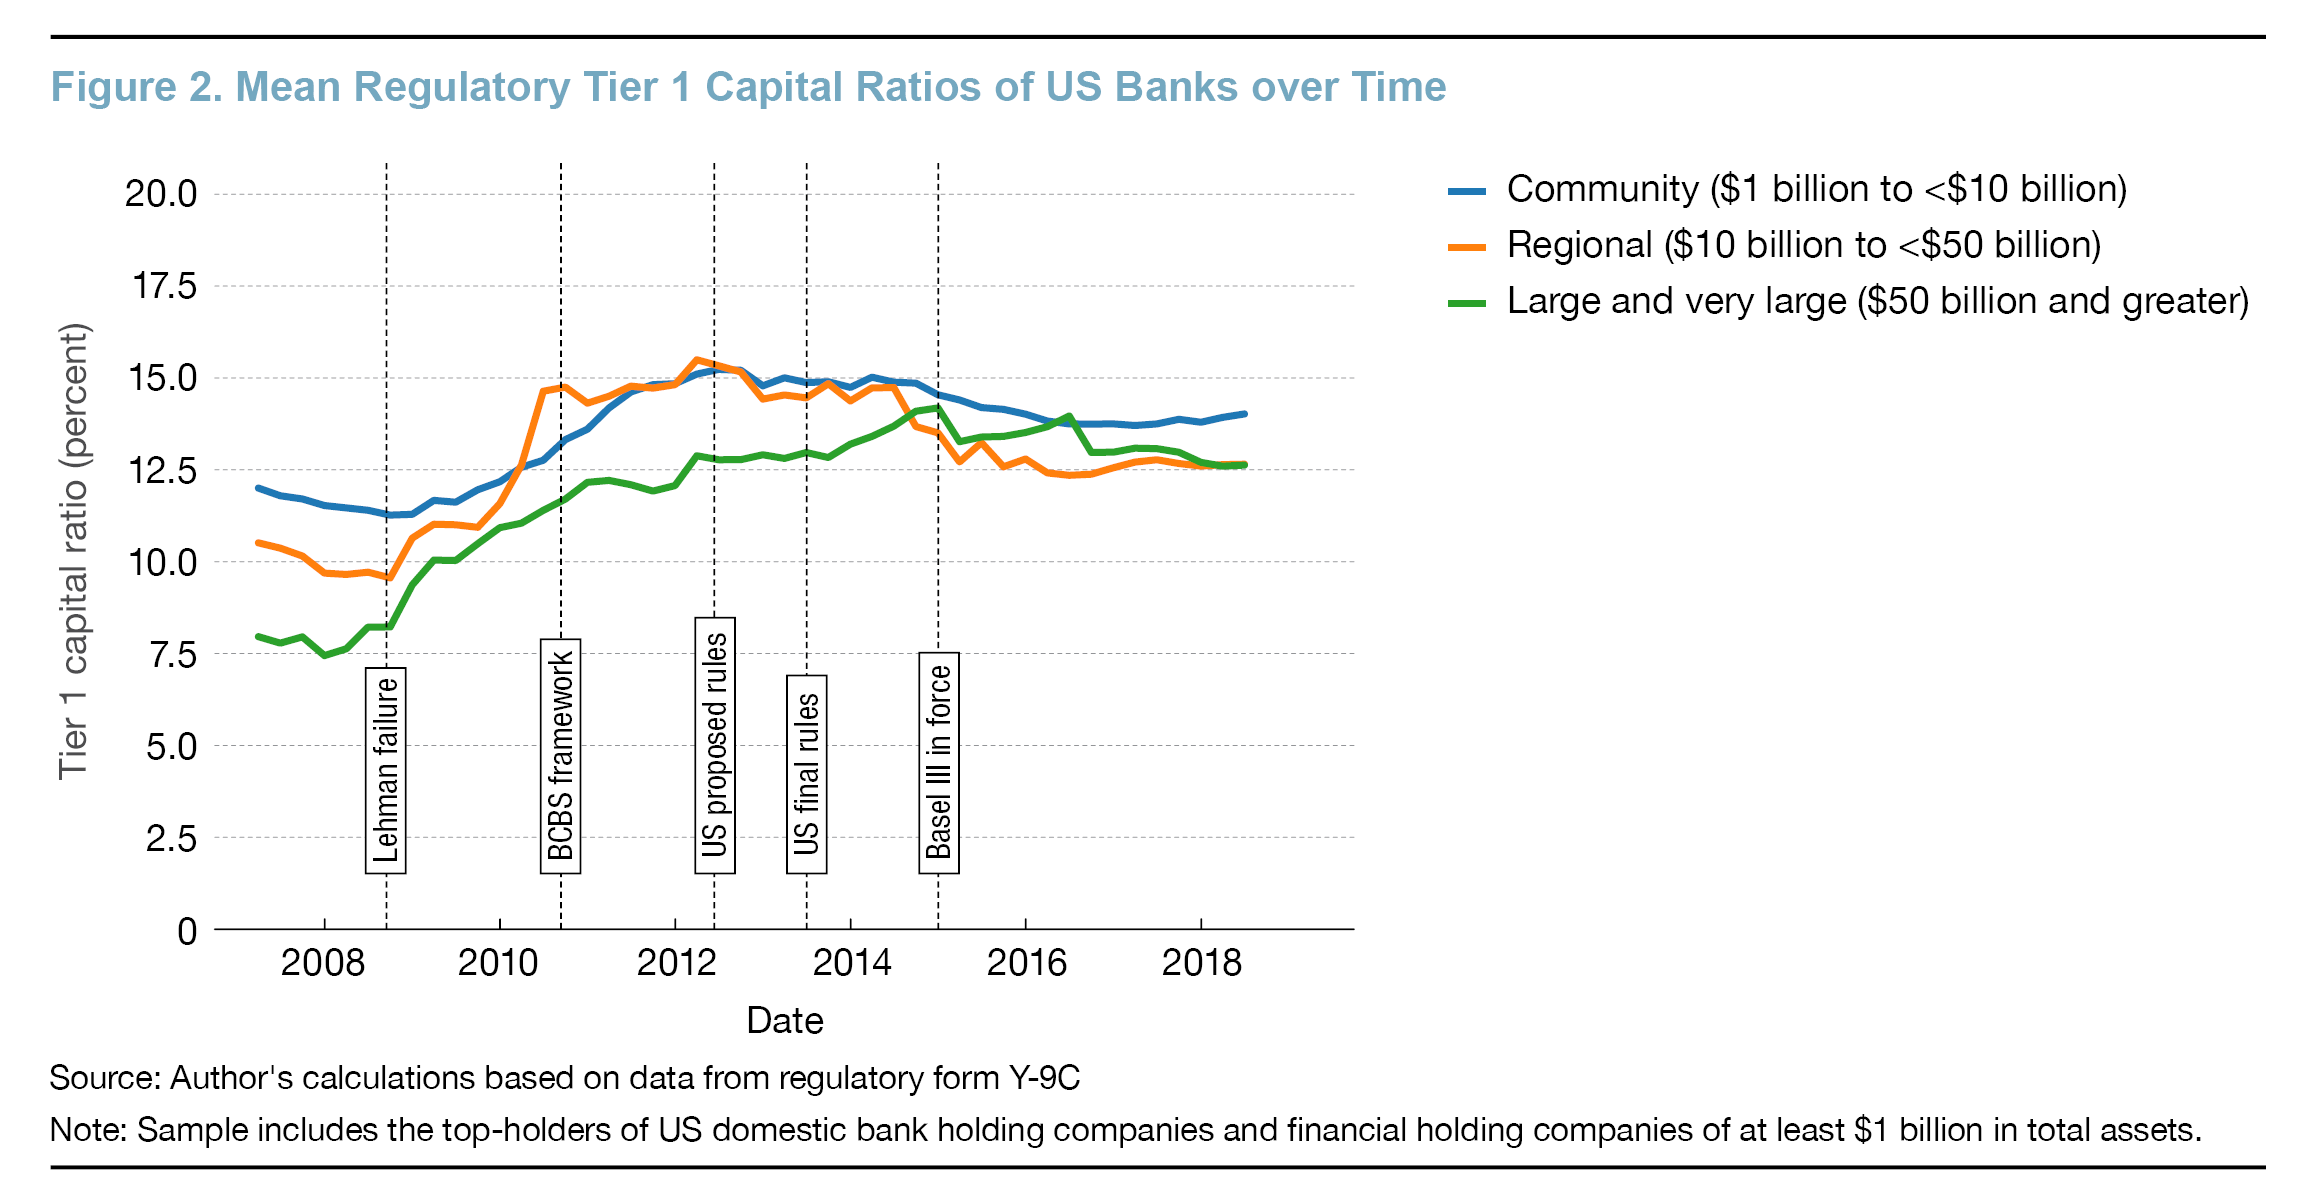
The chart highlights two main features of the data that are informative about the way bank capital ratios have evolved around the financial crisis of 2007–2008 and since. First, across all size groups, average capital ratios increased significantly by up to 6 percentage points in the years following the financial crisis, after having declined slowly in the run up to the crisis. Average capital ratios then run approximately flat or even decline slightly from around 2012 onward. The average tier 1 capital ratios that banks reached in 2012 comfortably exceed the minimum required under Basel III from 2015 of 6 percent for all size groups, even including the CCB of 2.5 percent that was set at zero before 2016 and not fully phased-in until 2019.
Second, prior to the financial crisis, the group of large and very large banks on average had lower tier 1 capital ratios than the smaller regional and community banks. Starting in 2008, this gap began to close as the largest banks increased their tier 1 capital/RWA ratios earlier and by more than the smaller banks; and by 2015, the gap had largely disappeared. Note that the banks above $50 billion in assets were subject to the additional requirements under the Dodd–Frank Act of 2010, notably, mandatory regulatory stress tests, that would have provided a strong incentive to increase capital ratios above the minimum required. In addition, some of the very largest banks were also covered by the additional G-SIB surcharge introduced with Basel III. However, both requirements did not apply to the two groups of banks below $50 billion, groups which nonetheless increased their tier 1 capital ratios significantly and well above the new minimum tier 1 ratio required by Basel III.
Just like capital ratios did not move uniformly across groups of different sizes, there was variation in the evolution of tier 1 capital ratios between banks with stronger and weaker capital positions. To illustrate this variation, Figure 3 plots the time series of tier 1 capital ratios across three points of the distribution. The thick solid line at the center represents the tier 1 capital ratio of the median bank at the 50th percentile, that is, the capital ratio that within each quarter sits right in the middle of the distribution, with 50 percent of banks having lower capital ratios and the other 50 percent having capital ratios that are higher. The thinner dashed lines at the top and bottom of the chart represent the 90th and 10th percentile of the distribution, respectively.
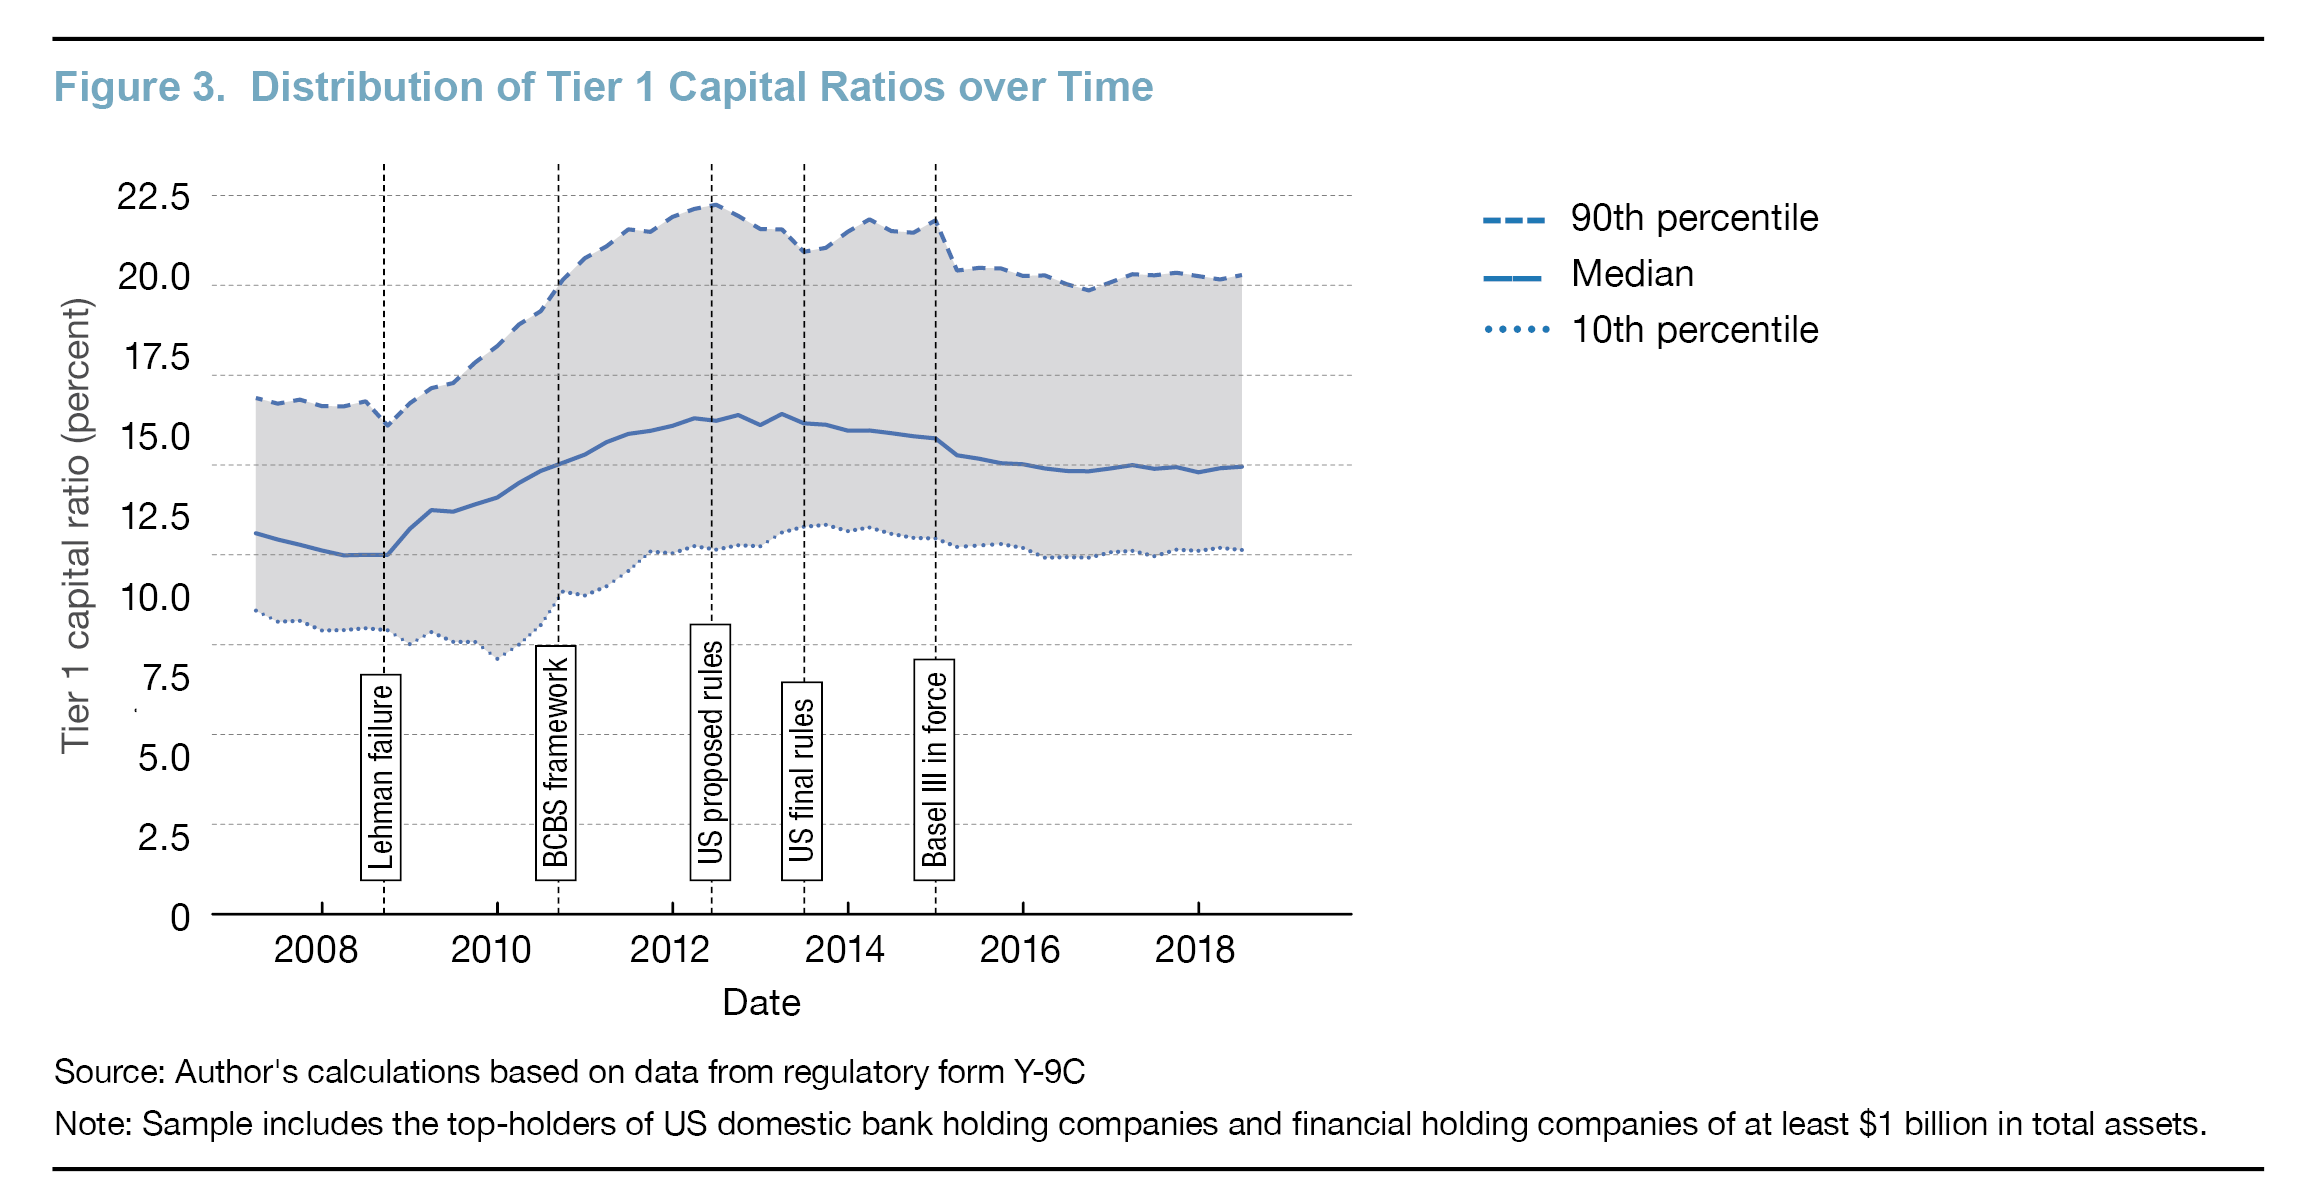
Figure 3 shows that while both the median and the 90th percentile started their post-crisis increase by early 2009, the bottom of the distribution was lagging: the 10th percentile kept falling throughout 2009, reaching a low of below 8 percent, and only started to increase about a year later, in 2010. This lag suggests that banks with lower capital ratios during and shortly after the financial crisis might have found it harder to rebuild their capital ratios afterwards. Having said that, the 10th percentile tier 1 capital ratio stabilized at a level of around 10 percent by 2012, at a similar time as the median and the 90th percentile, and again well before the new, higher capital requirements of Basel III broadly came into force.
Conclusion
This Economic Commentary analyzes the evolution of banks’ regulatory tier 1 capital ratios amid the new stricter capital regulations introduced following the 2007–2008 financial crisis. The new rules were introduced with the objective to make banks and the financial system safer and reduce the risk of a repeat of the crisis. The analysis shows that following the financial crisis of 2007–2008, on average United States banks of all sizes increased their regulatory capital ratios notably, generally to levels well above the required minimums. In addition, the increase in the average tier 1 capital ratios was largely completed by 2012, well before the new, higher capital requirements of Basel III came into force. This series of events is consistent with the view that banks increased their capital ratios preemptively rather than waiting until the rules were binding.
Furthermore, the data suggest that there was significant variation across banks in the timing of these increases in capital ratios. While the larger banks started increasing their tier 1 capital ratios as early as 2008 on average, it took a little longer, until about early 2009, for the smaller community banks to start the process, albeit with the community banks having started the increase from a higher initial level on average. Similarly, while better-capitalized banks started increasing their capital ratios by the end of 2008, less-well-capitalized banks started the process only from 2010 onward.
The overall pattern of increases in tier 1 capital ratios means that the desired outcomes of the Basel III reforms, including higher capital levels and thus safer banks, were at least partly achieved relatively quickly after the rules had been announced. However, the analysis in this article is descriptive and does not speak directly to the causal impact of the Basel III reforms. Nonetheless, the overall message is consistent with the findings in a recent working paper on the effect of the reforms (Fritsch and Siedlarek, 2022). That paper employs a difference-in-differences model to disentangle the effect of the regulations from other factors, exploiting the cross-sectional variation between banks in the extent to which the new rules reduced measured capital levels. It shows that the proposed rules implementing Basel III triggered a response by the affected banks soon after the rules’ publication in June 2012, with banks responding more strongly the more they were affected by the new rules.
The views authors express in Economic Commentary are theirs and not necessarily those of the Federal Reserve Bank of Cleveland or the Board of Governors of the Federal Reserve System. The series editor is Tasia Hane. This work is licensed under a Creative Commons Attribution-NonCommercial 4.0 International License. This paper and its data are subject to revision; please visit clevelandfed.org for updates.
References
- Board of Governors of the Federal Reserve System, Federal Deposit Insurance Corporation, and Comptroller of the Currency. 2023. “Agencies Request Comment on Proposed Rules to Strengthen Capital Requirements for Large Banks.” Joint Press Release. Board of Governors of the Federal Reserve System. July 27, 2023. https://www.federalreserve.gov/newsevents/pressreleases/bcreg20230727a.htm.
- Fritsch, Nicholas, and Jan-Peter Siedlarek. 2022. "How Do Banks Respond to Capital Regulation?—The Impact of the Basel III Reforms in the United States." Working Paper No. 22-11. Federal Reserve Bank of Cleveland. https://doi.org/10.26509/frbc-wp-202211.
- Walter, John. “US Bank Capital Regulation: History and Changes Since the Financial Crisis.” Economic Quarterly 105(1): 1–40. https://doi.org/10.21144/eq1050101.
Endnotes
- See the joint press release by the US bank regulatory agencies, “Agencies Request Comment on Proposed Rules to Strengthen Capital Requirements for Large Banks,” July 27, 2023, available from the Board of Governors at https://www.federalreserve.gov/newsevents/pressreleases/bcreg20230727a.htm. Return to 1
- Tier 1 capital is a measure of “core" capital comprising common stock, retained earnings, and a limited set of additional instruments able to absorb losses on an ongoing basis, that is, before the failure of the bank. Total capital is a wider measure that includes tier 1 capital but also allows for additional capital instruments that absorb losses on a gone-concern basis, that is, when the bank fails and is no longer solvent. Risk-weighted assets provide a measure of the size of a bank balance sheet that is adjusted for differences in risk across different asset classes, with higher weights assigned to riskier asset classes. Return to 2
- See Walter (2019) for a comprehensive discussion of the history of United States bank capital regulation and the post-crisis reforms enacted since 2008. Return to 3
- The Basel III framework identifies G-SIBs based on a set of indicators, including the extent of cross-border activities, size, complexity, interconnectedness, and substitutability in the financial system. Return to 4
- For banks following the so-called “advanced approaches” framework to capital regulation, compliance with the higher Basel III minimum became mandatory one year earlier, on January 1, 2014. The advanced approaches framework is mandatory for the largest and internationally active banking organization with at least $250 billion in total assets or at least $10 billion in foreign exposures and is optional for others. Return to 5
- The sample ends in 2018:Q2 to ensure a consistent population of banks as the filing threshold was increased from $1 billion to $3 billion in total assets from 2018:Q3 onward. Return to 6
Suggested Citation
Siedlarek, Jan-Peter. 2024. “The Evolution of US Bank Capital around the Implementation of Basel III.” Federal Reserve Bank of Cleveland, Economic Commentary 2024-07. https://doi.org/10.26509/frbc-ec-202407
This work by Federal Reserve Bank of Cleveland is licensed under Creative Commons Attribution-NonCommercial 4.0 International


- Share