

How Has Ohio Fared in the Current Business Cycle?
This brief explores how Ohio’s economy has fared in the current business cycle and how it has compared to those of other states by using quarterly GDP data. It also examines the impact of Ohio’s industry differences on its GDP growth.
Introduction
This brief explores through quarterly GDP data how Ohio’s economy has fared in the current business cycle and how its experience has compared to those of other states. In 2015, the Commerce Department released quarterly estimates of state GDP for the first time.1 Previously, state GDP data were only available annually, making them much less useful for the timely monitoring of state business conditions or for understanding how a shock to the US economy was working its way through the country. The Commerce Department cited these reasons as a justification for more frequent production of state GDP data,2 noting in reference to the Great Recession that “The varying economic experiences across the states during the downturn . . . illustrate the need for more timely information on regional economies.” It went on to note that these data are also potentially important to national policymakers as the data alert them to developments that are visible in some states but not yet nationally.
Current Business Cycle
For the current business cycle, Figure 1 traces the time path of inflation-adjusted GDP for the United States and US states. At any given point, the lines in Figure 1 show the cumulative recovery of inflation-adjusted GDP since the economic activity peak at the end of 2019, just before the sharp contraction in activity associated with the COVID-19 pandemic.3
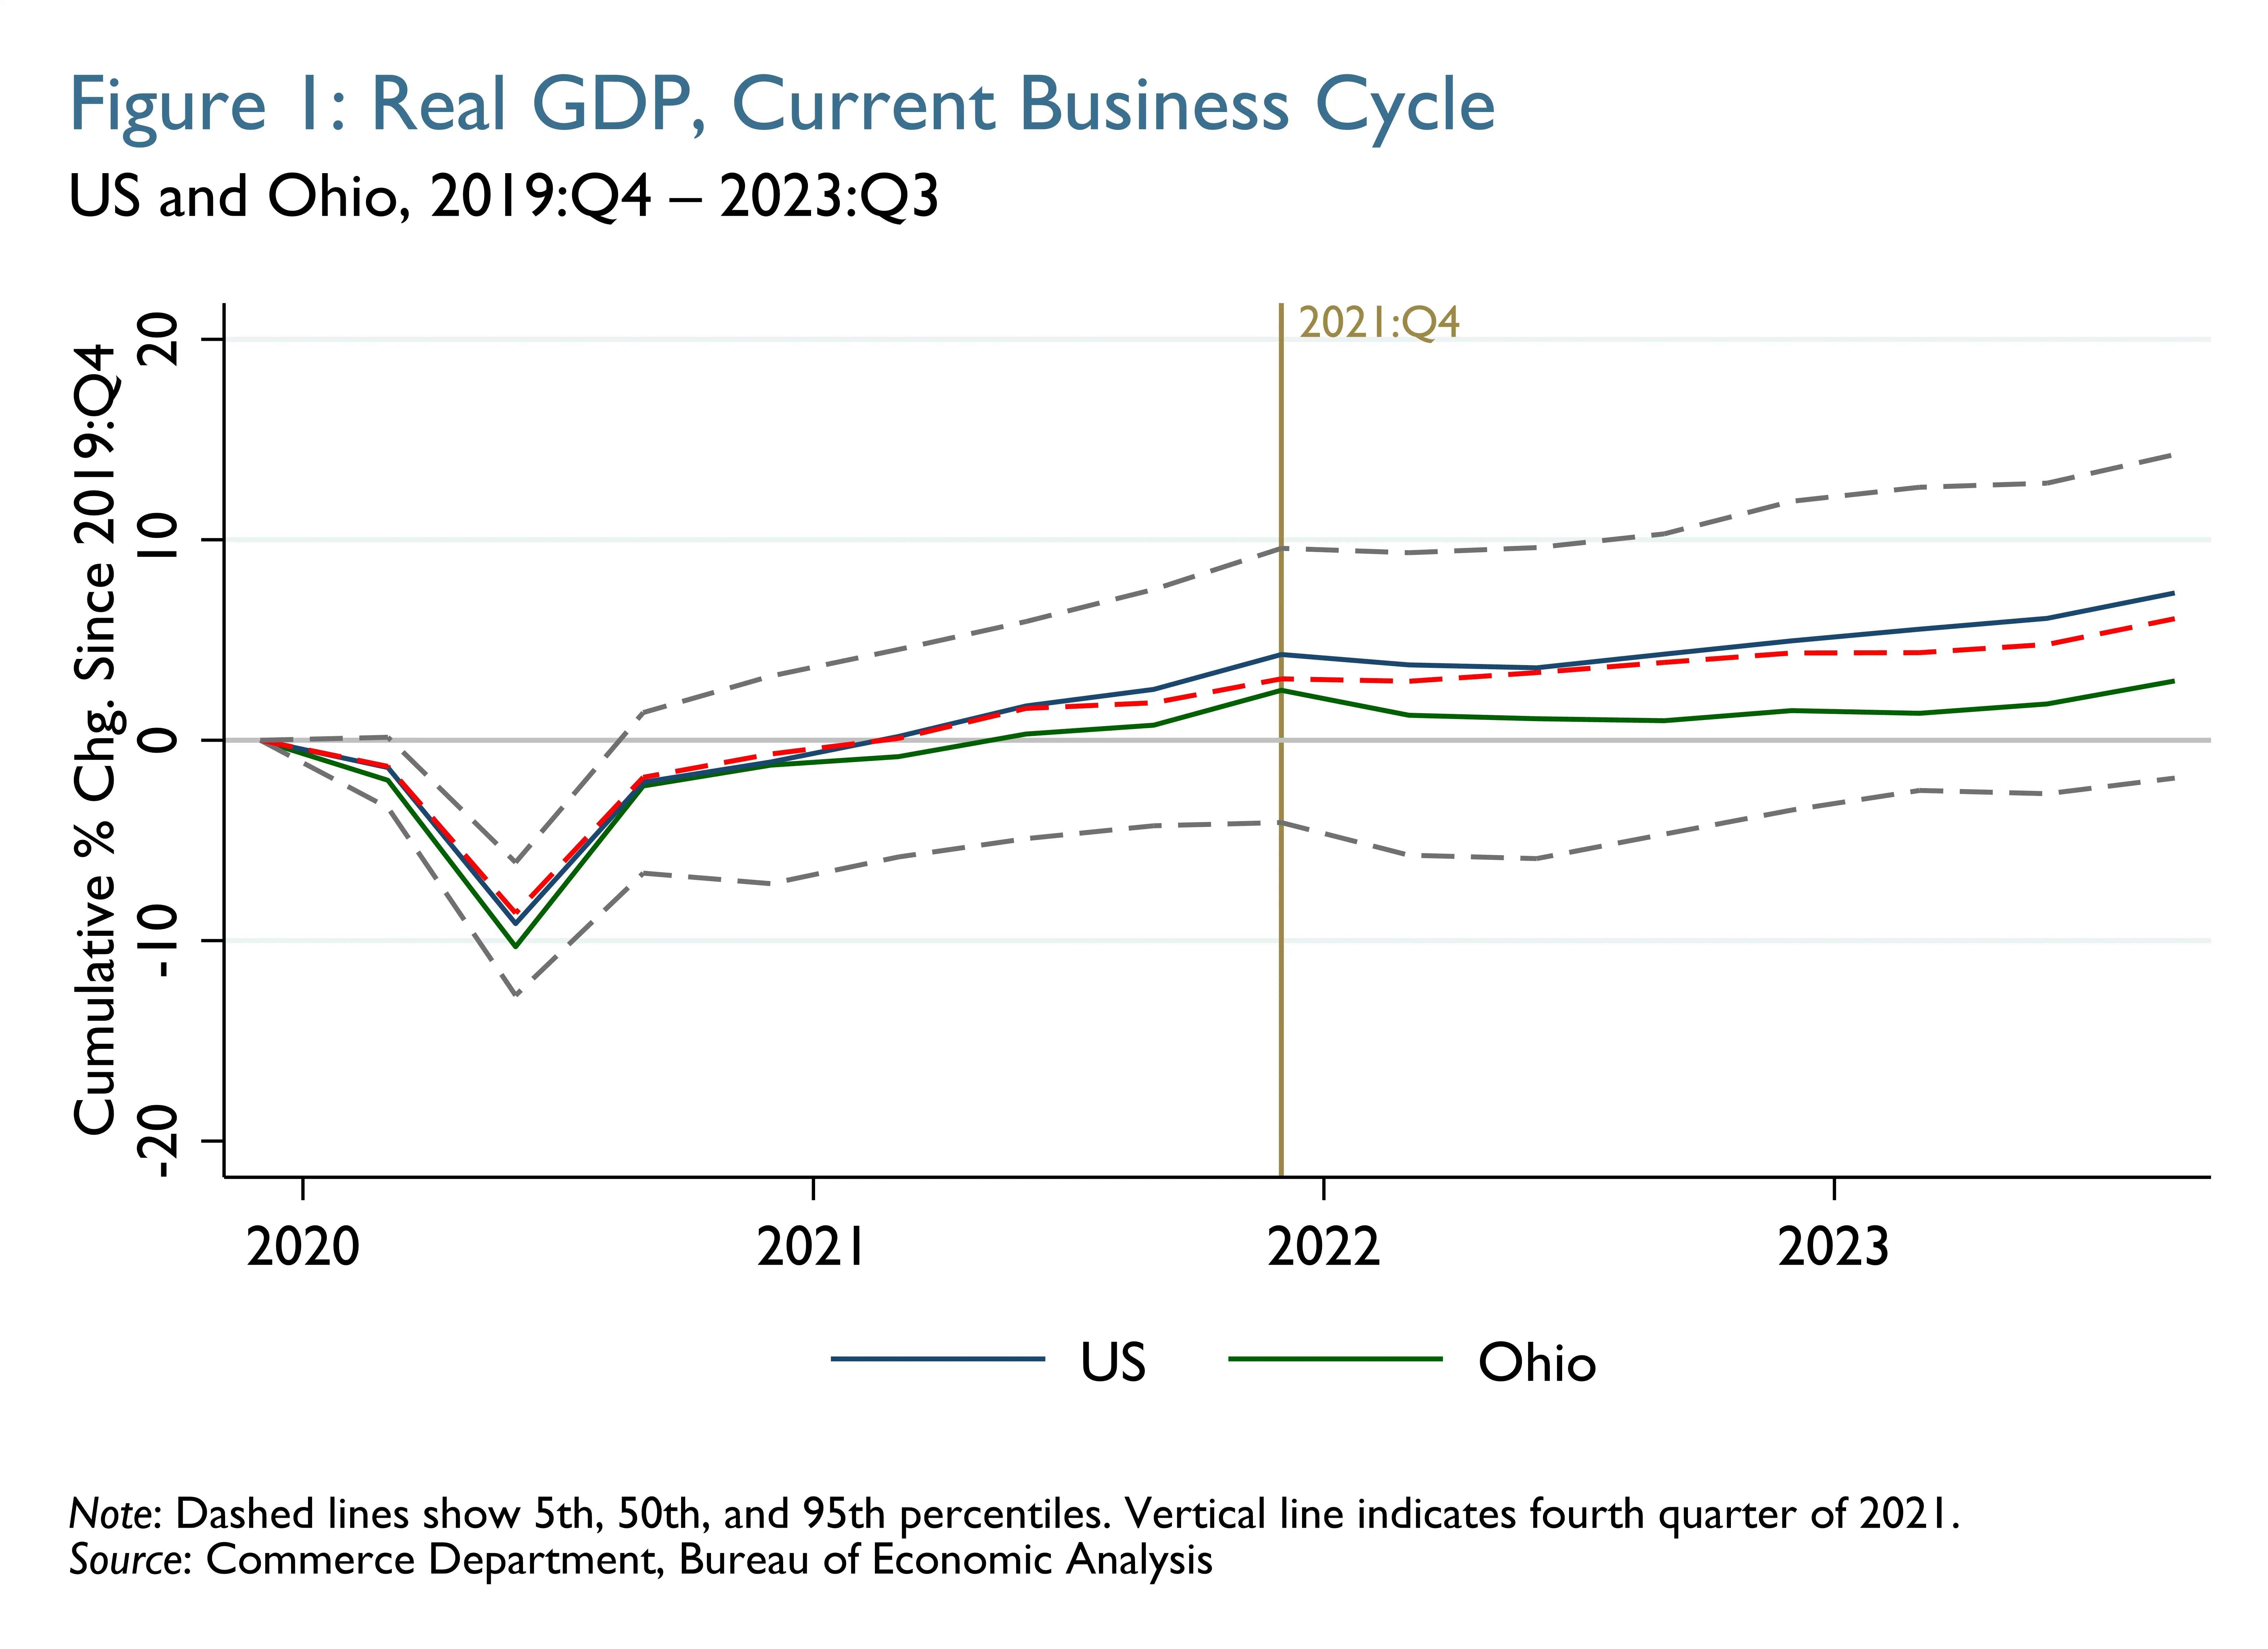
The dashed gray lines illustrate the range of experiences across all states—showing cumulative changes since 2019:Q4 at the 5th and 95th percentiles. (The states associated with these extremes can differ from one period to the next.) Similarly, the dashed red line shows cumulative changes at the 50th percentile, or median. Thus, half of states saw larger cumulative changes than that shown by the red line, while the other half saw smaller changes.4 The cumulative changes for Ohio are shown in green, while those for the United States are shown in blue.
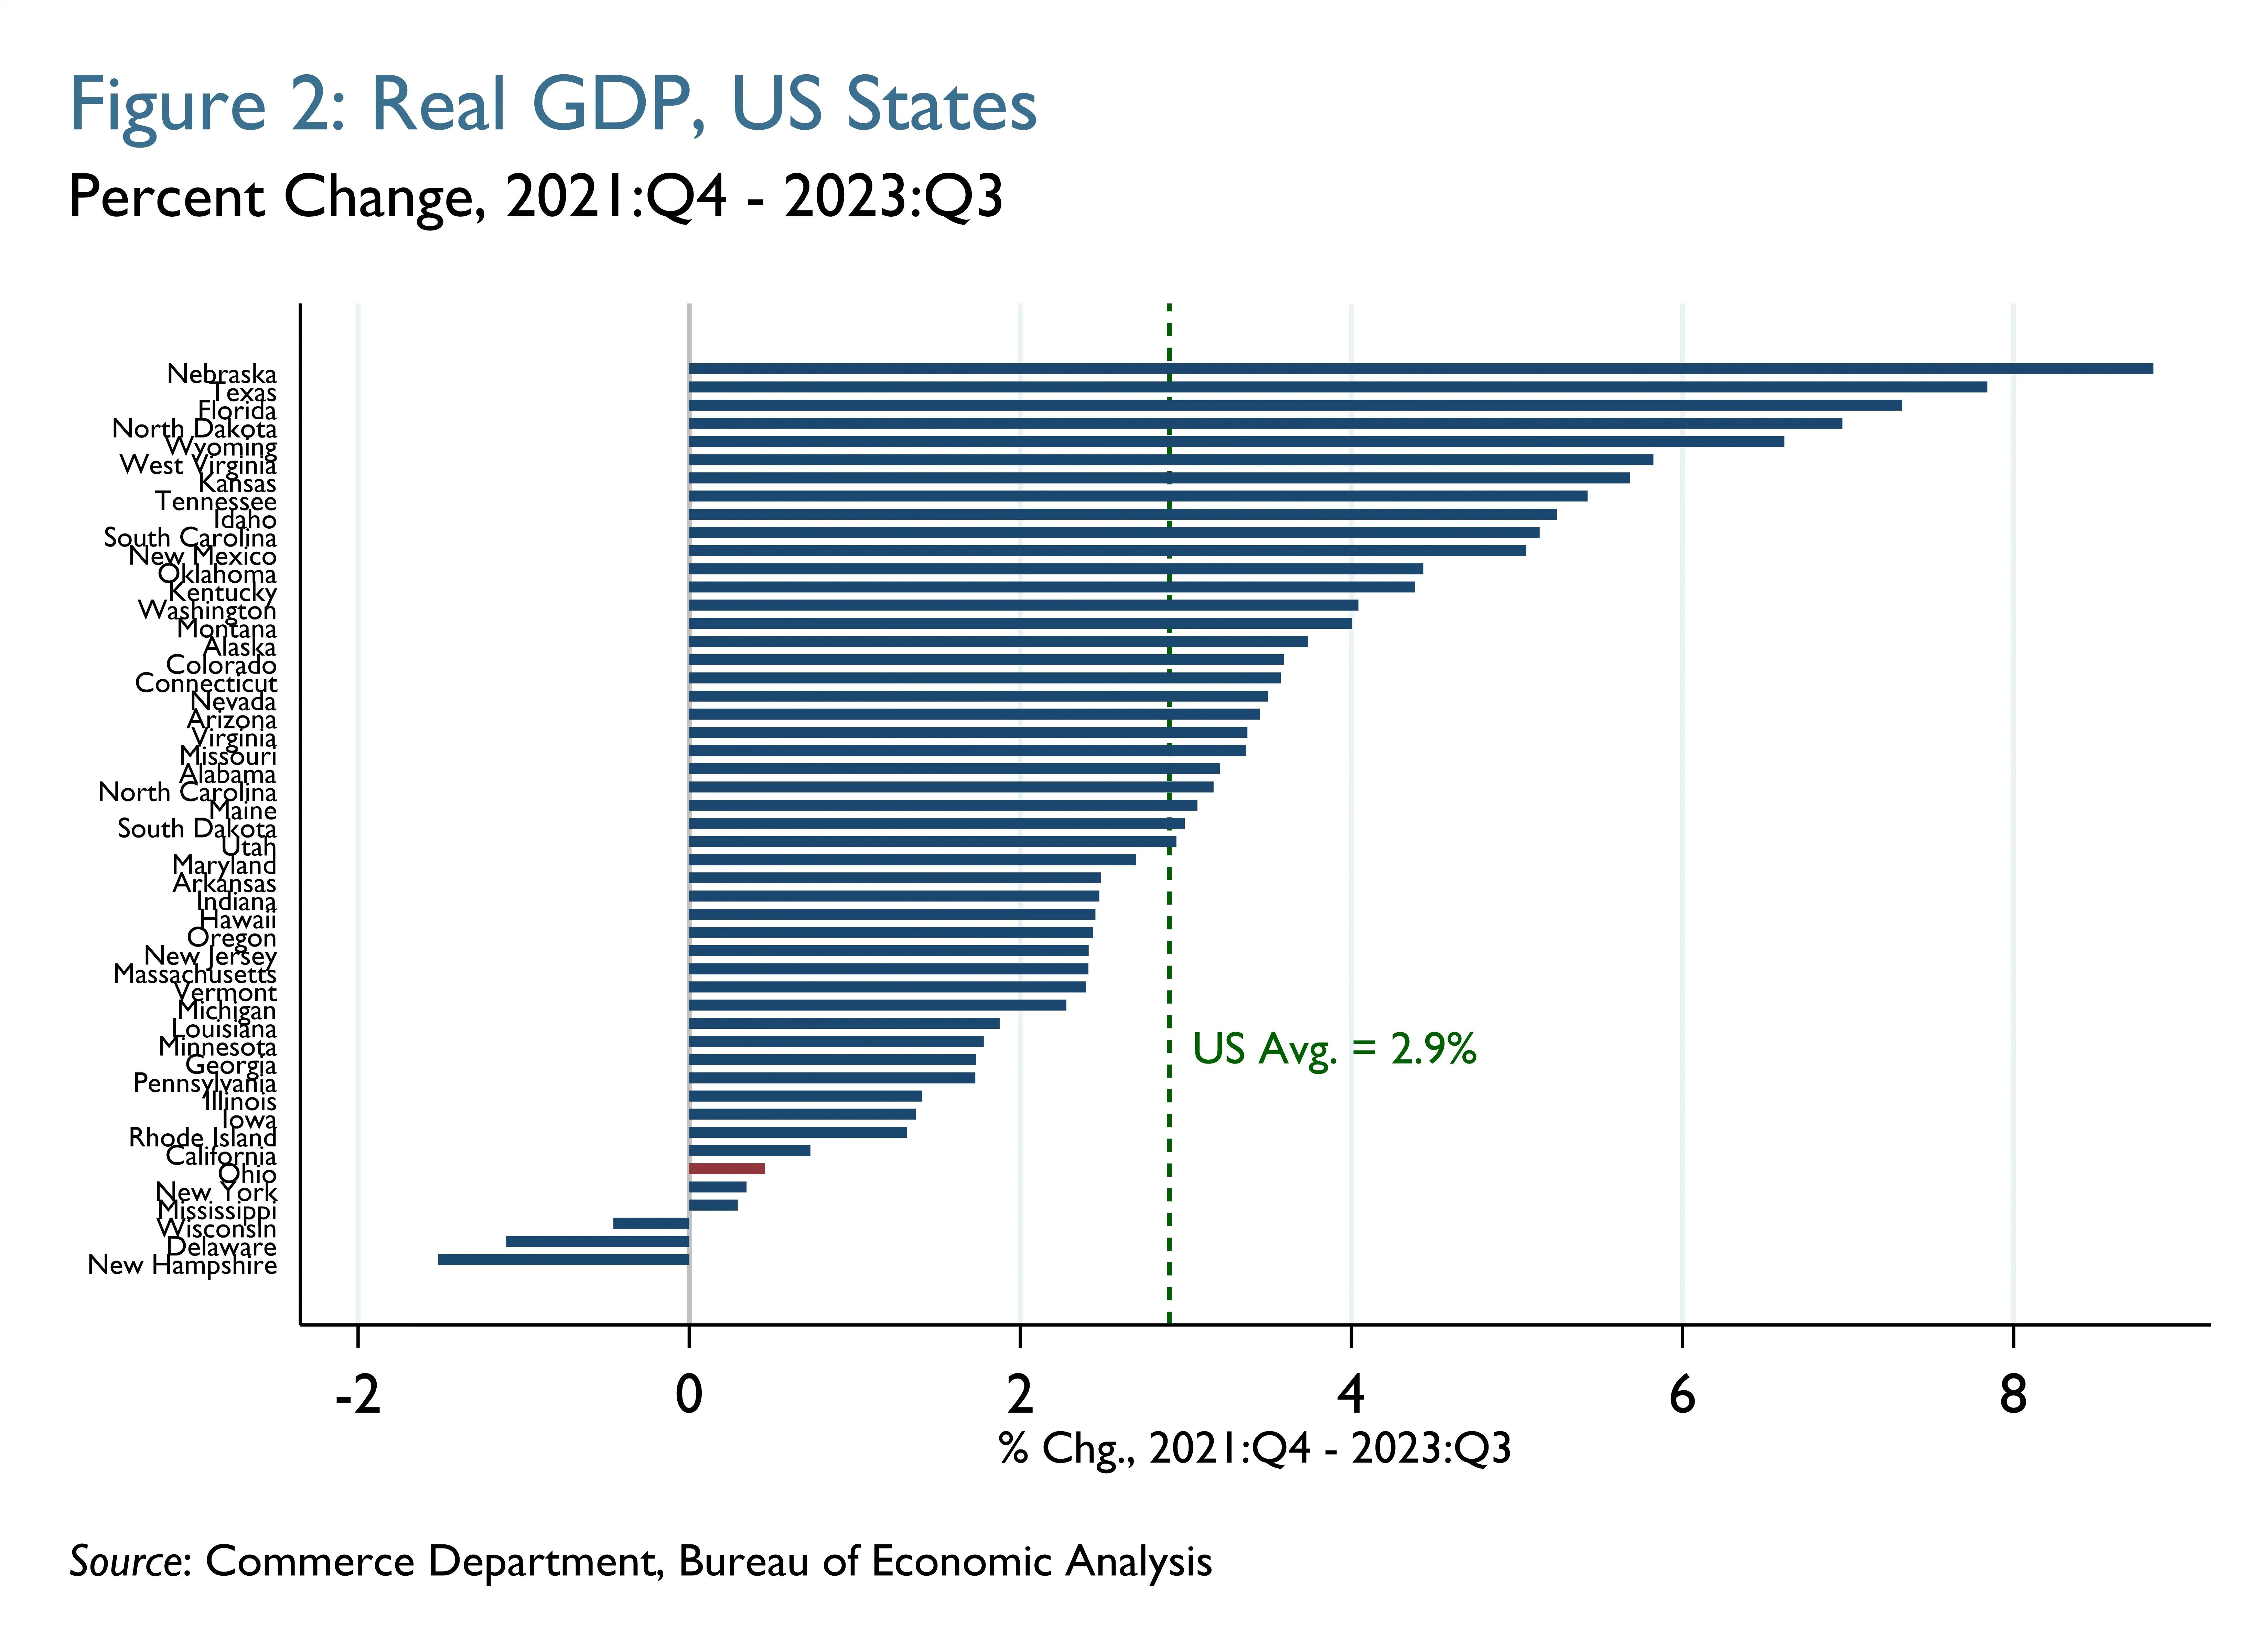
During the first two years of the period shown in Figure 1 (through 2021:Q4), the cumulative changes in Ohio’s inflation-adjusted GDP tended to be fairly close to the median changes across all states. At the end of 2021:Q4, Ohio’s cumulative change ranked thirty-first. Compared to the range of state outcomes, GDP growth was relatively similar for the United States (about 4.3 percent), Ohio (about 2.5 percent), and at the median across all states (about 3.1 percent) during this period. However, from 2021:Q4 through 2023:Q3 (the latest available data), Ohio’s economy experienced noticeably slower growth than the United States' or the median state's. Thus, Ohio’s cumulative growth ranking declined from thirty-first (around the middle of the distribution) toward the end of 2021 to thirty-eighth (the bottom quartile) by 2023:Q3. For 2021:Q4 through 2023:Q3 (shown in Figure 2), Ohio’s GDP grew about half a percent, ranking forty-fifth among all states. Over the same period, US GDP grew nearly 3 percent.
Impact of Industry Differences
What has happened since 2021:Q4 to change the trajectory of Ohio’s GDP growth? A look at GDP growth by industry might help answer this question. Table 1 shows 19 broad industry categories5 and their associated GDP growth and activity shares in the United States and Ohio. The rightmost column also shows Ohio’s ranking among all states for growth by industry from 2021:Q4 through 2023:Q3.
Table 1: Real GDP growth by industry, US and Ohio, 2021:Q4–2023:Q3
|
Percent Change, 2021:Q4–2023:Q3 |
Share, 2021:Q4 | Industry Growth Rank* | |||
| US | Ohio | US | Ohio | ||
| Arts, Entertainment, and Recreation | 21.4 | 36.3 | 1.0 | 0.9 | 2 |
| Information | 9.7 | 11.1 | 6.8 | 2.9 | 32 |
| Professional Services | 7.7 | 11.0 | 8.8 | 6.0 | 19 |
| Retail Trade | 8.9 | 9.2 | 5.5 | 5.8 | 37 |
| Education | 5.1 | 7.6 | 1.2 | 0.8 | 12 |
| Health Care | 7.5 | 7.2 | 7.5 | 8.7 | 21 |
| Mining | 18.3 | 5.8 | 1.2 | 0.5 | 30 |
| Public Administration | 2.3 | 1.0 | 11.4 | 10.2 | 35 |
| Accommodation and Food Services | 1.8 | 0.6 | 2.9 | 2.5 | 36 |
| Construction | -1.5 | 0.0 | 3.9 | 3.5 | 21 |
| Management | 9.6 | -0.3 | 2.3 | 3.8 | 41 |
| Administrative Services | 0.6 | -0.5 | 3.3 | 3.1 | 28 |
| Finance, Insurance, and Real Estate | -0.1 | -1.9 | 20.9 | 22.6 | 35 |
| Other Services | -1.7 | -2.9 | 2.0 | 2.0 | 25 |
| Manufacturing | 0.0 | -4.3 | 10.6 | 15.4 | 39 |
| Utilities | 4.9 | -4.7 | 1.5 | 1.5 | 36 |
| Transportation & Warehousing | 3.9 | -5.0 | 3.2 | 3.4 | 49 |
| Wholesale Trade | -4.9 | -7.2 | 5.4 | 5.8 | 29 |
| Agriculture | -2.0 | -15.2 | 0.8 | 0.7 | 28 |
Note: Ohio's ranking relative to other states, where 1 signifies the greatest percentage increase in GDP in a given industry among states. Ranks for Agriculture and Mining are out of 46 states, while those for Manufacturing and Utilities are out of 48 states.
Source: Commerce Department, Bureau of Economic Analysis
One notable outlier was arts, entertainment, and recreation, for which inflation-adjusted activity in Ohio rose by more than a third during this period, the second largest increase among all states. However, this industry’s relatively small share of overall output—about 1 percent in Ohio and in the United States—meant that its contribution to the state’s total GDP growth was limited. An industry’s contribution to total GDP growth can be calculated by multiplying its growth rate by its associated activity share.6 Professional services and health care saw smaller activity increases (11.0 percent and 7.2 percent, respectively) than arts, entertainment, and recreation from 2021:Q4 through 2023:Q3, but the former two industries contributed more to Ohio’s growth during this period given their larger shares of overall state activity (6.0 percent and 8.7 percent, respectively). At the other end of the spectrum, a large activity decline in agriculture (-15.2 percent) had a more modest negative impact on Ohio’s GDP growth than the smaller declines in finance, insurance, and real estate (FIRE) and manufacturing (-1.9 percent and -4.3 percent, respectively), given the latter two industries’ much larger state activity shares (22.6 percent and 15.4 percent, respectively). Indeed, these two industries had the greatest negative impacts on the state’s GDP growth.7
Moreover, these two industries appear to have been important drivers of differences in GDP growth across all states since the end of 2021. Figures 3a and 3b show state-level scatter plots of changes in these industries’ growth (horizontal axis) relative to changes in total GDP growth (vertical axis) from 2021:Q4 through 2023:Q3.
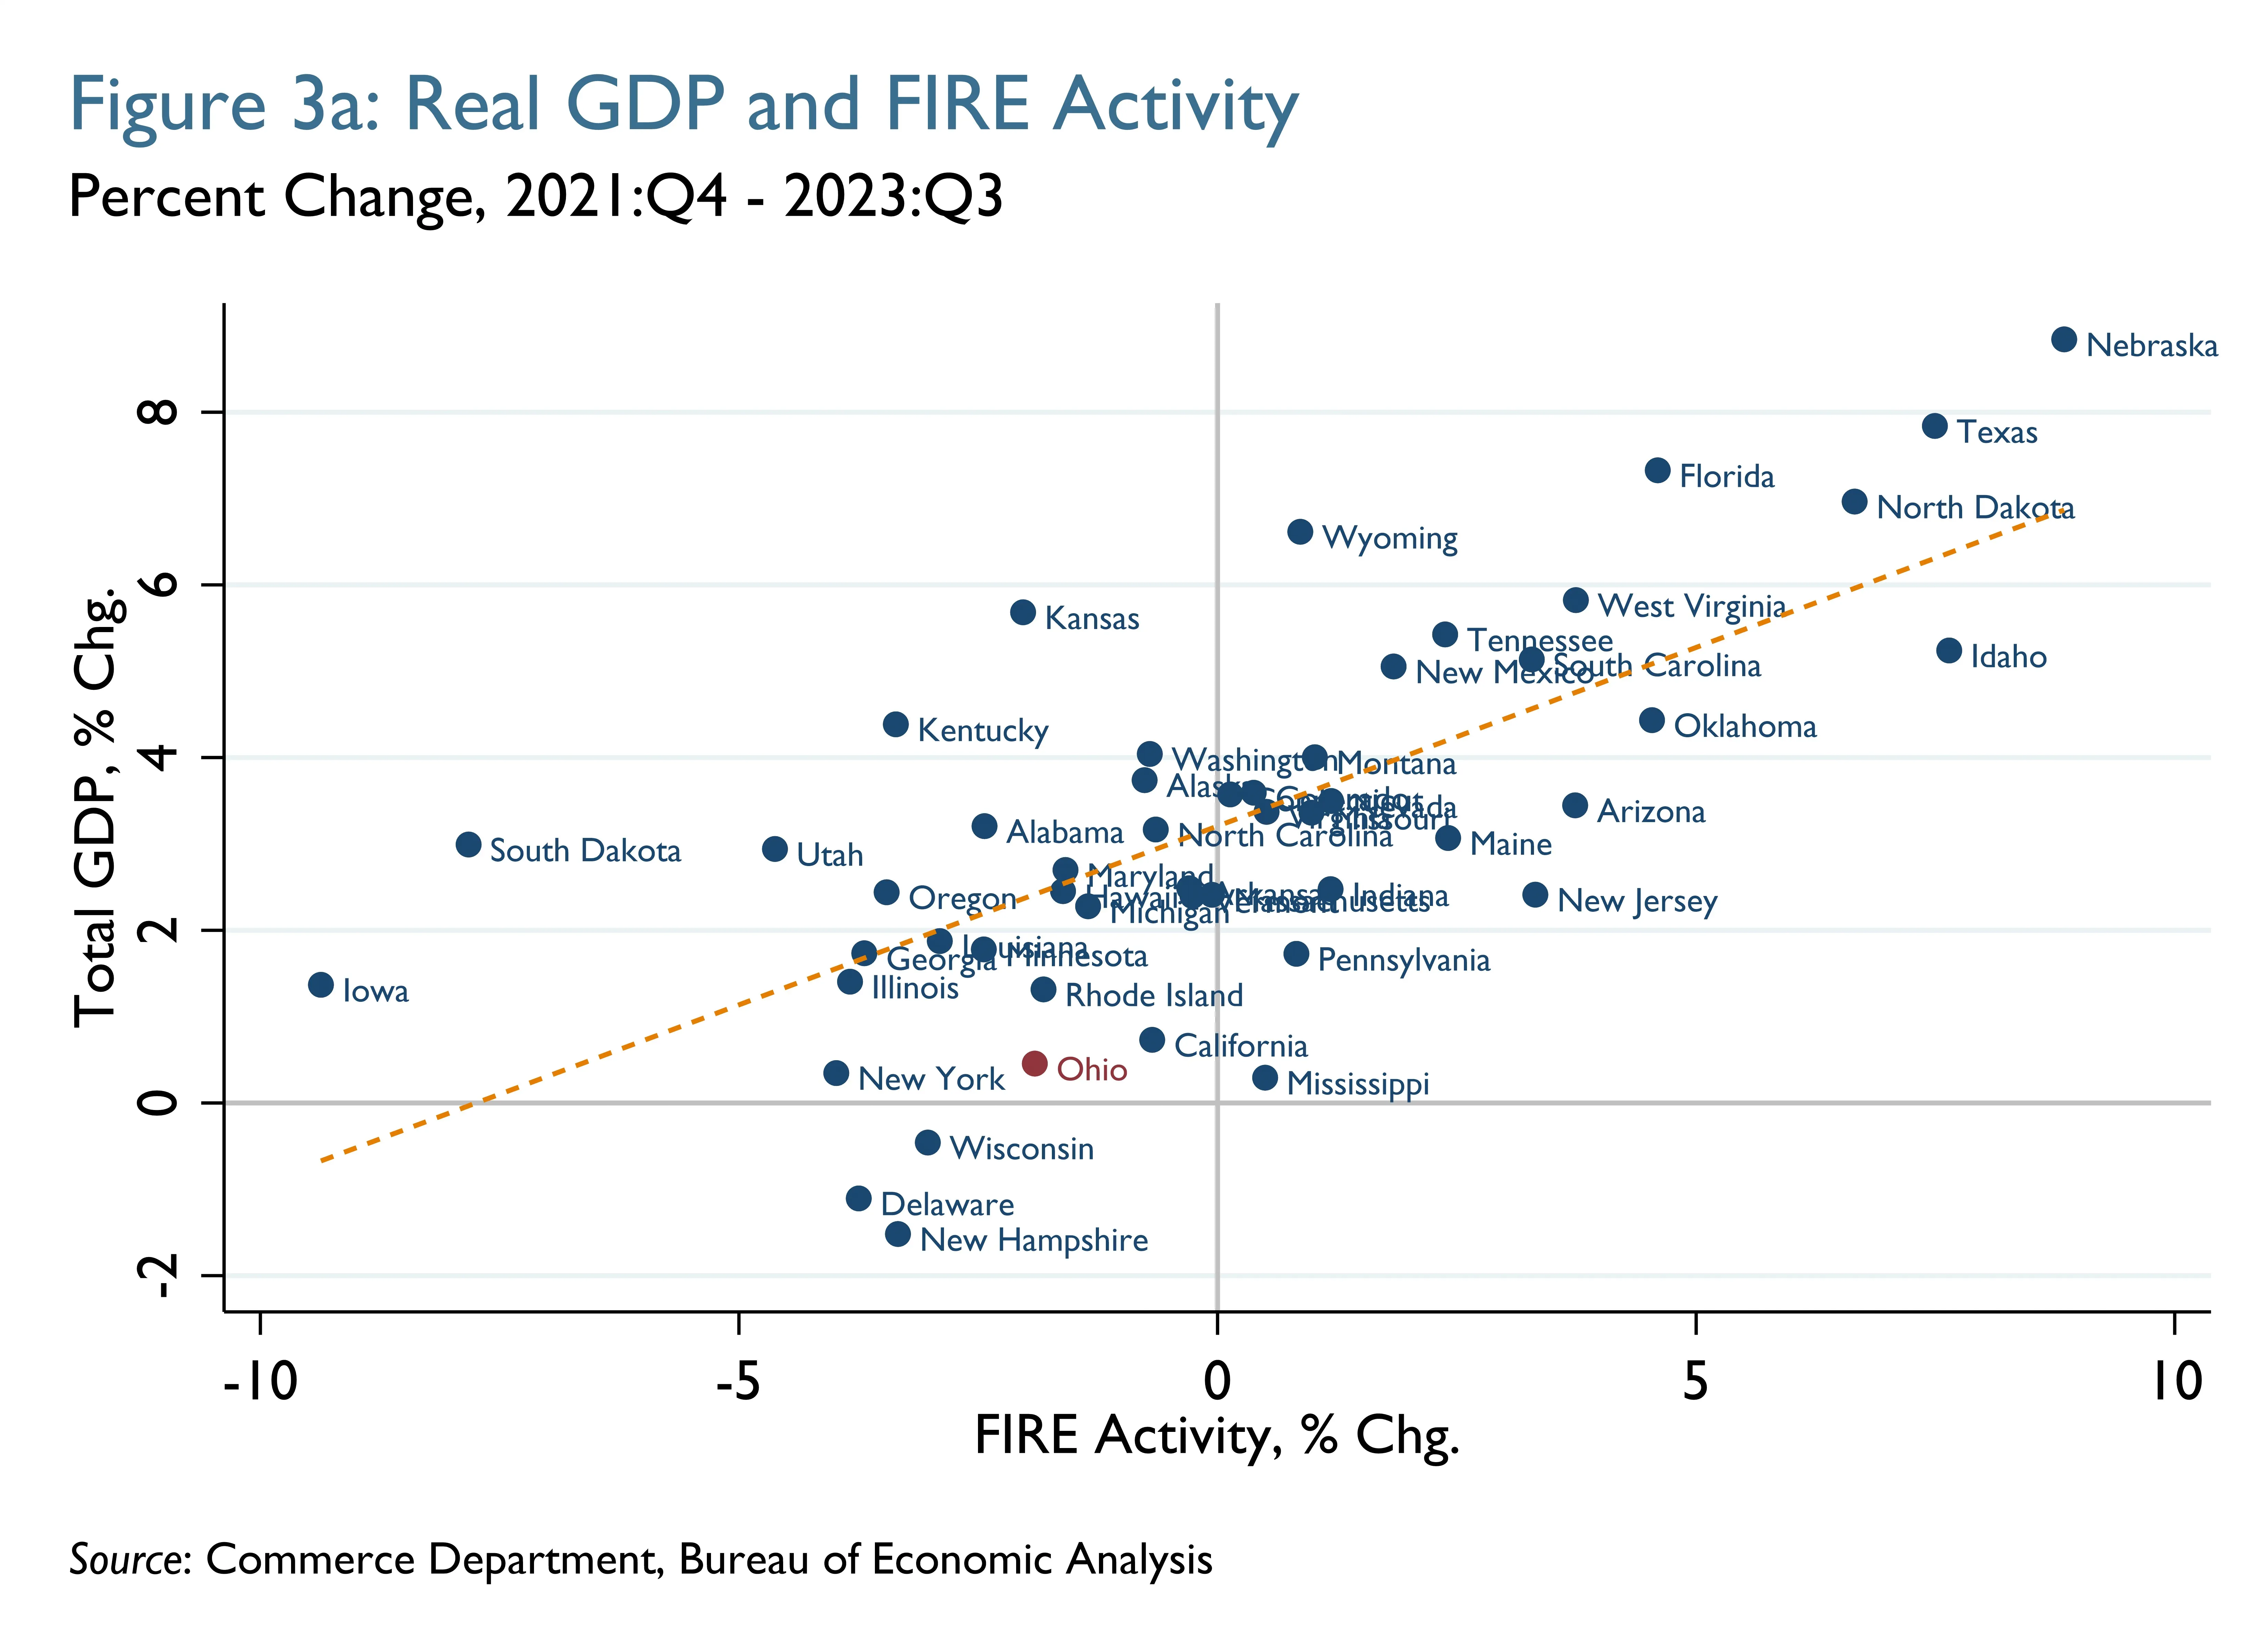
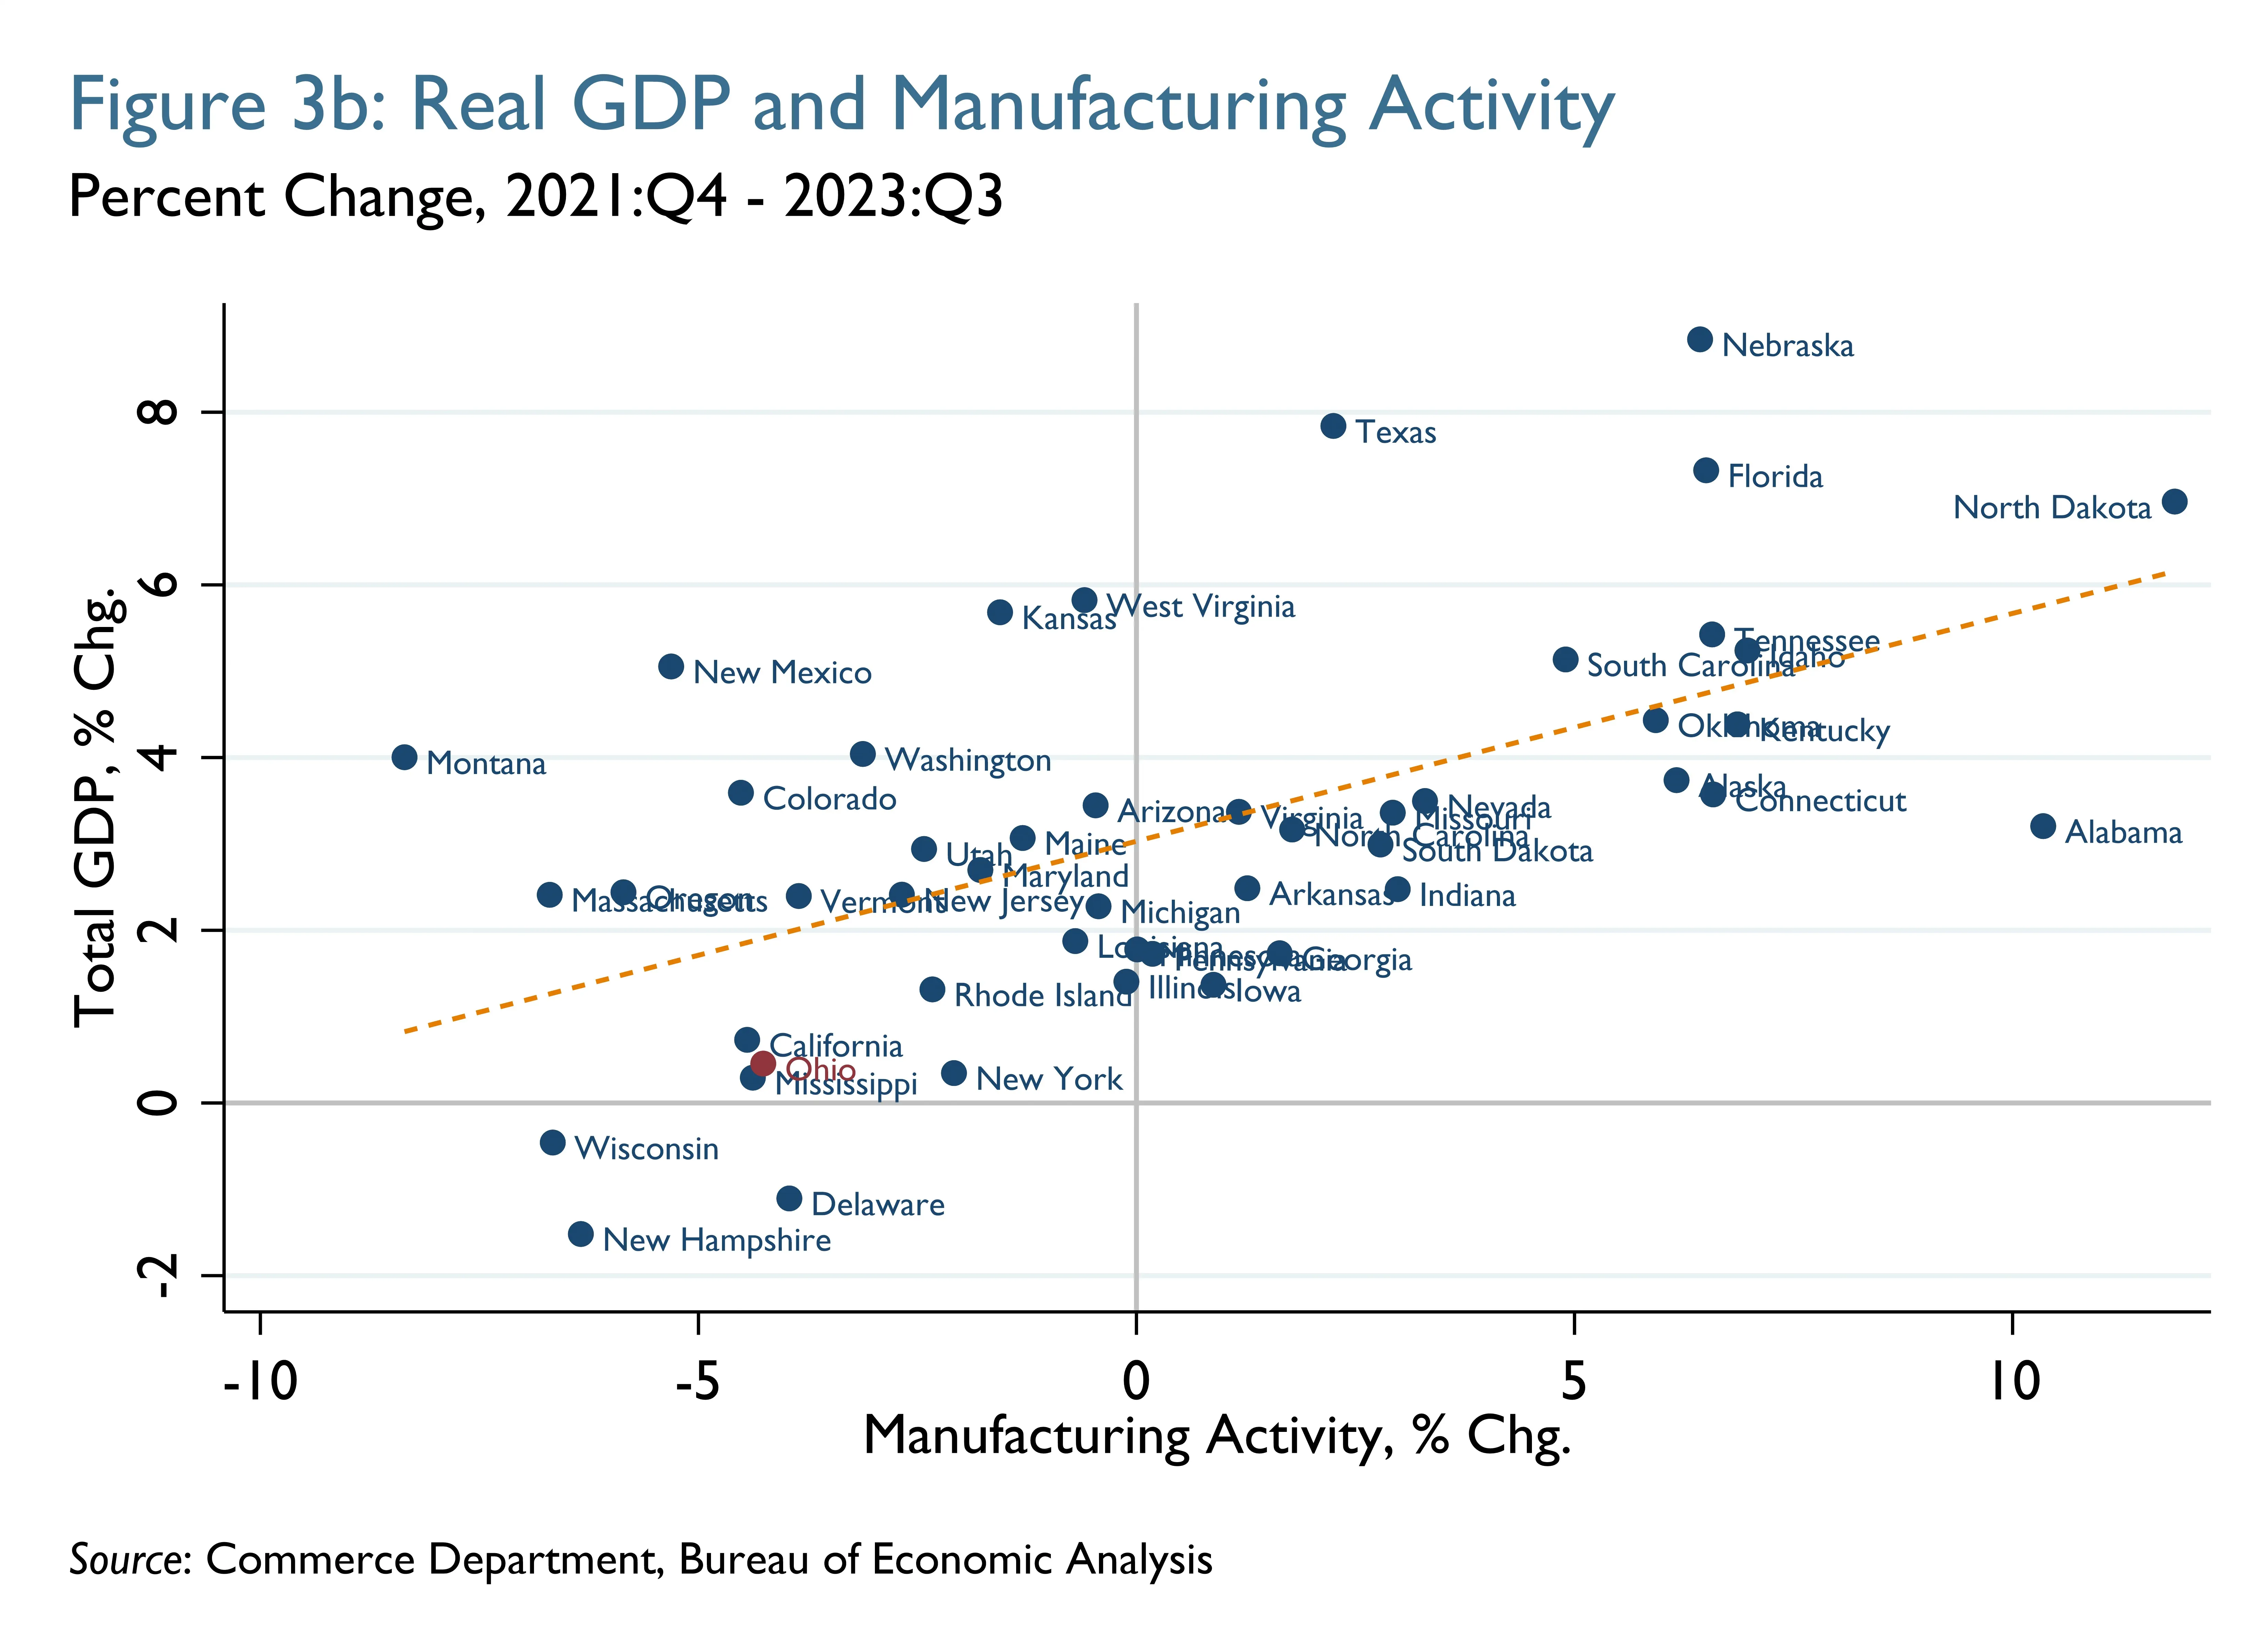
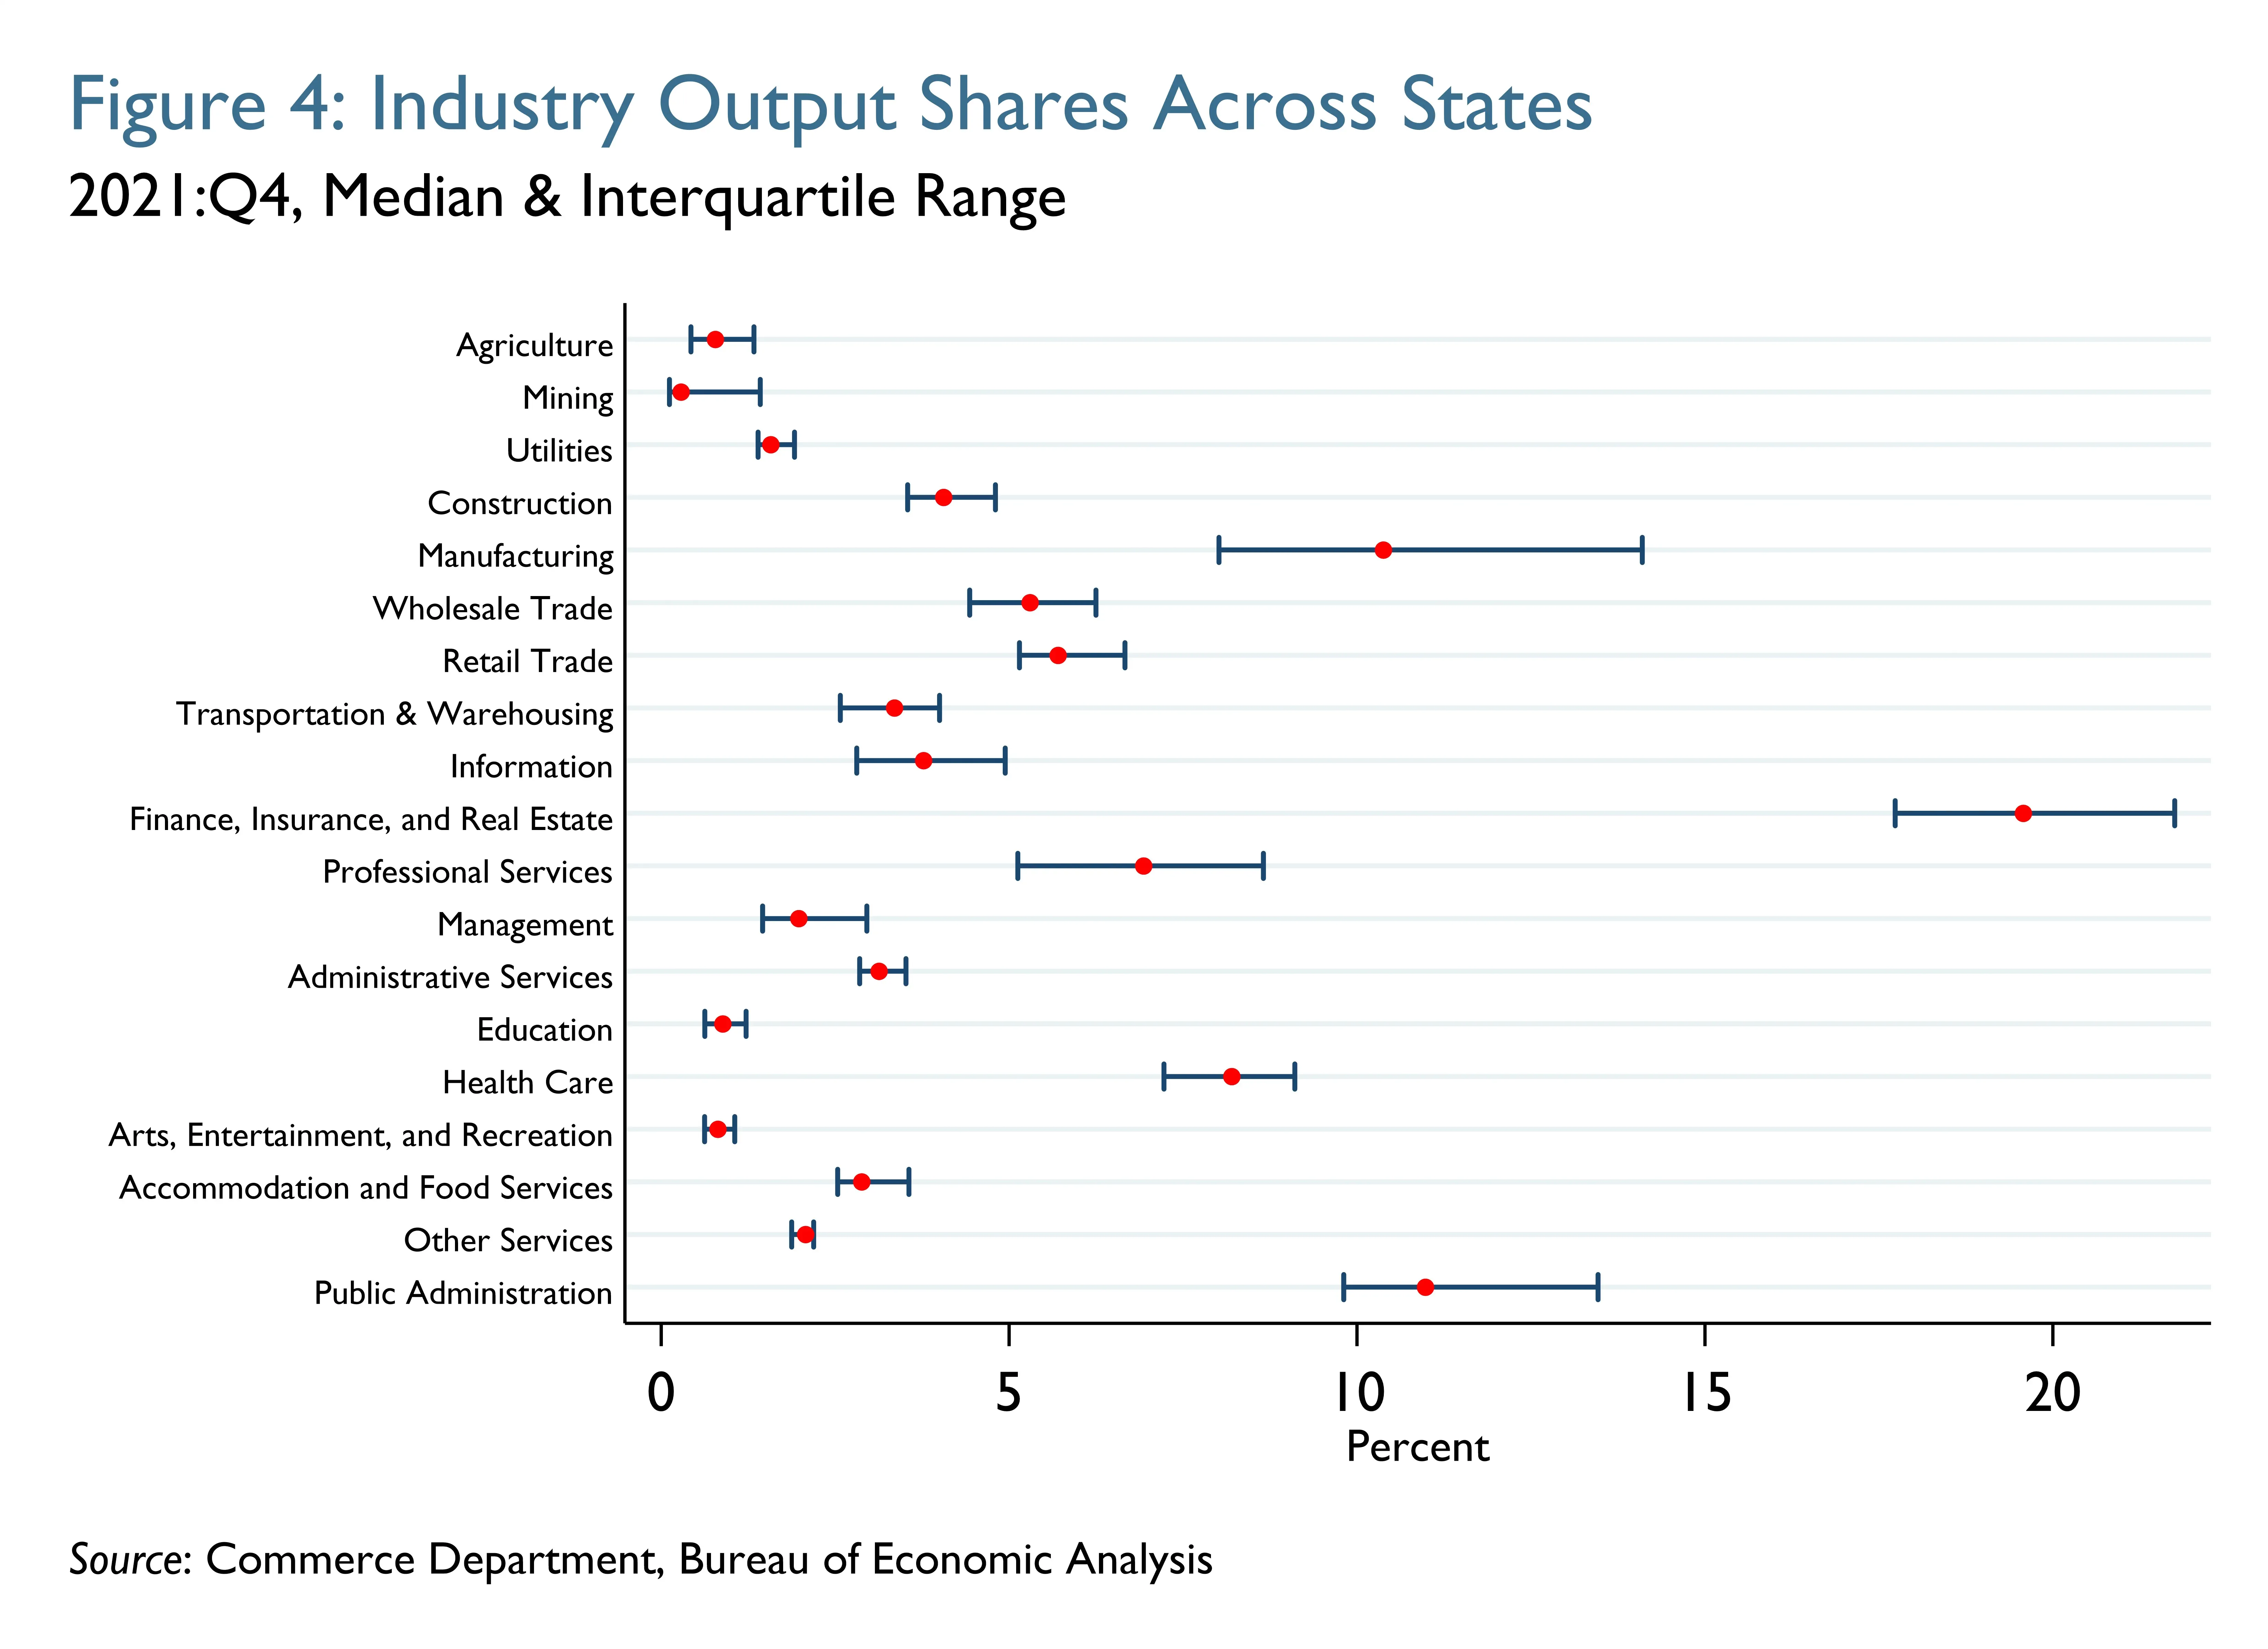
The association between changes in activity in FIRE and total GDP growth across all states was fairly high during this period, with one statistic8 suggesting that the changes in FIRE activity explained almost half of the variation in GDP growth across all states.9 Similarly, changes in manufacturing activity during this period explained about a third of the variation in GDP growth across all states.10 The activity changes in these two industries together accounted for about two-thirds of the variation in states’ GDP growth.11 This was partly because these categories generally account for a sizeable share of overall state output, about 30 percent at the median, as shown in Figure 4. (Figure 4 also presents the ranges for industry output shares across all states, with the line segments showing this range for the 25 states in the middle of the industry output-share distribution.)
Thus, changes in these two industries are likely to be important drivers of changes in a state’s GDP growth. For 2019:Q4 through 2021:Q4, total activity changes in these two industries were even more strongly associated with states’ GDP growth than for 2021:Q4 through 2023:Q3.12
Conclusion
Ohio’s cumulative GDP growth was close to the median across all states through the first two years of the current business cycle (2019:Q4 through 2021:Q4). However, the state’s GDP growth thereafter was noticeably weaker, ranking forty-fifth from 2021:Q4 through 2023:Q3. Thus, the cumulative change in Ohio’s GDP from late 2019 fell from close to the median among all states at the end of 2021 to the bottom quartile by 2023:Q3. Since 2021:Q4, activity declines in manufacturing and FIRE have contributed substantially to Ohio’s weaker GDP growth; collectively, these two industries reduced the state’s GDP growth by more than 1 percentage point during the seven quarters following the end of 2021. Manufacturing and FIRE tend to be important to explaining GDP growth differences across states, partly because these industries typically account for a fair amount of overall activity, almost a third at the median. Thus, these two industries explained about two-thirds of the variation in states’ GDP growth in the current cycle, before and after 2021:Q4.
The views expressed in this report are those of the author(s) and are not necessarily those of the Federal Reserve Bank of Cleveland or the Board of Governors of the Federal Reserve System.
Footnotes
- https://www.bea.gov/news/2015/gross-domestic-product-state-2nd-quarter-2015 Return to 1
- https://apps.bea.gov/scb/pdf/2013/09%20September/0913_quarterly_gdp_by_state.pdf Return to 2
- The timing of US business cycles is determined by the National Bureau of Economic Research. For more information, see https://www.nber.org/research/business-cycle-dating. Return to 3
- The median cumulative change across states is calculated by averaging the cumulative changes for the states ranked twenty-fifth and twenty-sixth at a given point. Return to 4
- These categories largely correspond to the highest-level industry groups in the North American Industrial Classification System (NAICS). Two of the original 20 categories—finance and insurance, real estate—have been combined; this aggregation was one of the 10 high-level industry groups associated with the Standard Industrial Classification (SIC) system that predated the NAICS. For more information, see https://www.census.gov/naics/ and https://guides.loc.gov/industry-research/classification-sic. Return to 5
- Adjustments to these data for inflation mean that summing this product (that is, an industry’s growth rate multiplied by its associated activity share) across all industries will not necessarily equal the reported change in a state’s GDP. Return to 6
- Together, they reduced the state’s GDP growth by more than 1 percentage point during this period. Return to 7
- The coefficient of determination, commonly referred to as “r-squared”, measures the proportion of variation in the dependent variable that can be accounted for by an independent variable or variables. Return to 8
- R-squared = 0.48 Return to 9
- R-squared = 0.33 Return to 10
- R-squared = 0.61 Return to 11
- R-squared = 0.66 Return to 12
References
- Cao, Lam, Charles Ian Mead, Todd Siebeneck, and Catherine (Zheng) Wang. 2013. “BEA Briefing: A First Look at Experimental Quarterly Gross Domestic Product by State.” Survey of Current Business 93 (9): 294–98. US Bureau of Economic Analysis. https://apps.bea.gov/scb/pdf/2013/09%20September/0913_quarterly_gdp_by_state.pdf.
- National Bureau of Economic Research. n.d. “Business Cycle Dating.” NBER. Accessed January 31, 2024. https://www.nber.org/research/business-cycle-dating.
- Terrell, Ellen. 2023. “Standard Industrial Classification Code (SIC Code).” Doing Industry Research: A Resource Guide. Library of Congress. https://guides.loc.gov/industry-research/classification-sic.
- US Bureau of Economic Analysis. 2015. “Gross Domestic Product by State, 2nd Quarter 2015.” News Release. https://www.bea.gov/news/2015/gross-domestic-product-state-2nd-quarter-2015.
- US Census Bureau. 2024. “North American Industry Classification System (NAICS).” https://www.census.gov/naics/.
Suggested Citation
Venkatu, Guhan. 2024. “How Has Ohio Fared in the Current Business Cycle?” Federal Reserve Bank of Cleveland, Cleveland Fed District Data Brief. https://doi.org/10.26509/frbc-ddb-20240326
This work by Federal Reserve Bank of Cleveland is licensed under Creative Commons Attribution-NonCommercial 4.0 International


- Share