

- Share
Rust and Renewal: A Cleveland Retrospective

The key results of this analysis on the Cleveland MSA’s economic performance are the following:
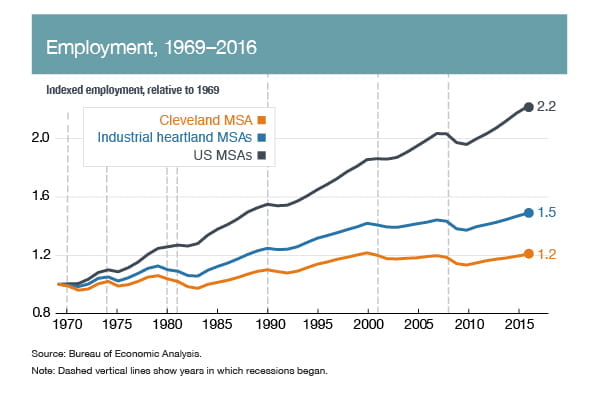
- Between 1969 and 2016, employment in the Cleveland MSA grew more than 20 percent. But this growth was much weaker than that in either the industrial heartland or the nation: The nation’s employment grew by more than 100 percent, and the average industrial heartland MSA saw its employment level grow by 50 percent.
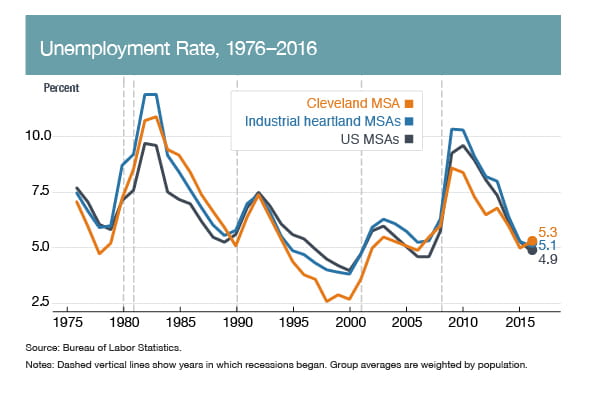
- Despite the weak growth of employment in the Cleveland MSA, unemployment rates in the MSA have again declined to levels similar to national unemployment rates. The recovery in the Cleveland MSA’s unemployment rate happened following two large declines in manufacturing that affected the Cleveland MSA and the broader industrial heartland by sharply raising unemployment rates.
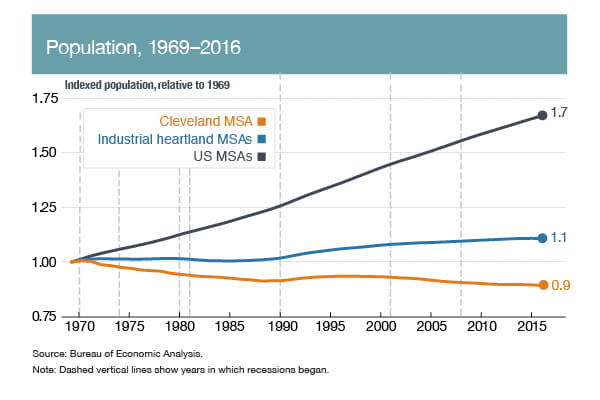
- The recovery of the unemployment rate in the Cleveland MSA occurred in spite of slower employment growth because population growth was significantly lower in the Cleveland MSA than in other US MSAs.
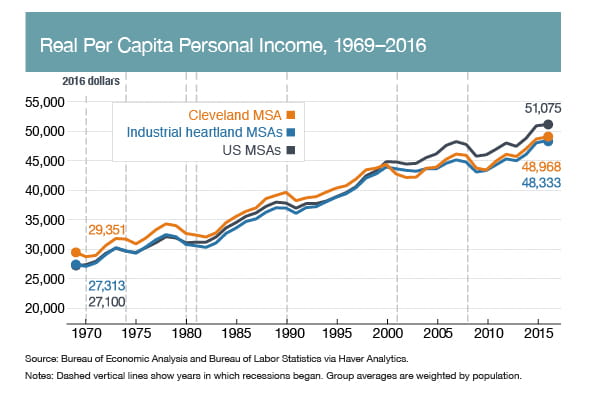
- In 1969, the Cleveland MSA was among the top 10 percent of MSAs for per capita income. Despite declines in per capita income following the large shocks to manufacturing employment experienced in the late 1970s and early 1980s, the Cleveland MSA’s per capita income remained above average until 2000. The decline in manufacturing experienced in the Cleveland MSA between 2001 and 2010 appears to have further dampened income growth; this which experience is consistent with the experience of other industrial heartland MSAs that suffered income losses along with manufacturing losses. The Cleveland MSA is now notably below the national MSA average for per capita income.
Download the complete Report | Download the Suppressed Data and Imputation Appendix
Related work
Why the Industrial Heartland Still Matters: Q&A with Mark Schweitzer
Mark Schweitzer, senior vice president in the Research Department, discusses what’s changed—and what hasn’t—for manufacturing in the industrial heartland and in the Cleveland Fed’s District.

Rust and Renewal: A Cincinnati Retrospective
This retrospective report evaluates the Cincinnati metropolitan statistical area's economic performance and the importance of manufacturing in the region from 1969 to the present.

Rust and Renewal: A Pittsburgh Retrospective
This retrospective report evaluates the Pittsburgh metropolitan statistical area's economic performance and the importance of manufacturing in the region from 1969 to the present.
What’s Gone Wrong (and Right) in the Industrial Heartland?
The historically Midwestern manufacturing region, sometimes referred to as the "Rust Belt," faced another challenging period after 2000 when manufacturing employment declined by 1.2 million jobs. This Commentary investigates the relative economic performance of this region versus other US metropolitan areas during and following these job losses. The analysis shows that while unemployment rates have recovered in the metro areas of the industrial heartland, other economic indicators lag behind the manufacturing-intensive metro areas outside of the region.
Labor Market Tightness across the United States since the Great Recession
Though labor market statistics are often reported and discussed at the national level, conditions can vary quite a bit across individual states. We explore differences in these labor market conditions across US states before and after the Great Recession using a ratio of the number of unemployed workers to job vacancies. We show that the intensity of the adverse effects of the recession and the strength of the recovery varied geographically at all points in the process. We also demonstrate that wage growth is delayed until the ratio of unemployed workers to job vacancies returns to prerecession levels.
The State of States’ Unemployment in the Fourth District
Evaluating what constitutes a "normal" level for the unemployment rate is an important issue for policymakers, who need to assess how close the economy is to full employment. We introduce a framework that enables us to calculate the normal unemployment rate for each of the four states in the Fourth District and compare that rate to the national normal rate. We conclude that these states and the District as a whole have very little labor market slack left from the Great Recession.
Manufacturing Employment Losses and the Economic Performance of the Industrial Heartland
We identify a hypothetical industrial heartland region consisting of MSAs that have high concentrations of 1969 earnings in manufacturing relative to the US average and that are located within the geography often associated with the Rust Belt. For comparison purposes we also identify a set of manufacturing-intensive MSAs outside the region and a set of MSAs with low manufacturing concentrations (service-intensive MSAs). We then identify cross-sectional correlations in the economic performance of MSAs during and following losses in manufacturing employment and evaluate whether the industrial heartland region has a distinct response to those losses.
Common Bonds, Divergent Paths: An Economic Perspective of Four Cities
Our 1986 annual report examines the economies of the four largest cities in the Fourth Federal Reserve District: Cincinnati, Cleveland, Columbus, and Pittsburgh.