

The Survey of Firms’ Inflation Expectations
Because it would be costly for firms to adjust their prices at every moment in time based on current economic conditions, most macroeconomic models posit that firms change their prices infrequently, and when prices do change, firms set them in a forward-looking manner, accounting for both current and expected future costs and demand. Expectations over the aggregate inflation rate play a central role in these decisions. A firm’s future costs will be influenced by many factors, but the overall rate at which prices are growing will be a common force driving labor costs and the prices of intermediate goods used in production. Similarly, the future demand for the firm’s product will depend in part on the prices of its competitors, prices which, in turn, will be related to the overall rate of price growth.
Crucially, it is the inflation expectations of the price setters in the economy that are important in this line of reasoning. While there are relatively well-known and long-running surveys of consumers’ inflation expectations over various horizons, the same is not true for surveys of firms.1 Notably, the Federal Reserve Bank of Atlanta’s Business Inflation Expectations series asks business contacts within the southeastern United States about their expectations for their unit costs over the next 12 months, rather than their expectations for overall inflation.2 The Survey of Firms’ Inflation Expectations (SoFIE) thus fills a need by directly asking a nationally representative sample of top business executives for their inflation expectations. Started in 2018 by researchers Olivier Coibion and Yuriy Gorodnichenko, SoFIE collects data on a quarterly basis for expected inflation over the next 12 months. The survey also includes a second question that rotates among four options, capturing business executives’ beliefs concerning inflation on average over the next five years, inflation over the previous year, the probability that inflation over the next 12 months will exceed 5 percent, and the Federal Reserve’s inflation target.
SoFIE shows that year-ahead inflation expectations among top business executives rose over the course of 2021 and 2022, as inflation surged in the United States, and the responses became more dispersed during this time as disagreement across respondents rose. But in early 2023, expectations for inflation over the next year began to decline, though to a level that was still higher than before the pandemic, and dispersion across respondents came down, as well. The increase in inflation expectations over 2021 and 2022 was not confined to near-term inflation expectations, however; firms’ longer-horizon inflation expectations also moved up during this period, as did their perceptions of past inflation and their views on the Federal Reserve’s inflation target. We believe these survey results will be of interest to policymakers, researchers, and the broader public, and the Center for Inflation Research at the Federal Reserve Bank of Cleveland will present updated estimates from SoFIE each quarter on its website, via clefed.org/SoFIE.
Survey Questions and Data
SoFIE is a quarterly survey of chief executive officers (CEOs) and other top executives that has been running since 2018:Q2.3 Survey data are collected during the first month of each quarter (January, April, July, and October). The questions are part of a longer privately run survey that is administered by an external company. Firms are repeatedly sampled from one quarter to the next in the survey, providing a panel dimension at the individual-firm level. The dataset contains a limited number of characteristics about each respondent’s firm. The surveyed firms represent various industries within either the manufacturing sector or the services sector.4 Additionally, firms are classified as small, with 1 to 19 employees; medium, 20 to 249 employees; or large, 250 or more employees.
In each quarter, respondents are asked the following question:
Question 1: “What do you think will be the inflation rate (for the Consumer Price Index) over the next 12 months? Please provide an answer in an annual percentage rate.”
There is also a second question that rotates among a set of four questions. The rotation is as follows:
Question 2A, asked each April (Q2): “What annual inflation rate do you think the U.S. Federal Reserve is trying to achieve on average?”
Question 2B, asked each July (Q3): “What do you think has been the annual inflation rate (for the Consumer Price Index) over the last twelve months? Please provide an answer in annual percentage rate.”
Question 2C, asked each October (Q4): “What do you think will be the average inflation rate (for the Consumer Price Index) over the next 5 years? Please provide an average annual percentage rate.”
Question 2D, asked each January (Q1): “What do you think is the probability that the annual inflation rate (for the Consumer Price Index) over the next 12 months will exceed 5%?”
Survey Cleaning Methodology
Free-text responses to each question are allowed. While most respondents surveyed provide point estimates as requested by the question, others provide a range, a lower bound only, or an upper bound only. Respondents can also decline to answer the question by, for example, stating that they are unsure or do not know the answer or by writing another response from which a usable answer to the question cannot be extracted. Because of the free-text nature of the responses, answers are cleaned and sorted into usable and unusable responses prior to calculating means and standard deviations for each survey question.5
For each survey, we derive the mean response and the standard deviation across responses separately for both questions asked in that quarter. Aside from question 2D, usable responses are those for which the respondent provides a point estimate or a range estimate. In the latter case, we take the midpoint of the range. For question 2D, we also use responses that provide a lower-bound or upper-bound probability; in these cases, we take either the midpoint between the lower bound and 100 or the midpoint between 0 and the upper bound. We also interpret responses that imply inflation will certainly be above (below) 5 percent as implying a probability of 100 percent (0 percent).
For all further calculations, we drop unusable responses. This leaves us with N usable responses for a given question. For each question other than question 2D, we remove outliers by sorting the responses from least to greatest and dropping the bottom 5 percent of the N responses and the top 5 percent of the N responses.
We apply survey weights to the remaining responses. These are post-stratification weights calculated to make the sample representative relative to the distribution of annual payrolls by industry and firm size. Beginning with 2023:Q2, payroll data are obtained from the most recently available Statistics of US Businesses (SUSB) from the United States Census Bureau. Prior to this, sample weights are calculated with the 2019 release of the SUSB. Each usable survey response is assigned a weight based on the industry and size of the respondent firm, and we renormalize the weights by dividing each response weight by the sum of the weights across all usable responses. Thus, our results are weighted trimmed means and standard deviations, with the exception of question 2D responses, which are not trimmed.
Survey Results
We have data for each quarter on firms’ inflation expectations over the next 12 months. Figure 1 plots the evolution of the firms’ inflation expectations since the start of the series in 2018:Q2. Because the survey question specifically asks about CPI inflation, we also plot the realized CPI inflation data. However, we plot the CPI inflation data on a trailing year-over-year basis for the month prior to the survey month in each quarter; for example, for 2019:Q2, the firm survey was conducted in April 2019, and we plot inflation in the CPI for the prior 12 months between March 2018 and March 2019 because this information may have been available to respondents at the time of the survey and thus may have influenced their beliefs about and expectations for inflation over the following year.

For the first several years of the survey, we see that expectations tended to be a little higher than realized CPI inflation over the prior year. Moreover, because inflation was gradually trending down over this time period, firms’ inflation expectations also tended to overpredict CPI inflation over the next year, as well. As inflation picked up rapidly in 2021, firms’ inflation expectations rose with it in virtual lockstep. In 2022, firms’ inflation expectations began to run below the CPI inflation readings over the prior year, signaling a belief that inflation would start to turn down relatively soon. CPI inflation did, indeed, begin falling in late 2022, and that decline continued into early 2023. In early 2023, firms’ inflation expectations for the next year moved down noticeably, as well. At the time of this writing in 2023:Q2, firms’ inflation expectations over the next 12 months were down from their peaks but were still much higher than they had been prior to the COVID-19 pandemic.
We can also compare firms’ inflation expectations for the next year with similar inflation expectations coming from other sources. Figure 2 compares SoFIE with other surveys of consumer inflation expectations: the expected inflation rate over the next year from the University of Michigan Surveys of Consumers (UM), based on the median or mean; the one-year-ahead expected inflation rate from the New York Fed’s Survey of Consumer Expectations (NY Fed), based on the median of a distributional question or the median across point estimates; and the monthly average reading of the weekly indirect consumer inflation expectations (ICIE) series from Hajdini et al. (2022a, 2022b). In addition, we can also compare SoFIE to the mean expected change in unit costs over the next 12 months from the Atlanta Fed, a measure they call business inflation expectations (BIE). In each case, we match the survey months from SoFIE with the monthly readings from the other surveys.

There are broad similarities in the evolution of inflation expectations between firms and consumers since 2018, with low readings prior to 2021 and high readings since that time. But there are some differences worth highlighting. As one example, firms’ inflation expectations were lower than consumers’ inflation expectations prior to the pandemic. The construction of the inflation expectations series also matters. In particular, SoFIE is a trimmed mean, as is the ICIE measure.6 When inflation was high in 2022, SoFIE was above the median UM measure but below the mean UM measure. In addition, the main SoFIE question asks respondents for point inflation forecasts rather than assigning probabilities to different possible outcomes, as the NY Fed’s distribution question or the BIE question does. Most notably, firms’ inflation expectations have been higher than their unit cost expectations based on the BIE survey almost continually since SoFIE began in 2018. The BIE’s expectations for unit cost growth ran far below actual CPI inflation from 2021 onward, reflecting, in part, the design of that survey.7
In terms of variation across survey respondents, as reported by Coibion, Gorodnichenko, and Kumar (2018) and Candia, Coibion, and Gorodnichenko (2021), firms’ inflation expectations tend to be less dispersed than consumers’, but they are more dispersed than professional forecasters’. Table 1 compares the trimmed standard deviation across respondents in the SoFIE data with the standard deviation across the consumers in the UM survey data and the ICIE survey data.
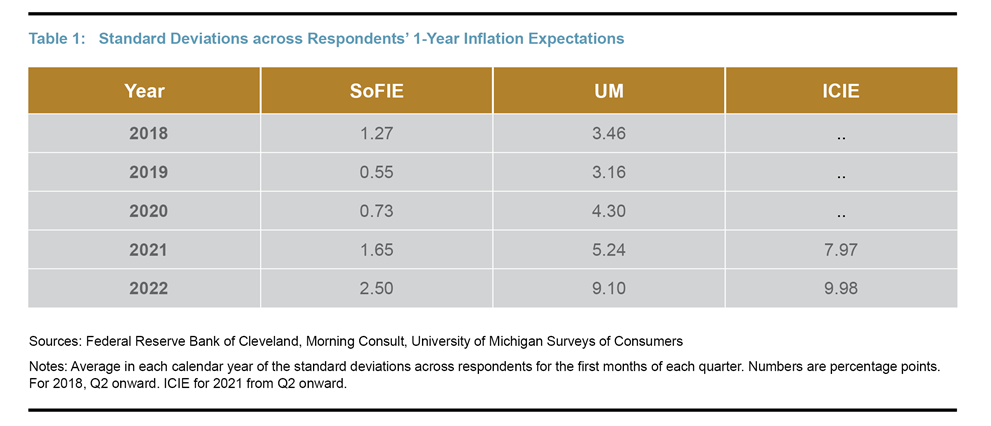
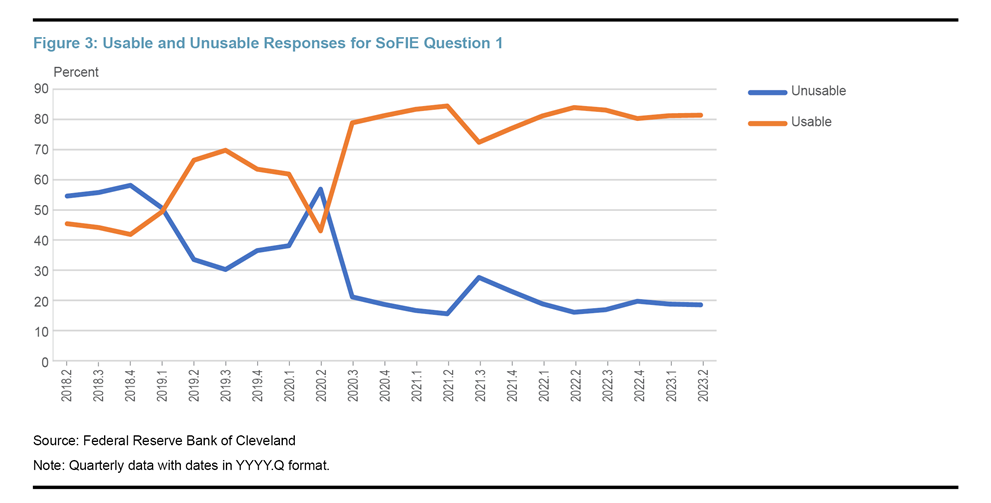
While the evolution of the means has been similar across surveys, as shown earlier, consumers’ inflation expectations are far more dispersed than those for firms, and this difference has increased with higher inflation. One difference discussed in the methodology section is that firms have an open question in SoFIE, a situation which means that in a high inflation environment, they can provide answers beyond writing a single point estimate. Firms that do not provide a numerical answer are excluded from our calculations in some cases. In addition, respondents can also indicate that they do not know or choose not to provide an estimate. Figure 3 plots the share of responses that could not be converted into a numerical answer and hence were not usable in our calculations for question 1. We see that with the passage of time, firms have been reporting more numerical answers. With a short time series, we cannot be sure if the increase in usable answers can be attributed to firms’ paying more attention to inflation as inflation has gone up and being better able to provide a numerical expectation or if the firms in our survey are learning how to answer the questions, as in Kim and Binder (2023).
Finally, Table 2 shows the average responses to the rotating questions that are asked in only one quarter per year. Prior to the pandemic, firms generally believed that the Federal Reserve’s inflation target was around 2 percent, that past inflation was around 2.5 percent, and that inflation would average 2 percent to 3 percent over the next five years. As inflation increased in 2021 and 2022, all of these estimates increased, including firms’ expectations for average inflation over the next five years.

Overall, we see that firms’ inflation expectations have some similar properties to the inflation expectations documented in surveys of consumers, but they are far less dispersed than consumers’ inflation expectations. As with consumers’ expectations, firms’ inflation expectations moved higher in 2021, and while they have moderated a little, they are far from the low and stable values seen prior to 2021, whether looking at near-term or longer-term expectations. Importantly, SoFIE provides a window into the inflation expectations of the people who are leading firms and setting prices in the economy (Coibion et al., 2020), allowing us to look beyond the views of consumers and making this series a useful addition to the study of inflation expectations.
Conclusion
Policymakers are interested in inflation expectations because they can potentially influence decisions, including firms’ price-setting decisions, thereby having an impact on the overall economy, and the Survey of Firms’ Inflation Expectations provides a direct measure of inflation expectations among top-level business executives in a nationally representative panel. The survey finds that these expectations rose over the course of 2021 and 2022 as inflation surged in the United States, and the responses became more dispersed as disagreement across respondents increased. In early 2023, expectations for inflation over the next year began to decline, though to a level that was still higher than before the pandemic. The increase in inflation expectations over 2021 and 2022 was not confined to near-term inflation expectations; firms’ longer-horizon inflation expectations also moved up during this period, as did their perceptions of past inflation, and their views on the Federal Reserve’s inflation target, showing the broad extent to which elevated inflation affected the beliefs of top business executives. The Federal Reserve Bank of Cleveland will present updated estimates from the Survey of Firms’ Inflation Expectations each quarter on its website, via clefed.org/SoFIE.
The views authors express in Economic Commentary are theirs and not necessarily those of the Federal Reserve Bank of Cleveland or the Board of Governors of the Federal Reserve System. The series editor is Tasia Hane. This work is licensed under a Creative Commons Attribution-NonCommercial 4.0 International License. This paper and its data are subject to revision; please visit clevelandfed.org for updates.
Endnotes
- For example, the University of Michigan Surveys of Consumers has measured consumers’ short-term (one-year) inflation expectations on a monthly basis since 1978 (with longer-term, five- to ten-year inflation expectations measured on a monthly basis since 1990), while the Federal Reserve Bank of New York’s Survey of Consumer Expectations has captured one-year-ahead and three-year-ahead inflation expectations since 2013. Some other measures have a shorter history. For example, Hajdini et al. (2022a, 2022b) present a novel, indirect approach to capture consumers’ inflation expectations over the next 12 months. In other contexts, the inflation expectations of consumers are the object of interest; for example, see Coibion et al. (2022, forthcoming). Return to 1
- In particular, the key question for the Federal Reserve Bank of Atlanta’s BIE asks, “Projecting ahead, to the best of your ability, please assign a percent likelihood to the following changes to unit costs over the next 12 months.” The survey asks participants to assign likelihoods to a very small number of possible outcomes, which we see as a further limitation of the BIE and discuss further below. See https://www.atlantafed.org/research/inflationproject/bie. Return to 2
- Candia et al. (2021) provide additional information on the survey. Return to 3
- Within the manufacturing sector, companies are classified into food and drink, textiles and clothing, electrical, chemicals and plastics, transport, timber and paper, basic metals, mechanical engineering, and other manufacturing. Within the services sector, the companies are classified into hotels and restaurants; transport and storage; post and telecommunication; financial intermediation; renting and business activities; and other services. Return to 4
- The detailed methodology used to clean the data can be found on the clefed.org/SoFIE webpage. Importantly, we use weighted trimmed means and weighted trimmed standard deviations, both of which remove extreme values based on the potentially changing distribution of responses in each quarter, except for Question 2D, which reports weighted means and standard deviations. Our trimming procedure differs from the prior practice in Candia et al. (2021) to trim responses greater than 15 percent or less than -2 percent regardless of the shape of the distribution. When inflation is very high or very low, more mass of the distribution could be trimmed from the latter approach. Return to 5
- To remove outliers, the ICIE is a trimmed mean, similar in spirit to SoFIE, but the trimming is more extreme: the top 10 percent and the bottom 10 percent of respondents are excluded from the trimmed mean. While the standard deviations calculated from the UM survey responses are not trimmed, survey respondents who report “high” inflation values—numbers above 5 percent—are asked a follow-up “probe” question that provides a soft way to nudge down outlier observations. Return to 6
- BIE respondents assign probabilities to only five bins that have not changed since the start of the survey in 2011. The lowest bin is for “unit costs down (<-1%)”, and the highest bin is for “unit costs up very significantly (>5%).” These bins quantitatively limit the ability of the survey to capture expected large increases or large decreases in unit costs. Return to 7
References
- Candia, Bernardo, Olivier Coibion, and Yuriy Gorodnichenko. 2021. “The Inflation Expectations of U.S. Firms: Evidence from a New Survey.” Working Paper 28836. National Bureau of Economic Research. https://doi.org/10.3386/w28836.
- Coibion, Olivier, Yuriy Gorodnichenko, Edward S. Knotek II, and Raphael Schoenle. Forthcoming. “Average Inflation Targeting and Household Expectations.” Journal of Political Economy Macroeconomics. https://doi.org/10.1086/722962.
- Coibion, Olivier, Yuriy Gorodnichenko, and Saten Kumar. 2018. “How Do Firms Form Their Expectations? New Survey Evidence.” American Economic Review 108 (9): 2671–2713. https://doi.org/10.1257/aer.20151299.
- Coibion, Olivier, Yuriy Gorodnichenko, Saten Kumar, and Mathieu Pedemonte. 2020. “Inflation Expectations as a Policy Tool?” Journal of International Economics (May): 103297. https://doi.org/10.1016/j.jinteco.2020.103297.
- Hajdini, Ina, Edward S. Knotek II, John Leer, Mathieu O. Pedemonte, Robert W. Rich, and Raphael S. Schoenle. 2022. “Indirect Consumer Inflation Expectations: Theory and Evidence.” Working paper 22-35. Federal Reserve Bank of Cleveland. https://doi.org/10.26509/frbc-wp-202235.
- Hajdini, Ina, Edward S. Knotek II, Mathieu Pedemonte, Robert W. Rich, John Leer, and Raphael Schoenle. 2022. “Indirect Consumer Inflation Expectations.” Economic Commentary, no. 2022-03 (March). https://doi.org/10.26509/frbc-ec-202203.
- Kim, Gwangmin, and Carola Binder. 2023. “Learning-through-Survey in Inflation Expectations.” American Economic Journal: Macroeconomics 15 (2): 254–78. https://doi.org/10.1257/mac.20200387.
Suggested Citation
Garciga, Christian, Edward S. Knotek II, Mathieu Pedemonte, and Taylor Shiroff. 2023. “The Survey of Firms’ Inflation Expectations.” Federal Reserve Bank of Cleveland, Economic Commentary 2023-10. https://doi.org/10.26509/frbc-ec-202310
This work by Federal Reserve Bank of Cleveland is licensed under Creative Commons Attribution-NonCommercial 4.0 International


- Share