

A New Measure of Consumers’ (In)Attention to Inflation
Since the onset of the SARS-CoV-2 (COVID-19) pandemic in March 2020, the Federal Reserve Bank of Cleveland has been running a daily survey1 that asks consumers for their views on how they are responding to COVID-19 and how COVID-19 is likely to affect the economy (Dietrich et al., 2020; Knotek et al., 2020). Among the many questions asked, the survey solicits consumers’ inflation expectations. This is an important data set given that such expectations, while affected by current and past inflation, have long been believed to influence future inflation. In this Commentary, we use these daily expectations data to propose a new measure of how attentive consumers are to inflation. Federal Reserve Chair Jerome Powell reminded the audience in his 2022 speech at Jackson Hole that a concept termed "rational inattention” provides a useful insight into how actual inflation may affect expectations about inflation’s future path: “When inflation is persistently high, households and businesses must pay close attention and incorporate inflation into their economic decisions. When inflation is low and stable, they are freer to focus their attention elsewhere.”2
Our proposed measure of attention is based on the consistency between consumers’ answers to two Cleveland Fed survey questions about expectations of inflation. Both questions ask respondents to report their inflationary expectations, but each asks the question in a different way. We define “attentive” respondents as “consistent,” that is, they answer the two inflation questions consistently. We find that attentiveness has risen over the last two years alongside the rise in US inflation to four-decade highs. With consumers more alert to inflation, their expectations should be taken more seriously than ever by policymakers when assessing inflationary pressures in the economy. We would expect inflationary expectations from more attentive consumers to be better informed and therefore to offer more accurate forecasts of future inflation than those from inattentive consumers. Based on our new metric, men, older people, and those with higher education degrees are most attentive.
When we separate the forecasts for future inflation given by attentive and inattentive consumers, we see that while the inflation forecasts from both groups have trended up since the onset of the pandemic, the attentive consumers believe that inflationary pressures are considerably less acute than do the inattentive consumers. Understanding the degree of attentiveness and the heterogeneity in attentiveness matters, especially while the Federal Open Market Committee raises the federal funds rate to help reduce inflation and expectations of inflation. Economic theory suggests that more attentive consumers update their inflationary expectations more rapidly in response to changes in policy and the macroeconomic environment. Targeted and highly visible communication strategies might therefore be needed for the Federal Reserve to reach inattentive consumers, who through their behavior still might influence future inflation.
Measuring Inflation (In)Attention
Given their importance in tracking, understanding, and forecasting the evolving nature of the economy, surveys that directly ask people for their expectations have become a leading empirical tool to measure and quantify peoples’ expectations of inflation.
The Cleveland Fed’s daily survey of US consumers is administered on the Qualtrics Research Services platform. The sample of participants, usually around 100 people per day, is broadly nationally representative. All respondents are US residents, fluent in English, and 18 years of age or older. Individuals in the survey are anonymized for confidentiality. There are relatively few repeat respondents, so the data we analyze are a repeated cross-section rather than a panel.
The survey asks adult members of the US public to report their expectations for future inflation; additionally, the survey includes a block of questions on consumers’ demographic characteristics, a block of questions on their expectations about both the macroeconomy and their household finances, and questions about their perceptions of COVID-19 and its effect on their behavior. Importantly, the survey asks the public to report their forecasts for year-ahead inflation in two ways, and it is this feature of the survey that is the basis for our proposed measure of inflation (in)attention.
Firstly, respondents are asked to report a single value forecast for inflation. For example, one person might forecast that inflation will be 3 percent next year, and another might forecast 7.1 percent. Presumably these forecasts are the respective individual’s best single bet for future inflation. So, secondly, to acknowledge that the future is uncertain and that individuals are likely not 100 percent confident in any single-valued forecast, respondents are asked to assign probabilities to placing future inflation within specified ranges. We might hope that these two different types of questions would deliver forecasts that are mutually consistent. Because the second question immediately follows the first question in the survey, an individual’s information set has presumably not changed from one forecast to the next. Consistency, which in this paper we equate with attentiveness to inflation, requires that an individual’s single-valued forecast, the answer to the first inflation expectations question, is closely related to the same person’s uncertainty forecast, the answer to the second question.
Specifically, we focus on the following two survey questions:
Question 1. The single-valued forecast: What do you expect the rate of inflation to be over the next 12 months? Please give your best guess.
I expect the rate of inflation to be ___ percent over the next 12 months.3
Question 2. The uncertainty forecast: Now we would like you to think about what may happen to inflation over the next 12 months. We realize that this question may take a little more effort. In your view, what would you say is the percent chance that, over the next 12 months. . .
the rate of inflation will be 12% or higher: _______ (1)
the rate of inflation will be between 8% and 12%: _______ (2)
the rate of inflation will be between 4% and 8%: _______ (3)
the rate of inflation will be between 2% and 4%: _______ (4)
the rate of inflation will be between 0% and 2%: _______ (5)
the rate of deflation (opposite of inflation) will be between 0% and 2%: _______ (6)
the rate of deflation (opposite of inflation) will be between 2% and 4%: _______ (7)
the rate of deflation (opposite of inflation) will be between 4% and 8%: _______ (8)
the rate of deflation (opposite of inflation) will be between 8% and 12%: _______ (9)
the rate of deflation (opposite of inflation) will be 12% or higher: ______ (10)
Total: __________
(Must sum to 100%)
To be classified as “consistent,” an individual’s response to question 1 must relate to that individual’s answer to question 2. So, if a person answered question 1 by forecasting inflation of 3 percent next year, a consistent response to question 2 would be, for example, a 50 percent chance of inflation’s being between 0 percent and 2 percent and a 50 percent chance of inflation’s being between 2 percent and 4 percent. The single-valued forecast of 3 percent from question 1 falls within intervals to which the same respondent assigned some degree of possibility in question 2.
More formally, using established statistical methods, we define bounds for each individual’s response to question 2 within which the individual’s answer to question 1 must lie if the individual replied consistently. Using the individual’s response to question 1, we then classify the respondent as “consistent” if this forecast falls within the bounds, or “inconsistent” if it falls outside.4
Rational (In)Attention and Consistency
Our explanation for rising levels of consistency is increased “rational attention.” Sims (2003) argued that since consumers have limited attentional resources and since it is costly for them to gather information about the economy, it can be optimal to be inattentive to inflation when it is low and stable. There is little at risk. But as the level and variability of inflation rise, consumers increasingly benefit when forming their inflationary expectations if they process available information on the economy. Bracha and Tang (2022) find that this argument holds out empirically in the United States, with levels of consumer inattention higher when inflation is low.5 As Carroll (2003) shows, not all consumers update their expectations regularly. Rather, they tend to update their expectations more often when inflation and surrounding issues are discussed more frequently in news media. There tends to be a larger volume of news coverage when inflation is high and its future path uncertain than when inflation is low or relatively steady. Hence, we might expect consumers’ single-valued and uncertainty forecasts to fall increasingly in line as inflation rises, because both forecasts reflect the more considered views of the respondent.6 Internationally, research has found that consumers in high-inflation countries tend to be better informed about inflation than those in low-inflation countries (Cavallo et al., 2017).
We should note that there are other explanations for forecast inconsistency that maintain the assumption that individuals are being “rational.” These include the possibility that people form their single-valued forecasts such that the costs of overpredicting inflation differ from the costs of underpredicting it. In this situation, the optimal forecasts from question 1 are deliberately chosen not to lie near the center of the uncertainty forecast.7 Nevertheless, as mentioned previously, in measuring attentiveness we equate consistent consumers with attentive consumers.
The Proportion of Attentive Consumers Has Increased with Inflation
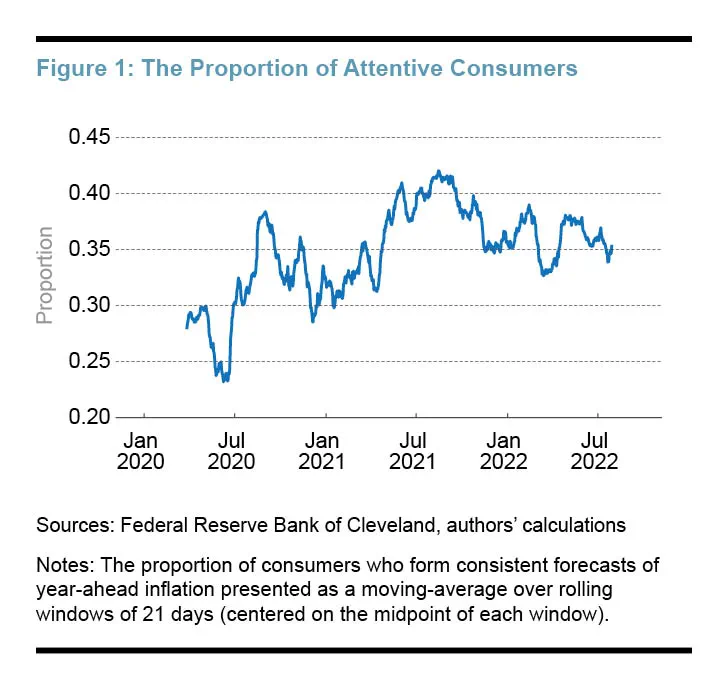
Figure 1 plots the daily proportion of attentive consumers, that is, the proportion of consumers in the Cleveland Fed survey who formed consistent forecasts of year-ahead inflation for the period March 10, 2020, through August 8, 2022. To extract the underlying trend, we present this daily proportion as a moving average computed over rolling windows of 21 days.
Figure 1 shows that the proportion of attentive consumers did not exceed 30 percent in March 2020. This number compares to estimates of about 70 percent to 80 percent for professional forecasters (Clements, 2010). But given the potential costs in time and effort for a given respondent to report his or her expected probability that inflation falls within a range of intervals, it is perhaps not surprising that the majority of consumers replied to the two questions inconsistently. The costs of inconsistency—given that inflation was low and relatively stable until the pandemic—were low. Consumers were thus rationally inattentive.
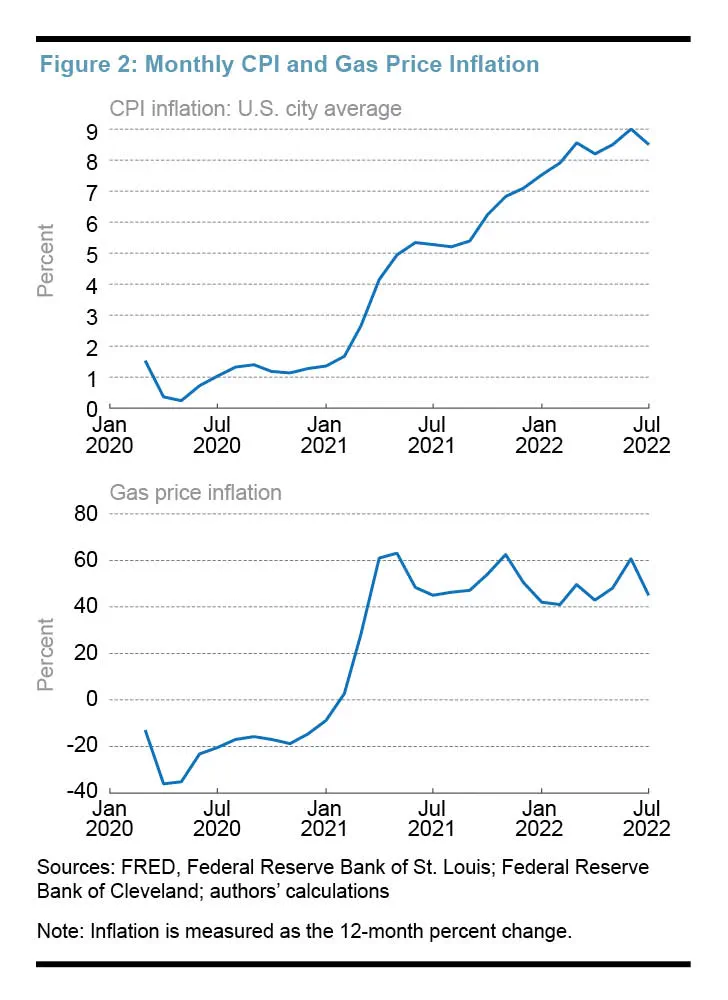
Overall, however, attentiveness has risen over time since the start of the pandemic, as shown in Figure 1, albeit with some volatility and a leveling out around a higher mean over the course of 2022. Comparing this trajectory with that depicted in Figure 2, it seems noteworthy that these rises, falls, and subsequent leveling out of attentiveness around a higher mean appear to correlate in particular with gas price inflation, which is plotted in Figure 2 as the 12-month percent change in gas prices. Arguably, at least for many consumers, gas prices provide a more meaningful and immediate measure of prices in the economy than does the CPI (consumer price index) that measures the average change over time in the prices of a market basket of goods and services, the composition of which the average consumer is perhaps largely unaware. Gas prices have the advantage of being widely seen by the average consumer, even, in many cases, if those consumers do not drive. Campos et al. (2022) find that when households are forming their expectations, they do, indeed, focus on prices that they see more often, either through their own purchases or advertising, including those for food and new vehicles.
The Drivers of Attentiveness
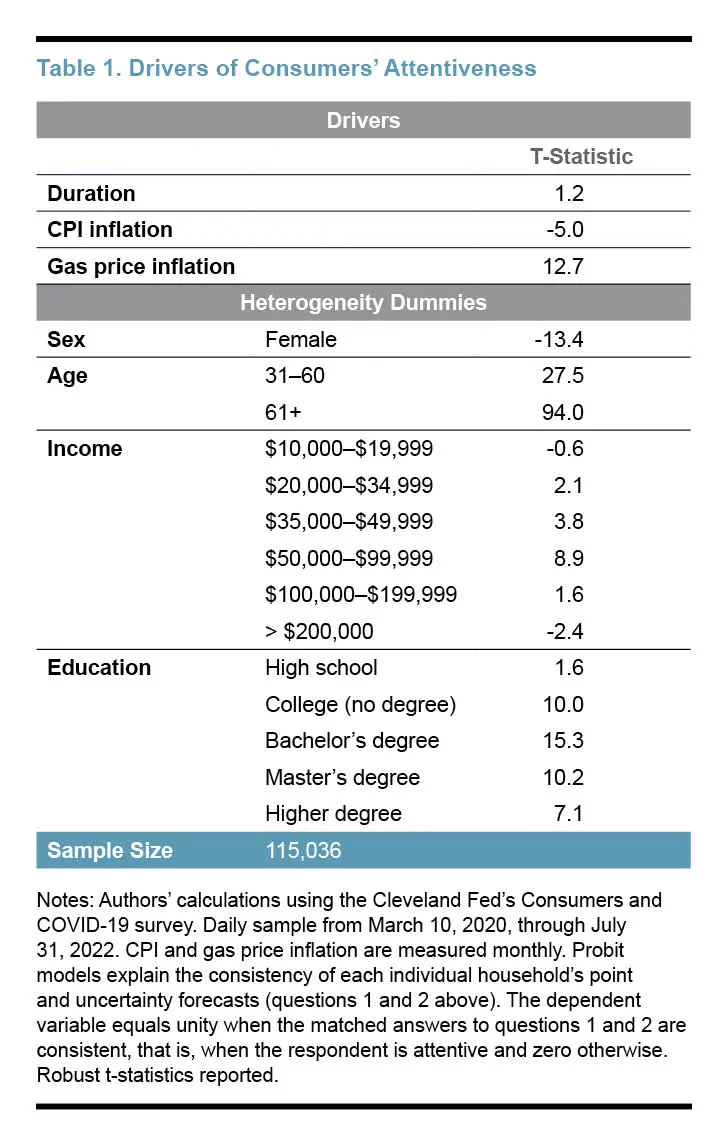
To test the statistical significance of the findings outlined above, we use a probit model to explain the attentiveness of each respondent with respect to a set of driving variables. These variables include the monthly data on CPI inflation and gas price inflation, as plotted in Figure 2. We also consider “duration,” defined as the time (in minutes) that an individual took to complete the survey. To capture possible dissimilarities in consistency across different household types, we include in the model a set of dummy variables to capture the age, sex, self-reported (yearly net disposable) income, and education level of each respondent,8 the idea being that personal experiences have been found to help shape an individual’s expectations (Malmendier and Nagel, 2016).
Table 1 shows that gas-price inflation helps explain in a statistically significant manner the rises, and indeed some smaller dips, in attentiveness. While the overall CPI is also statistically significant, its effect is much weaker. The negative sign of the estimated coefficient on CPI inflation also appears to run counter to our argument that rises in inflation drive consumers toward attentiveness. But it is important to note that this apparent anomaly reflects the highly correlated nature of CPI and gas price inflation.9 Table 1 also shows only a weak tendency for those who take more time to complete the survey, captured in the table as “duration,” to be more consistent in their answers to the two survey questions.
Turning to whether there is evidence for heterogeneity, Table 1 shows that attentiveness varies, in a statistically significant manner, with demographic and socioeconomic factors. Respondents aged 31 or older, with incomes between $20,000 and $200,000, and who are better educated are more likely to be attentive.10 Those aged 61 and older are particularly likely to be attentive. When we look at the marginal effects associated with the t-statistics reported in Table 1, relative to those aged 30 or younger, the probability of attentiveness is 35 percentage points higher.
Somewhat of a puzzle is the finding that based on our measure women are less attentive than men when it comes to inflation expectations. Previous research has debated the finding that surveys often indicate that women have higher single-valued inflationary expectations than men (Meyer and Venkatu, 2011; Weber et al., 2022).11
Implications for Future Inflation
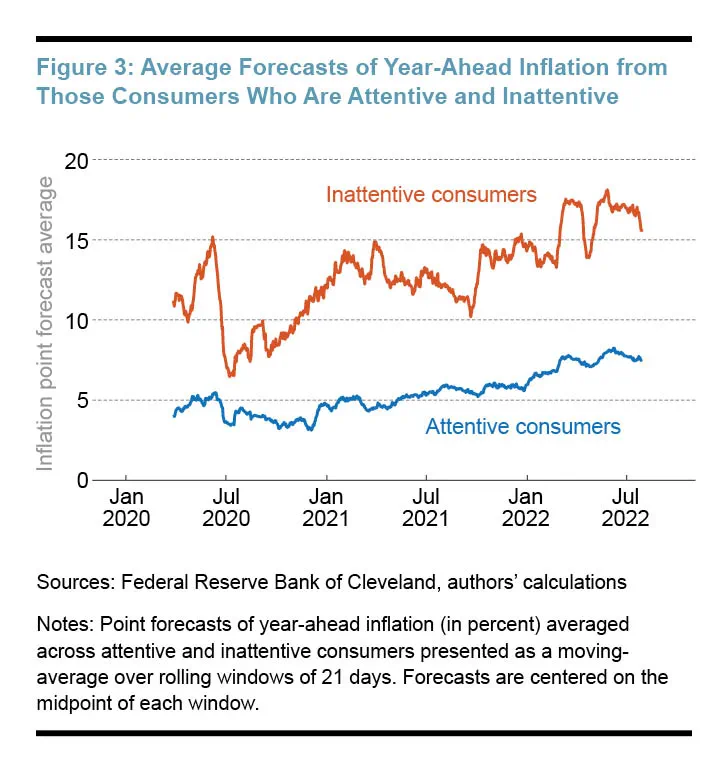
If we separate the forecasts for future inflation given by the attentive respondents and compare them with those from the inattentive respondents, we see clear and important differences. Figure 3 plots the inflation forecasts from question 1 averaged across these two groups of respondents. In each case, we present the trimmed mean forecast to remove outliers.12 Figure 3 shows that while the inflation forecasts from both attentive and inattentive respondents have trended up since the onset of the pandemic—in line with inflation expectations measures from other sources, such as the indirect consumer inflation expectations measure proposed by Cleveland Fed researchers—inflationary pressures look much less acute when we look at data from only the attentive respondents.13 That said, the forecasts of even the attentive respondents have steadily and consistently risen over the last two years. But inattentive respondents on average forecast much higher inflation. This could still be rational if the inattentive respondents weigh the costs of underpredicting inflation more heavily than the costs of overpredicting it. Rational respondents would then report single-valued forecasts that are high relative to their uncertainty forecasts (Patton and Timmermann, 2007). Interestingly, our finding that inattentive respondents tend to emphasize unfavorable scenarios (that is, report single-valued forecasts for inflation that are relatively high) differs from the historical behavior of professional forecasters, who have been found to do the reverse (Engelberg et al., 2009; Clements, 2010).
Conclusion
With the rise in US inflation since the COVID-19 pandemic and higher gas prices in particular, a growing proportion of consumers is now reporting consistent forecasts of inflation when asked for forecasts in two different ways. This finding is in line with the view that households have become more attentive to inflation as inflation, and its uncertainty, has risen. Importantly, from the perspective of users of inflationary expectations data, the year-ahead forecasts averaged across attentive consumers look quite different from those of inattentive consumers. A possible implication of our finding, then, is that with consumers more alert to inflation, their expectations are more informative, likely to be less sticky, and so should be tracked closely by policymakers when assessing inflationary pressures in the economy. They represent consumers’ more-considered views of what will happen to inflation. However, only time will tell whether these expectations prove to be more accurate forecasts than those from inattentive consumers. But this increased public attentiveness also suggests that the public may now be better attuned to central bank communications. Targeted and new forms of communication may be needed, however, to reach the inattentive consumers to encourage them to moderate their inflationary expectations.14
The views authors express in Economic Commentary are theirs and not necessarily those of the Federal Reserve Bank of Cleveland or the Board of Governors of the Federal Reserve System. The series editor is Tasia Hane. This work is licensed under a Creative Commons Attribution-NonCommercial 4.0 International License. This paper and its data are subject to revision; please visit clevelandfed.org for updates.
Endnotes
- While the last scheduled update to the “Consumers and COVID-19” data page occurred on May 4, 2022, the survey itself is still active. See https://www.clevelandfed.org/covid19 for details. Return to 1
- See Powell (2022), https://www.federalreserve.gov/newsevents/speech/powell20220826a.htm. Return to 2
- As a precursor to this quantitative question, respondents are asked a framing question soliciting their qualitative forecast: “Over the next 12 months, do you think that there will be inflation or deflation?” If they reply saying that they expect deflation, then question 1 asks for their single-valued forecast of deflation instead of inflation. Because of ambiguity around how respondents report single-valued deflation forecasts (which meant that 11 people, out of our sample of more than 100,000, gave negative forecasts for deflation), we work with the negative of the absolute value of their answer to question 1. This ensures quantitative deflation forecasts are always negative. Five respondents (less than 0.01 percent of our sample) gave negative single-valued forecasts for inflation despite qualitatively saying that they expect inflation. We work with these forecasts as is, although these contradictory answers are themselves another form of inconsistency. Return to 3
- It is not clear whether the answers to question 1 should be interpreted as the mean, mode, or median of a respondent’s underlying probabilistic forecast of future inflation. Accordingly, we follow Engelberg et al. (2009) and calculate nonparametric bounds from the answers to the uncertainty question (question 2 in our survey) that apply for the mean, mode, and median. We focus on the mean, emphasizing that all the empirical results in this Commentary are very similar if instead we interpret question 1 as providing forecasts for the mode or median. In the mean case, the lower and upper bounds amount to computing the mean from question 2 assuming that the probability mass within each of the 10 intervals is all at either an interval’s lower or upper endpoint. Given that the outer intervals, (1) and (10) in question 2, are open, when calculating the lower and upper bounds we assume that the upper outer interval ends at +25 percent and the lower outer interval ends at -25 percent. Our results are again robust to this assumption. Return to 4
- More generally, macroeconomists have proposed various models of informational rigidities that lead rational agents with imperfect information to form expectations that depart from full-information rational expectations. Mackowiak et al. (2022) review the literature on rational inattention and the theoretical models that explain it. Return to 5
- Consistent with this view, Clements (2010) finds evidence (albeit for professional forecasters) that single-valued forecasts are more frequently updated than uncertainty forecasts because they are less costly in time and effort to produce and often have a higher profile. Return to 6
- Patton and Timmermann (2007) show how under asymmetric loss it can be rational to report a point forecast that need not be the mean, mode, or median, as considered in our bounds analysis. Clements (2010) finds little evidence that asymmetric loss explains the inconsistency of professional forecasters. Engelberg et al. (2009) test and reject the alternative view that it is the tendency of survey respondents to round probabilities, when replying to questions like question 2, that explains inconsistencies. Return to 7
- The excluded dummy variables are defined as follows. Dummy=0 for male, aged 30 or younger, income less than $10,000, and education less than high school. Respondents are asked to indicate their gender as male, female, or other. A small percentage (0.34 percent) of respondents replied “other”; we focus on those respondents who identified as male or female. Return to 8
- If we re-run the probit model with CPI inflation alone, dropping gas-price inflation from the model, the estimated coefficient on CPI inflation becomes positive and is much more statistically significant, albeit the t-statistic is smaller than that reported for gas-price inflation in Table 1. Return to 9
- Malmendier and Nagel (2016) propose that the young, with less historical experience of high inflation, update their inflationary expectations more strongly in response to surprise inflation than older people. Our results do not speak against this, but they do imply that if the young are updating their expectations more strongly, their doing so is not translating into greater attentiveness. Return to 10
- Weber et al. (2022) find that the difference in inflationary expectations between men and women disappears when one controls for who does the grocery shopping. Our surveys include a question asking each respondent if the respondent is the primary grocery shopper in the household, but only from December 2020. When estimating our probit model over this shorter sample from December 2020, so that we can control for who does the grocery shopping, we still find that men are more attentive than women. Estimating over this shorter sample also lets us see whether other characteristics of our respondents, as captured by additional questions introduced in our survey after it first began, are important. Of these we would emphasize that for those with greater math literacy, the probability of attentiveness is 8 percentage points higher (and statistically significant with a t-statistic of 16.7). Literacy is judged by the following question: “Imagine there are white and black balls in a ballot box. You draw a ball 70 times. 56 times, you have drawn a white ball, 14 times a black ball. Given this record, what would you say is the probability of drawing a black ball the next time?” Return to 11
- We trim the top 2 percent and bottom 2 percent of single-valued forecasts. Return to 12
- See Hajdini et al. (2022) for the measure of indirect consumer inflation expectations. Return to 13
- The randomized controlled trials conducted by Coibion et al. (2022) evidence how individuals’ inflation expectations can be sensitive to different forms of central bank communications. Return to 14
References
- Bracha, Anat, and Jenny Tang. 2022. “Inflation Levels and (In)Attention.” Working paper 22–4. Federal Reserve Bank of Boston. https://doi.org/10.29412/res.wp.2022.04.
- Carroll, Christopher D. 2003. “Macroeconomic Expectations of Households and Professional Forecasters.” The Quarterly Journal of Economics 118 (1): 269–98. https://doi.org/10.1162/00335530360535207.
- Cavallo, Alberto, Guillermo Cruces, and Ricardo Perez-Truglia. 2017. “Inflation Expectations, Learning, and Supermarket Prices: Evidence from Survey Experiments.” American Economic Journal: Macroeconomics 9 (3): 1–35. https://doi.org/10.1257/mac.20150147.
- Clements, Michael P. 2010. “Explanations of the Inconsistencies in Survey Respondents’ Forecasts.” European Economic Review 54 (4): 536–49. https://doi.org/10.1016/j.euroecorev.2009.10.003.
- Coibion, Olivier, Yuriy Gorodnichenko, and Michael Weber. 2022. “Monetary Policy Communications and Their Effects on Household Inflation Expectations.” Journal of Political Economy 130 (6): 1537–84. https://doi.org/10.1086/718982.
- “Consumers and COVID-19.” 2022. Federal Reserve Bank of Cleveland. May 4, 2022. https://www.clevelandfed.org/indicators-and-data/consumers-and-covid-19.
- Engelberg, Joseph, Charles F. Manski, and Jared Williams. 2009. “Comparing the Point Predictions and Subjective Probability Distributions of Professional Forecasters.” Journal of Business & Economic Statistics 27 (1): 30–41. https://doi.org/10.1198/jbes.2009.0003.
- Hajdini, Ina, Edward S. Knotek II, Mathieu Pedemonte, Robert Rich, John Leer, and Raphael Schoenle. 2022. “Indirect Consumer Inflation Expectations.” Economic Commentary, no. 2022–03 (March). https://doi.org/10.26509/frbc-ec-202203.
- Mackowiak, Bartosz, Filip Matejka, and Mirko Wiederholt. Forthcoming. “Rational Inattention: A Review.” Journal of Economic Literature.
- Malmendier, Ulrike, and Stefan Nagel. 2015. “Learning from Inflation Experiences.” The Quarterly Journal of Economics 131 (1): 53–87. https://doi.org/10.1093/qje/qjv037.
- Meyer, Brent, and Guhan Venkatu. 2011. “Demographic Differences in Inflation Expectations: What Do They Really Mean?” Economic Commentary, no. 2011–07 (May). https://doi.org/10.26509/frbc-ec-201107.
- Patton, Andrew J., and Allan Timmermann. 2007. “Testing Forecast Optimality Under Unknown Loss.” Journal of the American Statistical Association 102 (480): 1172–84. https://doi.org/10.1198/016214506000001176.
- Pedemonte, Mathieu, Michael McMain, and Chris Campos. 2022. “Understanding Which Prices Affect Inflation Expectations.” Economic Commentary, no. 2022–06 (April). https://doi.org/10.26509/frbc-ec-202206.
- Powell, Jerome H. 2022. “Monetary Policy and Price Stability: A Speech at ‘Reassessing Constraints on the Economy and Policy,’ an Economic Policy Symposium Sponsored by the Federal Reserve Bank of Kansas City, Jackson Hole, Wyoming, August 26, 2022.” https://www.federalreserve.gov/newsevents/speech/powell20220826a.htm.
- Sims, Christopher A. 2003. “Implications of Rational Inattention.” Journal of Monetary Economics, Swiss National Bank/Study Center Gerzensee Conference on Monetary Policy under Incomplete Information, 50 (3): 665–90. https://doi.org/10.1016/S0304-3932(03)00029-1.
- Weber, Michael, Francesco D’Acunto, Yuriy Gorodnichenko, and Olivier Coibion. 2022. “The Subjective Inflation Expectations of Households and Firms: Measurement, Determinants, and Implications.” Journal of Economic Perspectives 36 (3): 157–84. https://doi.org/10.1257/jep.36.3.157.
Suggested Citation
Braitsch, Hana, and James Mitchell. 2022. “A New Measure of Consumers’ (In)Attention to Inflation.” Federal Reserve Bank of Cleveland, Economic Commentary 2022-14. https://doi.org/10.26509/frbc-ec-202214
This work by Federal Reserve Bank of Cleveland is licensed under Creative Commons Attribution-NonCommercial 4.0 International


- Share