

Which Industries Received PPP Loans?
The 2020 COVID-19 pandemic and the measures taken by government officials to curb the spread of the coronavirus drastically reduced revenue for many small businesses across the United States. Congress and the Treasury Department recognized the scope of the challenges quickly with the Coronavirus Aid, Relief, and Economic Security (CARES) Act. The act included funding for up to $659 billion of Paycheck Protection Program (PPP) loans earmarked for small businesses. More money was devoted to this program than any other in the fiscal response to the pandemic. The intent of PPP loans was to provide “small businesses with the resources they need to maintain their payroll, hire back employees who may have been laid off, and cover applicable overhead.”1 As long as businesses document certain conditions, notably, maintaining or rehiring their workforces, the PPP loan will be converted to a grant and be forgiven.
This Commentary examines the financial challenges faced by small businesses during the pandemic and estimates the impact of the PPP loan program by industry sectors.
We find that PPP loans were both large and widely sought by US businesses. The support provided by PPP loans reached small businesses across most industry categories in large enough amounts to support employment levels for at least two and half months. Nonetheless, there are important differences in the coverage of the program across industry sectors that are not just a function of the differing economic impact that the pandemic had on those industries.
While it is challenging to isolate the impact of PPP loans given that policymakers intervened in the economy quite broadly, the facts that small-business employment recovered more quickly than that of larger businesses and that the number of bankruptcies to date has been limited point to the impact of the program. A better understanding of the program’s coverage and effectiveness is critical because small businesses will likely continue to face challenges until the pandemic is over.
Impact of the Pandemic on Small-Business Revenues
Data on the pandemic’s impact on small-business revenues are available from Opportunity Insights, a research institute associated with Harvard and Brown Universities. The institute obtains data from payment transactions and has reported revenues for four categories of small businesses since January 10, 2020.2 The data show that small businesses in all of these categories have experienced large revenue shortfalls since the beginning of 2020. Revenues in the leisure and hospitality category were down about 70 percent initially and down persistently about 45 percent through December 2020 (figure 1). The categories of education and health services and retail and transportation also experienced smaller but still large and persistent revenue losses.
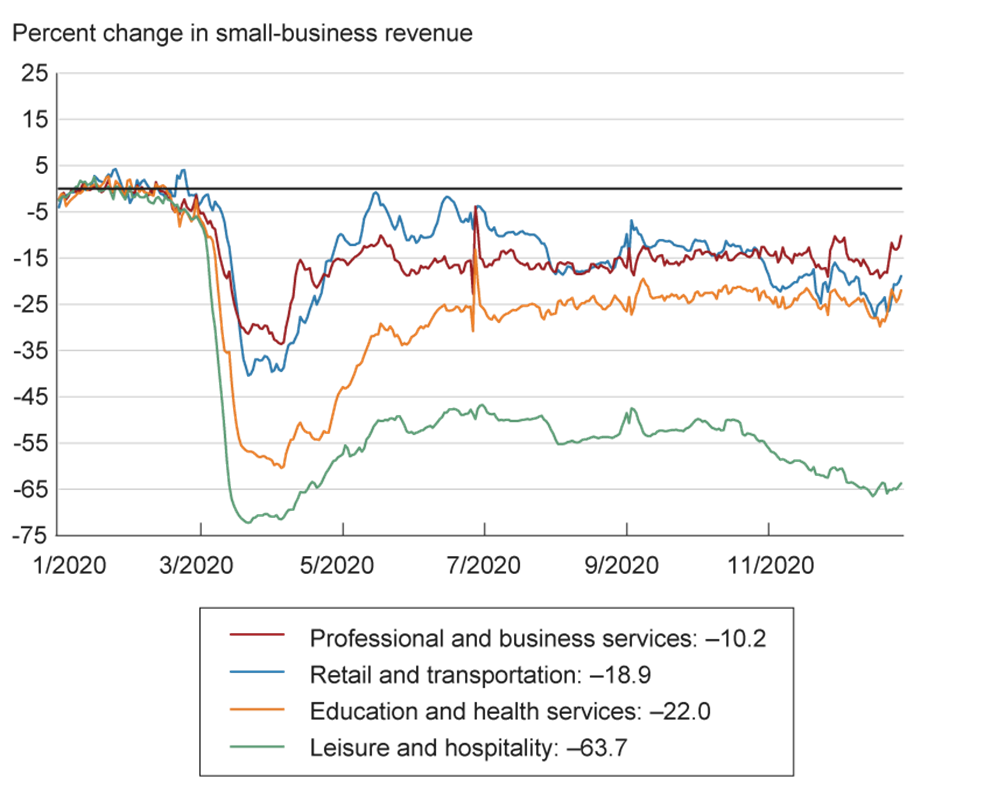
Many anecdotal sources corroborate the Opportunity Insights data and support the conjecture that revenue losses experienced by small businesses during this recession have been more sudden and far larger than during a typical recession. The Society for Human Resource Management (SHRM) reported that 42 percent of the small business owners it surveyed had to close their businesses temporarily because of the pandemic, and 62 percent of small businesses reported a general decrease in revenue. This survey was conducted in mid-April 2020, indicating how suddenly this recession impacted small businesses (SHRM, 2020).
The scale of these revenue losses is large enough that many of these small businesses likely would have failed had they received no assistance. A Federal Reserve Small Business Credit Survey conducted in 2019 asked small-business owners how they would respond to an unexpected financial loss equal to two months of revenues. Seventeen percent of respondents reported that they would either close or sell the business.(Federal Reserve Banks, 2020). Larger percentages of respondents reported that they would lay off employees (33 percent), downsize operations (30 percent), or defer expenses (29 percent) as nonexclusive methods to reduce costs. We will probably never have a complete accounting of the revenue losses of small businesses, but if we accumulate the daily revenue losses of the retail and transportation sector in 2020 as reported by Opportunity Insights, we see that on average small businesses in the sector lost 1.5 months’ worth of revenue. For the harder-hit set of leisure and hospitality companies, the Opportunity Insight data indicate 5.4 months’ worth of lost revenue between March and December.
Despite the clear loss of revenues, a surprising number of businesses appear to have avoided permanent closure due to the pandemic. A frequently cited statistic on small-business failures, reported by the Society of Human Resource Management and based on the same survey conducted in mid-April 2020, is that 52 percent of small businesses expected to be out of business within six months if the COVID-19 pandemic continued (SHRM, 2020).
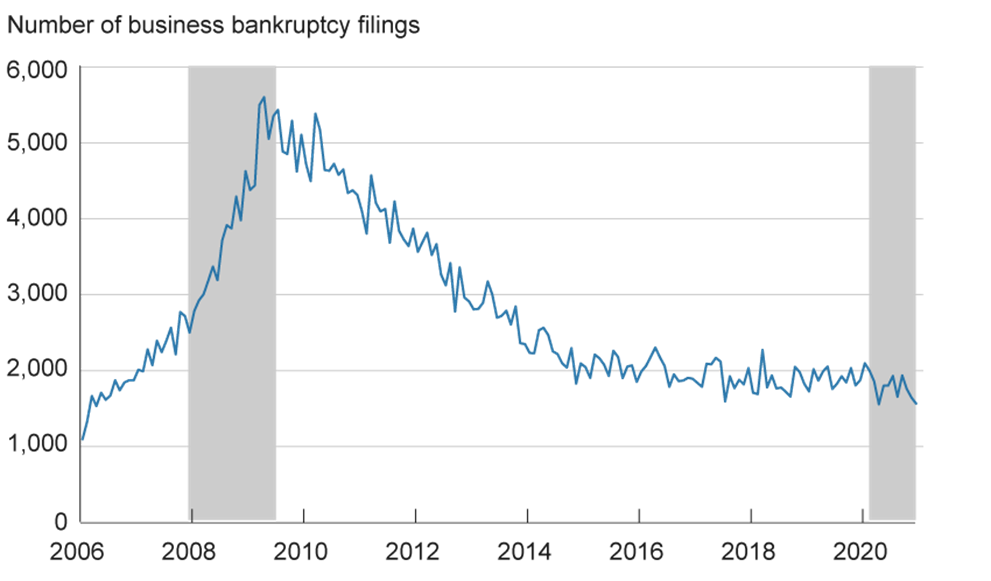
But despite the large shock to revenues, business bankruptcy filings had not accelerated as of December 2020 (the latest data available; see figure 2). During the Great Recession, business bankruptcies had risen 58 percent by the eleventh month of the recession, but by the same point in this recession, bankruptcies have fallen 25 percent. Small businesses can close without filing for bankruptcy, but bankruptcy counts typically include a large number of small businesses. Greenwood, Iverson, and Thesmar (2020) use a simple model to predict that bankruptcies for businesses of all sizes will rise 140 percent from 2019 levels, although according to this simple model, some of this rise should already be evident. How the bankruptcy status of small businesses actually evolves could have big implications on the economic outlook for both employment and investment: Weak small-business growth hindered the recovery from the Great Recession. Fortunately, today’s bankruptcy data are not following that pattern to date. PPP loans have likely played an important part in reducing the number of bankruptcies, but fully evaluating the causal impacts of PPP loans on this outcome will be econometrically challenging, and the required data are not yet available.
Data on PPP Loans by Sector
To begin to evaluate the impact of PPP loans, we need to know how many businesses the program reached, how generously the program reached businesses in different industry sectors, and how large the loans were relative to the size of the businesses that received them. In this section, we describe the data we use to obtain this information from loan-level data.
To identify the small businesses that obtained PPP loans, we use Small Business Administration (SBA) data on PPP loans as of November 24, 2020, which we believe are the most complete accounting for PPP loans made in 2020.3 These data provide the specific loan amounts, the name of the beneficiary, and an NAICS code, which identifies the industry sector of the firm. The data include 5,155,987 loan records with a total value of approved loans of more than $522 billion. Both of these figures are updated from those reported in the August 8 SBA release (date of program completion), which were 5,212,128 loans and a total of $525 billion in approved loans. The reduction in the number of loans likely reflects the fact that some PPP loans were canceled while other loan amounts and other records appear to have been corrected. These data almost certainly still contain some errors, but they are the most complete report of PPP loan recipients available that can be used to assign loans to sectors.4
To estimate the reach of the PPP by sector, we need to know how many loans went to each sector as a percentage of the total number of small businesses in the sector. For the total number of small businesses in each sector, we use data from the Census Bureau’s Statistics of US Businesses (SUSB) to identify a count of firms with fewer than 500 employees by NAICS code.5 The SUSB data derive from the Census Bureau’s Business Register, which uses tax and other administrative records to track business entities with employees for the Census Bureau’s economic surveys.6 The most recent data available are from 2017.
The CARES Act allowed for some firms with more than 500 employees to qualify for loans using the SBA size standard applicable for their specific industry.7 For example, carpet and rug mills with fewer than 1,500 employees and home builders with any employment level and annual receipts of less than $39.5 million would qualify for PPP loans. In addition, the SBA further extended its criteria on April 6, 2020, to any business with a tangible net worth of less than $15 million and an average net income over the previous two fiscal years of less than $5 million. Unfortunately, we cannot use these SBA’s alternative size standards to identify firms that qualified for loans. The standards are not available in the SUSB data, and the SBA did not collect information on the standard that the business used to claim that it qualified. In addition, the inspector general of the SBA identified “355 businesses that obtained PPP loans totaling approximately $856 million dollars that may have been erroneously approved” because they were larger than 500 and did not meet the applicable alternative standard (Inspector General, 2021). So while an imperfect indicator for qualifying business, the 500-employee cutoff is the best criterion we have for identifying small businesses and thus the one we use for our comparisons.
Finally, to estimate how large the loans were relative to the size of the businesses that got them, we use the SUSB data to determine the size of small businesses in each sector in terms of average payroll. Again these data are from 2017.
To make these two data sources compatible, we need to exclude three categories of loans from the PPP dataset. First, we exclude loans with a missing NAICS code or those that used 99, which is the code for unclassified businesses. Second, we exclude loans with NAICS codes that are not part of the SUSB dataset; these are in the public administration and rail transport sectors. These exclusions account for 235,671 loans, but these were substantially smaller loans on average.
A more complicated exclusion is nonemployer firms. We are interested in employer firms rather than self-employment, but self-employed individuals sometimes qualified and applied for PPP loans. These are harder to identify in the PPP loan data than it would appear based on the SBA reports. Businesses list the number of “jobs reported,” which the SBA uses in its analysis, but these data are often missing or equal to zero or one for businesses that are likely to have significantly larger employment levels.8 The number of jobs reported did not influence the loan amount, so it is unclear what respondents were basing their counts on. Another anomaly is that “self-employed individual” is a reported business type, but many loans of this type also list “jobs reported” higher than 1.
We address these issues and isolate the employer firms as follows. There were cutoffs for what the loans could be for firms that had no employees other than the owner.9 We exclude all loans below these cutoffs if the firm getting the loan was listed as a self-employed individual with zero, one, or a missing number for jobs. We also treat other firms with missing, zero, or one reported jobs that were close to this loan threshold as nonemployers. Firms classified as a “partnership” or “limited liability partnership” with two jobs reported and that were close to the threshold are also included. Finally, all firms classified as “tenant in common” are treated as nonemployers.
Our resulting count of self-employee firms that received a PPP loan, 335,982, may appear small when compared to the number of self-employee firms reported in the 2017 Nonemployer Statistics Report—more than 25 million—but most self-employed people probably did not take out a PPP loan. Many would likely have benefited more from Pandemic Unemployment Insurance coverage, and businesses were not allowed to use both programs. Table 1 reports the number of loans excluded for each of these reasons and their average amount, along with the number of loans to small-business employers remaining in the data after these exclusions and their average amount.
| Number of loans | Average loan amount ($) | ||
| Full dataset | 5,155,987 | 101,419 | |
| –Missing NAICS code | 219,132 | 43,943 | |
| –Not included in SUSB data | 16,539 | 125,659 | |
| –Nonemployers | 335,982 | 15,258 | |
| Identified employers | 4,584,334 | 110,394 | |
Source: Paycheck Protection Program (PPP) Report, Small Business Administration.
The Number and Average Size of Loans by Sector
Examining PPP loans by NAICS sector reveals that the loans were not distributed evenly to all sectors (table 2). There are large concentrations in the number of loans to the following sectors: construction; professional, scientific, and technical services; health care and social assistance; retail trade; and other services. Other sectors received a far smaller number of PPP loans; notably, utilities and management of companies and enterprises received fewer than 1 percent of all PPP loans. The average loan size also varies substantially in a distinct manner across sectors, with small businesses in the manufacturer sector obtaining an average loan of $232,819, while firms in the other services sector got an average loan of just $58,645.
| NAICS sector | Number of loans | Average loan amount ($) |
| Agriculture, forestry, fishing, and hunting | 134,277 | 58,786 |
| Mining, quarrying, and gas extraction | 20,429 | 219,994 |
| Utilities | 7,928 | 188,179 |
| Construction | 470,515 | 137,189 |
| Manufacturing | 231,582 | 232,819 |
| Wholesale trade | 165,999 | 165,325 |
| Retail trade | 451,611 | 88,973 |
| Transportation and warehousing | 192,621 | 86,947 |
| Information | 68,417 | 134,524 |
| Finance and insurance | 161,261 | 73,186 |
| Real estate and rental and leasing | 226,105 | 66,205 |
| Profesisonal, scientific, and technical services | 609,838 | 107,303 |
| Management of companies and enterprises | 8,780 | 175,008 |
| Administration, support, and waste management | 239,053 | 109,748 |
| Educational services | 81,889 | 146,158 |
| Health care and social assistance | 494,017 | 135,632 |
| Arts, entertainment, and recreation | 118,109 | 67,853 |
| Accommodation and food services | 374,184 | 112,893 |
| Other services (excluding public administration | 527,719 | 58,645 |
| Total | 4,584,334 | 110,394 |
Sources: Paycheck Protection Program (PPP) Report, Small Business Administration; Census Bureau, Statistics of US Businesses (SUSB).
The SBA noted that the PPP reached most industries, while media outlets reported that certain industries were large beneficiaries of the program. While both of these claims are true, they leave unexplored questions about the reach of the program to small businesses within each sector. To answer those questions more precisely, we compare the number of PPP loans that went to each sector as a percentage of the number of small businesses in the sector. As explained above, the total number of small businesses in each sector is calculated using data from 2017.
Overall, we estimate that the loans made would represent 76 percent of employer firms with fewer than 500 employees. Some businesses may have been dissuaded from applying either because they needed to certify that they were being adversely impacted by the COVID-19 pandemic or because they would have to retain their employees in order to see the loan forgiven; businesses experiencing minor effects or businesses that were unable to call back employees may not have applied for PPP loans. Also, not all firms were adversely affected by the pandemic. Even at the point during the pandemic at which small-business revenues were at their lowest (April 26 to May 2), more than 10 percent of firms reported that they were either little or positively affected by the pandemic, according to a Census Bureau survey.10 With a new round of PPP loans signed in to law in December 2020, it will be interesting to see how many additional firms request a PPP loan for the first time and how many firms apply for a second PPP loan.
In most sectors, about 70 percent of small businesses received a PPP loan (figure 3). However, some sectors had considerably more coverage; in a few cases, the number of firms receiving PPP loans in the sector even exceeded the number of small businesses that existed in that sector as of 2017. One reason the percentage of firms receiving loans could have exceeded number of small businesses is that some firms used the alternative SBA size standard for their industry when applying for the loan, as was permitted by the CARES Act.
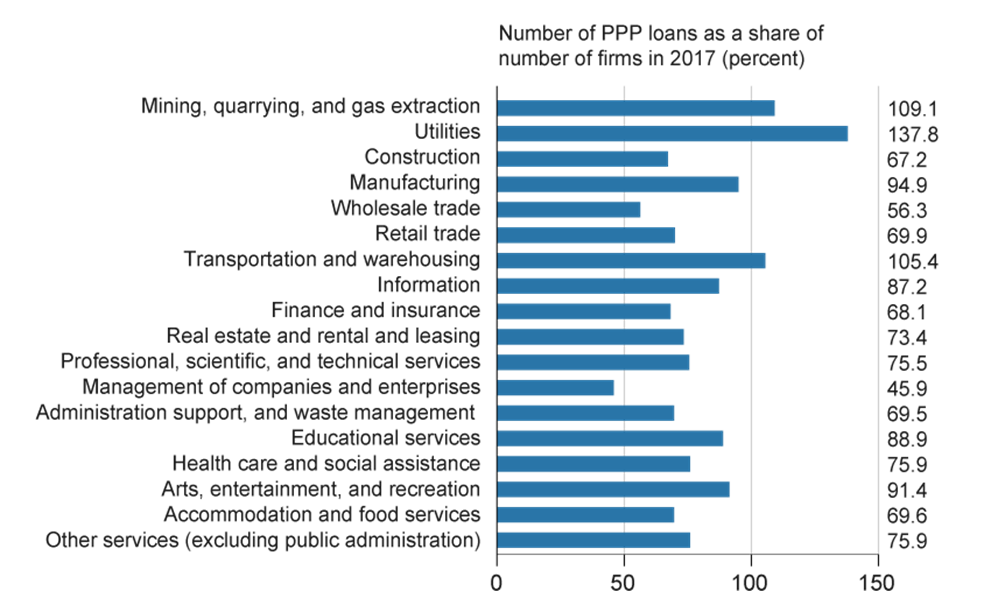
One of the sectors that stands out is mining, quarrying, and oil and gas exploration. In this sector, 9 percent more businesses received PPP loans than existed in SUSB records in 2017. Most of the PPP loans that went to this sector went to oil and gas extraction and support activities for mining (80 percent), which were severely impacted by the pandemic when oil and gas prices fell sharply. The number of firms that could potentially qualify for loans in this sector is hard to determine, but SBA standards allow oil and gas extraction firms with up to 1,250 employees and service firms with receipts less than $41.5 million to apply. While employment in the oil and gas exploration sector grew earlier in the decade, between February 2017 and February 2020 it declined by 7.2 percent, making a sharp rise in the number of firms since 2017 unlikely.11
Another sector in which more small businesses received PPP loans than existed in 2017 is utilities. About half of the businesses in the sector that took out PPP loans are in power generation, with a concentration in solar generation and other electric power generation, a subset of the sector that has actually experienced a decrease in employment of 2.9 percent since 2017.12 It is possible for the number of firms to grow despite employment losses, but the difference between the number of firms taking out PPP loans and the number of existing businesses recorded in the 2017 SUSB data is quite large; that is, the difference would indicate that a large number of relatively small firms had to have been added in this sector since 2017. The power generation subsection of utilities had more than double the number of loans relative to firms listed in 2017, which suggests that further verification of the growth of small businesses in power generation might be warranted. The remaining loans made to the sector were concentrated in water and sewage systems, where the number of firms receiving a PPP loan was about 92 percent of the 2017 count of small firms.
Transportation and warehousing is another sector in which more firms received PPP loans than existed in 2017 (5 percent more loans than the number of companies). The bulk of these loans were made to trucking companies, which received more than 57 percent of the PPP loans made to the sector. This is another industry sector that has seen substantial employment growth since 2017. It seems possible that a surprisingly large number of small businesses were created in this sector over the last three years and that the take-up rate of PPP loans was relatively high.
There are also sectors which appear to have to unusually low levels of loans compared to the number of firms in the sector with fewer than 500 employees as of 2017. To the extent that these outcomes were not intentional or did not reflect the differing extent to which firms were adversely impacted by the pandemic, they may suggest that some aspect of the program’s design had consequences on the take-up rate.
Management of companies and enterprises, a sector which largely includes the offices of holding companies, stands out for its relatively low loan participation rate. The PPP was designed in a such a way that the bulk of lending would likely have gone to active subsidiaries, and most of the employment that is reported would have been coded in other sectors. So despite being one of the largest outliers, this result seems to be consistent with the program’s design.
Interestingly, the accommodation and food service sector, where firms were specifically allowed to receive loans even if their employment size exceeded SBA thresholds, has a relatively low number of loans compared to the number of firms with fewer than 500 employees as of 2017. In this sector, businesses were able to apply if they had subsidiaries or franchises with fewer than 500 employees. This allowed some relatively large firms to apply for loans for several locations. This was the intended outcome, but the relatively low frequency of loans to this sector seems to indicate that many businesses with more than 500 employees did not get loans approved. The wholesale trading sector appears to have taken out fewer PPP loans, with 56 percent of small businesses in the sector taking out loans. There is no pattern in the PPP loan data that explains why fewer wholesalers participated, but it is a sector that has seen below-average employment growth since 2017. From February 2017 to February 2020, employment grew by just 1.6 percent, substantially less than the 4.6 percent growth seen for total nonfarm employment during that period.13 Given that wholesalers are likely to have been impacted by the general retail trade slowdown, this low participation rate suggests the sector could be one example of the program reaching fewer businesses than desired.
The Scale of PPP Loans by Sector
Next we assess how the total amount of PPP lending was distributed across different sectors in terms of payroll expenses. Did some sectors receive more financial support than others? As was shown in table 2, the average size of PPP loans varies substantially by sector, but this finding could simply reflect the size of the small businesses in those sectors. The PPP loan program was designed to cover payroll expenses, and even for small businesses, employment is concentrated in the larger of those firms. To evaluate the scale of PPP loans made to each sector, we make loan amounts comparable by expressing them as a share of 10 weeks of the sector’s payroll payments in the 2017 SUSB data. As can be seen in figure 4, many sectors received PPP funds equivalent to 90 percent to 110 percent of their 10-week payroll expenses.
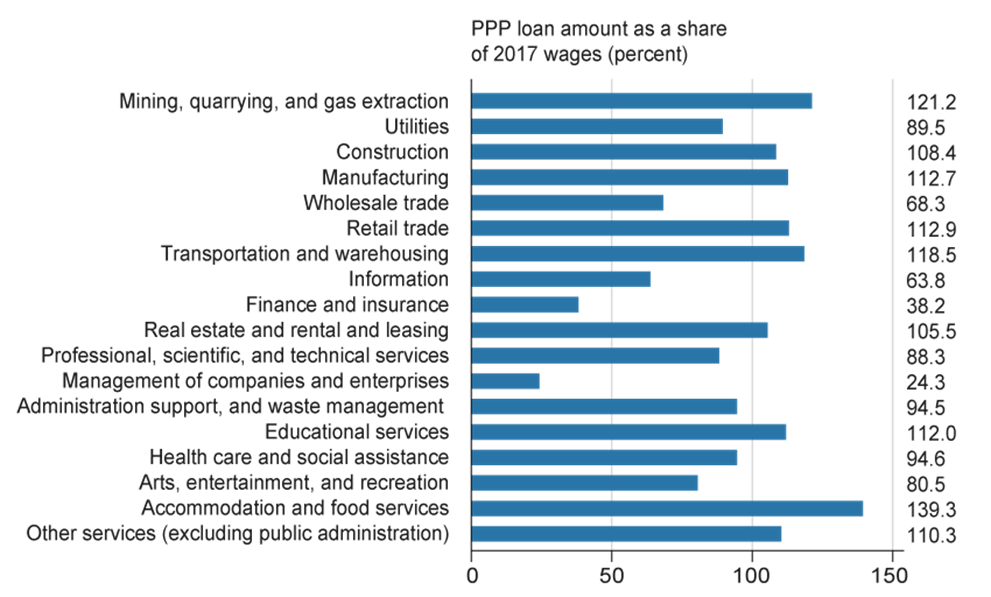
When compared in terms of payroll expenses, wholesalers once again appeared to use the program less than other sectors, as they did when compared by percentage of loans to the sector. Sectors that appeared to use the program more by percentage of loans to the sector (such as mining and transportation) also received a larger share of the PPP loan total in terms of payroll.
The accommodation and food services sector, which was specifically exempted in the CARES Act from the 500 employee maximum requirement, was granted an amount equivalent to 140 percent of its 2017 10-week payroll through PPP loans. The SBA sets the maximum loan amount at $10 million, and 19.1 percent of all loans made at this maximum were provided to firms in this sector. This allocation seemed to be within the Congressional intent surrounding the bill, but several large companies in the sector decided to return their PPP loans after it was made public that they had received PPP funding. Some of these firms were criticized for taking on loans intended for smaller businesses with less access to capital markets.
On the other side of the average, finance and insurance companies received a lower share of their 10-week 2017 payroll expenses (38 percent) through the PPP, even though 68 percent of the companies in the sector are estimated to have received a PPP loan. This outcome likely reflects the $100,000 per employee cap on support of payroll built into the CARES Act; a substantial fraction of employees in the sector earn wages near or above $100,000. From the Occupational Employment Estimates Survey provided by the Bureau of Labor Statistics, the 75th percentile annual wage for the finance and insurance sector is above $90,000, and the 90th percentile annual wage is above $145,000.14
A similar but less extreme difference can be seen in the information sector. This sector has received 64 percent of its 10-week 2017 payroll expenses despite the fact that 87 percent of companies in the sector received a PPP loan. However, subsections of this sector were impacted differently. The motion picture and video industry received approximately 25 percent of the loans issued to the information sector. This industry received about 82 percent of its 10-week 2017 payroll expenses in PPP loans, with about 92 percent of the firms in the industry having received a PPP loan; both of these values are significantly higher than in the sector as whole. This result is congruent with our expectations because the pandemic had a direct impact on this industry.
Conclusion
Overall, PPP loans appeared to reach about 76 percent of US small businesses and to have covered 97 percent of a 10-week period of their payrolls. In addition, PPP loans of $5.3 billion were provided to 335,982 businesses that we identified as likely having no employees. As Hubbard and Strain (2020) indicate, the PPP was a novel program deviating intentionally from traditional stimulus programs to focus on small businesses struggling financially during the pandemic.
This Commentary used detailed PPP loan data to examine the reach and scale of the program. It is clear in the SBA’s data that the program was both large and widely received by smaller US businesses. While high-frequency data show that revenue losses have been sharp and persistent for small businesses in hard-hit sectors such as leisure and hospitality, the program reached businesses throughout the economy including less impacted sectors. We estimate that small businesses in most sectors received between 80 percent and 120 percent of their 2017 payrolls for a 10-week period. From these large loan amounts and the sheer number of loans made to some sectors, we conclude that a substantial number of firms with employment levels above 500 employees received PPP loans.
We believe the differences in loan coverage may be an access issue rather than the result of businesses choosing not to participate. Most small businesses should have been motivated to pursue PPP loans: By design, PPP loans should become grants, and to the extent that the loans do not get forgiven, the terms of the loans—a 1 percent interest rate with deferred payment—would make them extraordinarily attractive for a small business in the midst of a recession. Access issues and coverage differences may result in differences in the performance of small businesses after the crisis, but at this point, the program looks to have been strong enough to delay many bankruptcies.
The views authors express in Economic Commentary are theirs and not necessarily those of the Federal Reserve Bank of Cleveland or the Board of Governors of the Federal Reserve System. The series editor is Tasia Hane. This work is licensed under a Creative Commons Attribution-NonCommercial 4.0 International License. This paper and its data are subject to revision; please visit clevelandfed.org for updates.
Footnotes
- See https://home.treasury.gov/policy-issues/cares/assistance-for-small-businesses. Return to 1
- See https://www.tracktherecovery.org. Return to 2
- These data were made public after major media outlets sued the SBA and Treasury under the Freedom of Information Act to release the beneficiaries of PPP loans. Return to 3
- There are observations with no business identified, missing industry codes, and many observations with no information on the number of jobs reported to be saved. This is not unusual for large administrative datasets, and the errors do not appear to be large enough to substantially hinder our analysis. For a report identifying similar problems with the SBA’s internal and public data, see Office of the Inspector General (2021). Return to 4
- The standard SBA cutoff for a small business is 500 employees although SBA rules allow firms with more than 500 employees to be counted as small in number of narrowly defined industries. Return to 5
- SUSB data exclude nonemployer firms, along with data on private households, railroads, agricultural production, and most government entities. We exclude the related NAICS codes in the PPP loan data. Return to 6
- A full list of SBA size standards can be found in the Federal Register, Title 13, chapter 1, §121.201. See Electronic Code of Federal Regulations (eCFR). Return to 7
- An examination of loans shows that more than 19.7 percent of missing, 0, or 1 employee firms were classified as corporations, a percentage that seems far too high because they have so few employees. Return to 8
- Business owners were capped on the loan amount that could be associated with their own compensation, primarily at $20,833. A large number of loan records for all business types appear exactly at the cap values or just below it, which likely indicates that the loan application contained no employee payroll information beyond the owner/operator. A cap of $15,385 was used if firms applied before June 5, 2020, and used an 8-week coverage period. Return to 9
- Small Business Pulse Survey Data, US Census Bureau. See https://portal.census.gov/pulse/data/#data. Return to 10
- Data from US Bureau of Labor Statistics, Current Employment Statistics. https://data.bls.gov/PDQWeb/ce. Return to 11
- Data from US Bureau of Labor Statistics, Current Employment Statistics. https://data.bls.gov/PDQWeb/ce. Return to 12
- Data from US Bureau of Labor Statistics, Quarterly Current Employment Statistics. https://data.bls.gov/PDQWeb/ce. Return to 13
- US Bureau of Labor Statistics, May 2019 National Industry-Specific Occupational Employment and Wage Estimates. Return to 14
References
- Greenwood, Robin, Benjamin Iverson, and David Thesmar. 2020. “Sizing Up Corporate Restructuring in the COVID Crisis.” NBER Working Paper No. 28104. https://doi.org/10.3386/w28104.
- Hubbard, R. Glenn, and Michael R. Strain. 2020. “Has the Paycheck Protection Program Succeeded?” Brookings Papers on Economic Activity, BPEA Conference Drafts. https://doi.org/10.3386/w28032.
- Federal Reserve Banks. 2020. “Small Business Credit Survey, Report on Employer Firms.” Federal Reserve Banks of Atlanta, Boston, Chicago, Cleveland, Dallas, Kansas City, Minneapolis, New York, Philadelphia, Richmond, St. Louis, and San Francisco. https://www.fedsmallbusiness.org/survey/2020/report-on-employer-firms.
- Office of the Inspector General. 2021. “Inspection of SBA’s Implementation of the Paycheck Protection Program.” Small Business Administration, Report Number 21-07. https://www.sba.gov/sites/default/files/2021-01/SBA%20OIG%20Report-21-07.pdf?utm_medium=email&utm_source=govdelivery.
- SHRM. 2020. “Navigating COVID: Impact of the Pandemic on Small Businesses.” Society for Human Resource Management. https://shrm.org/hr-today/trends-and-forecasting/research-and-surveys/documents/shrm%20cv19%20sbo%20research%20presentation%20v1.1.pdf.
Suggested Citation
Borawski, Garrett, and Mark E. Schweitzer. 2021. “Which Industries Received PPP Loans?” Federal Reserve Bank of Cleveland, Economic Commentary 2021-08. https://doi.org/10.26509/frbc-ec-202108
This work by Federal Reserve Bank of Cleveland is licensed under Creative Commons Attribution-NonCommercial 4.0 International


- Share