

Trends in the Noninterest Income of Banks
A large fraction of banks’ revenue comes from noninterest income, which includes items such as overdraft fees and ATM charges. We investigate whether this source of income has increased since the financial crisis, given that banks’ interest income may have been impacted by the low interest rate environment. We find that total noninterest income has actually decreased. However, service charges, one of the subcomponents of noninterest income, have increased. The increase in service charges is masked in the data on total noninterest income because other types of noninterest income, specifically securitization fees and other types of noninterest income affected by the crisis, fell during the same period.
Traditionally, banks have generated most of their income by issuing loans and collecting the interest payments. However, a large fraction of bank revenue also comes from so-called “noninterest income,” which includes items such as overdraft fees and ATM charges. In the wake of very low interest rates since the financial crisis, it might seem natural that banks would make greater use of noninterest income to make up for any declines they might be experiencing in interest income.
We take a closer look at this important source of bank revenue, documenting how it and its components have changed over time, particularly in response to the financial crisis. We find that while banks have not increased their total noninterest income as a share of operating revenues, they have increased one type of noninterest income, namely, income from service charges. The increase in service charges is masked in the data on total noninterest income because other types of noninterest income fell during the same period, specifically, those associated with the financial and housing markets that collapsed during the financial crisis—securitization, trading, and real estate. Finally, we investigate the possible reasons for the changes we observe in banks’ use of the different types of noninterest income. While overall use of noninterest income has decreased, we find evidence that banks have increased their revenues from service charges to make up for interest income lost in the low interest rate environment.
What Is Noninterest Income?
Broadly speaking, noninterest income is defined as income generated by banks from sources unrelated to the collection of interest payments. To the average consumer, service fees are probably the most familiar type of noninterest income, with common forms being ATM fees, loan origination fees, or charges for a safety deposit box. Another type of noninterest income comes from fees banks charge when they originate and distribute loans. In these cases, the bank makes a loan and then sells it to another bank or nonbank, which often intends to bundle a number of loans and securitize them. Rather than receiving interest payments for the life of the loan, the bank originating the loan gets a payment for selling it and may also collect fees if it continues to service the loan (collecting the payments and passing them on to the loan purchaser). Other forms of noninterest income come from nontraditional bank activities, such as brokering securities, arranging mergers and acquisitions for firms, and trading stocks and bonds. Banks also earn noninterest income from real estate and from selling insurance.
Noninterest income makes up a significant portion of most banks’ revenue. As of the first quarter of 2018, noninterest income was a full 34 percent of total bank operating revenue (defined as the sum of net interest income and noninterest income), or $68 billion out of $200 billion. Before the financial crisis, the ratio of noninterest income to operating revenue was even higher, reaching 46 percent in 2003, as seen in figure 1. The ratio is now about 10 percent lower than before the crisis. In absolute terms, noninterest income actually rose between 2005 and 2018, but operating revenue rose even faster. Over this period, noninterest income increased by 25 percent, but operating revenue increased by 71 percent.1
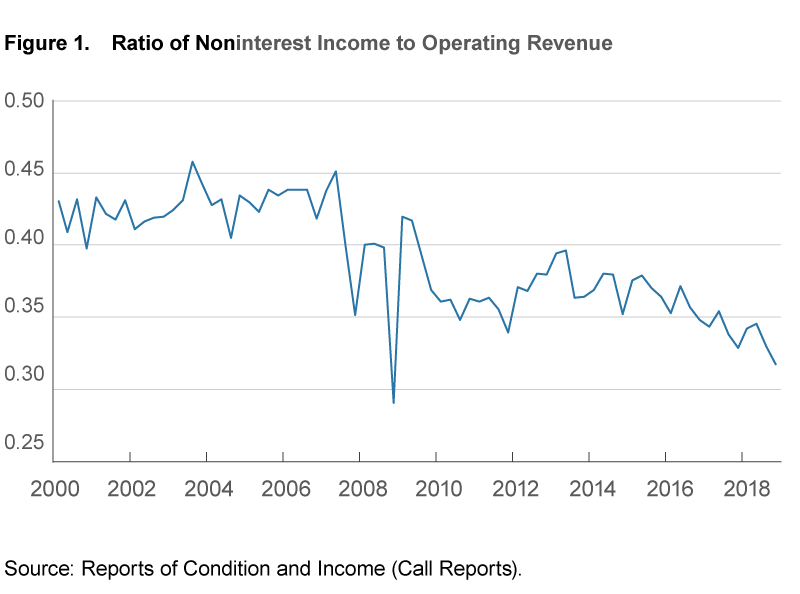
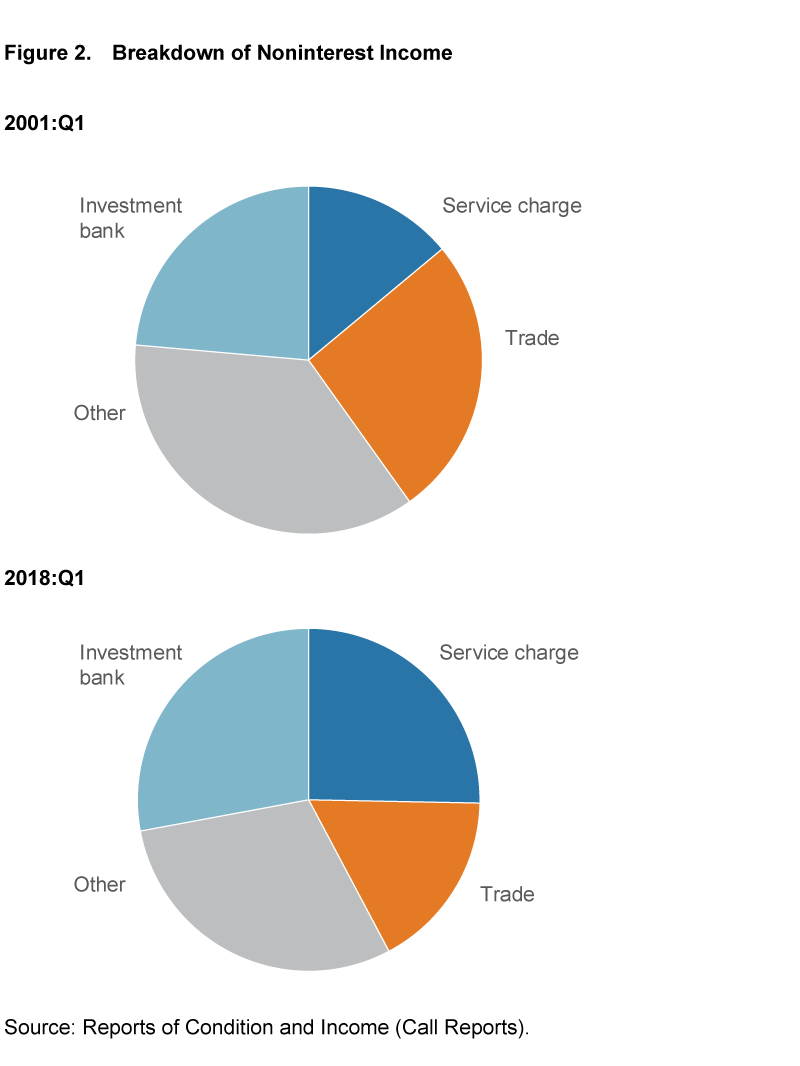
Figure 2 shows changes in the proportions of the major categories of noninterest income for all commercial banks from 2001 to 2018. Service charges, a category which includes overdraft fees, ATM fees, and maintenance charges, was the smallest category in 2001, but it grew significantly, increasing from 14.0 percent of noninterest income in 2001 to over 25 percent in 2018.2 A large category of noninterest income is income from investment banking activities, which includes fees from the administration of trust funds, gains and losses on venture capital investments, and fees from various underwriting activities. This category rose from 23.6 percent of noninterest income in 2001 to 28.0 percent in 2018. Trade became the smallest category in 2018, falling from 26.2 percent of total noninterest income in 2001 to 17.1 percent in 2018. The largest slice, “other,” which consists of income from sources such as food stamp processing, bank-owned rental property, foreign exchange, and many others, fell from 36.6 percent of total noninterest income in 2001 to 29.1 percent in 2018.
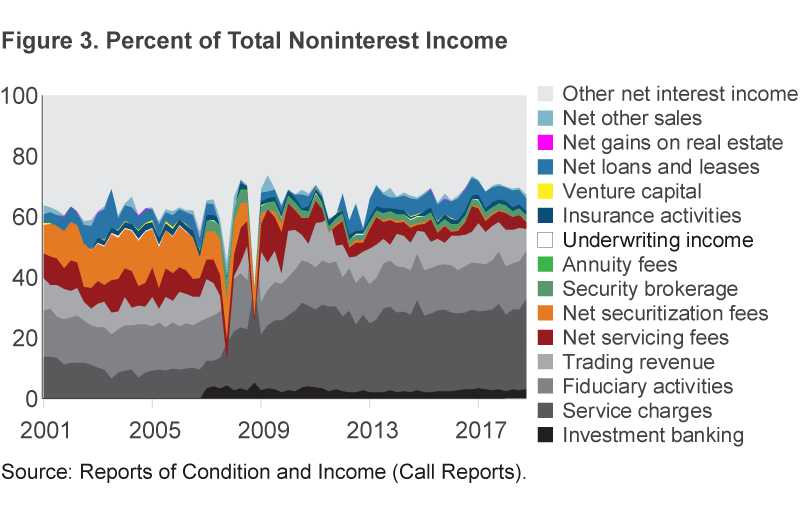
The broad categories of figure 1 can be further broken into components that are probably more familiar to most people (table 1). The shares of these components of noninterest income have also evolved over time, as can be seen in figure 3. While some components, such as fiduciary activities and trading activity, were relatively consistent through the crisis and postcrisis periods, others, like securitization fees, decreased drastically after the crisis as the amount of securitization dropped. Net loans and leases—the gain (or loss) from selling loans and leases, is a component that has again become important after having reached low levels in the crisis years. Perhaps the most striking development since the crisis is the growth in service charges, closely followed by the collapse in securitization fees. It is clear that banks now rely more heavily on service charges for their noninterest income than before the crisis.
| Category of noninterest income | Components |
|---|---|
| Service charges | Service charges, ATM fees, income from the sales of checks, safe deposit box fees, wire transfer fees, card charges |
| Trade | Trading revenue, net securitization income, net loans and leases sales, net real estate sales, net other sales |
| Investment banking | Income from fiduciary activities, venture capital income, securitization fees, annuity fees, insurance |
| Other | Other (food stamps, rent on property, foreign exchange profits) |
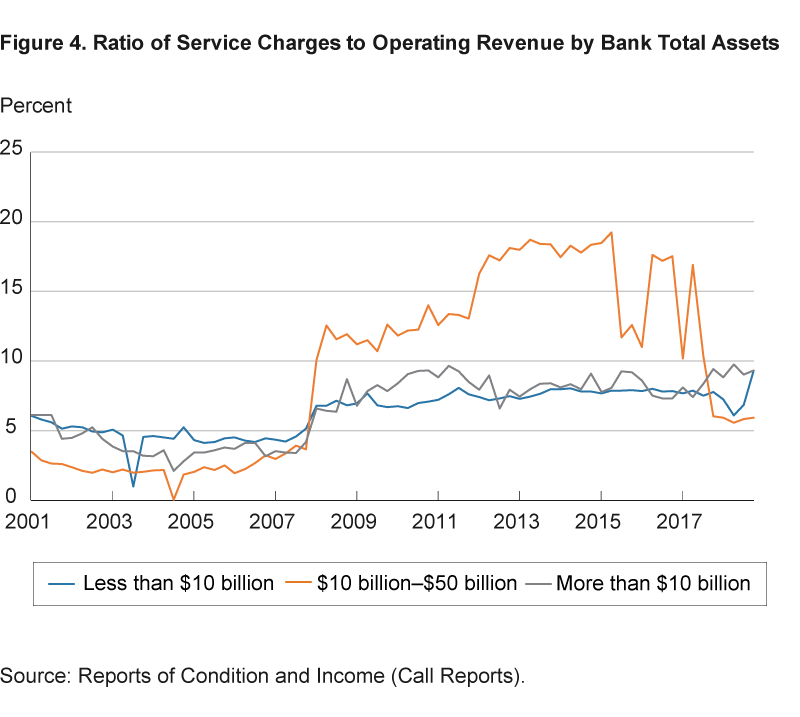
The postcrisis increase in service charges is not isolated to a few banks. Banks of all sizes saw a significant jump in service charges starting in 2008 (figure 4). When calculated as a percentage of operating revenue, service charges increased most for midsized banks. Perhaps surprisingly, the jump in service charges occurred despite rules announced in November 2009 that prohibited banks from charging fees for overdrafts at ATMs and one-time credit card charges unless the consumer had formally opted in.
Figures 1–4 strongly suggest that the 2008 recession led banks, particularly midsized banks, to adjust their reliance on noninterest income, reducing total noninterest income but increasing service charges. Given that the recession was accompanied by a steep fall in interest rates, the timing of the changes raises the question: are the changes a response to the low interest rate environment?
Impact of the Low Interest Rate Environment
The drop in noninterest income since the financial crisis flies in the face of a common narrative that low interest rates induce banks to put more focus on noninterest income. According to that narrative, the increase in noninterest income is an attempt to preserve revenue. When interest rates are low, banks earn less interest income on loans, so they turn to other sources of revenue, such as noninterest income. Substituting noninterest income for interest income could theoretically help banks in this situation in a few ways. Increased fees might be a way for banks to effectively pay negative interest on deposits when rates get very low. Alternatively, noninterest income could act as a “hedge” against interest income by generating fee and sales income independently of market interest rates. Having two income streams could provide diversification benefits for a bank if interest and noninterest income aren’t highly correlated. Because of the relatively fixed nature of fees compared to interest rates, it could also be that noninterest income is less variable than interest income.
But while this story doesn’t seem to hold true if we are looking at total noninterest income, it does seem to hold up better when we look at the components of noninterest income. Service charges have increased both absolutely and as a percentage of noninterest income since the recession (figures 2 and 3). But the rise in that component was offset by declines in other components, particularly securitization fees, which fell more, resulting in the fall in total noninterest income (figure 1). The components whose shares declined—securitization, trading, and real estate—depend on financial and housing markets that collapsed during the financial crisis, suggesting that if banks were looking to replace interest income with noninterest income when interest rates fell, they would need to look to other components. Service charges seems to have fit the bill.
Factors Influencing the Use of Noninterest Income
We can begin to get an idea of why banks changed their reliance on noninterest income and service charges by looking at the business reasons banks employ each of the different types of noninterest income. Identifying those reasons, however, is not straightforward. Just looking at aggregate numbers can’t tell us, because so many factors come into play. We can try to isolate the different causes, but that is difficult, too, because individual banks don’t report the reasons for their particular choices between interest and noninterest income.
One way we can get some clues is by looking for relationships between bank characteristics and observed shares of each type of revenue. To do this, we look at two sets of regressions. In the first, we regress each bank’s ratio of noninterest income to operating revenue against a variety of bank-specific variables, including net-interest margin, capital ratio, and asset size, and against some macro variables such as the term spread. In the second, we regress the bank’s ratio of service charges to operating revenue against the same set of bank-specific and macro variables. To account for the differences the financial crisis may have brought, we run the regressions separately for 2001-2007 and 2008-2018. We look at all commercial banks in the United States using data from the FFIEC Call Reports at the bank level, including both foreign and domestic branches. Table 2 reports the results.
| Regressions | ||||
|---|---|---|---|---|
|
|
2001:Q1–2007:Q4 | 2008:Q1–2018:Q2 | 2001:Q1–2007:Q4 | 2008:Q1–2018:Q2 |
| Variables | Ratio of to NII operating revenue | Ratio of NII to operating revenue | Ratio of service charges to operating revenue | Ratio of service charges to operating revenue |
| Net interest margin | 0.210** (0.103) |
−0.708* (0.393) |
−1.430*** (0.208) |
−1.356*** (0.0939) |
| Ratio of core deposits to total assets | −0.00447 (0.00351) |
−0.0118 (0.0524) |
0.00291 (0.00211) |
0.0396*** (0.00423) |
| Indicator. Contains 1 if Fed guidance in effect | 0 (0) |
−0.00432 (0.00629) |
0 (0) |
0.0113*** (0.000980) |
| Log of Tier 1 capital ratio | 0.0150 (0.00967) |
0.110* (0.0578) |
0.117*** (0.0117) |
0.0835** (0.0327) |
| Loan concentration index | −3.58e-06*** (4.93e-07) |
−9.87e-07 (1.08e-06) |
−4.50e-07 (3.03e-07) |
−5.96e-06*** (2.55e-07) |
| Return on equity | 0.171*** (0.0434) |
0.0609 (0.0474) |
−0.0107 (0.0195) |
0.0250 (0.0209) |
| Log of total assets | 0.0280*** (0.000653) |
0.0293*** (0.00459) |
0.00234*** (0.000579) |
0.00174*** (0.000607) |
| Indicator. Contains 1 if bank is in BHC | 0.00753*** (0.00144) |
0.0357*** (0.00816) |
0.00311** (0.00146) |
0.0109*** (0.00186) |
| Difference between 10-year and 3-month treasury yield | 0.102*** (0.0360) |
−0.520 (0.615) |
0.512*** (0.0276) |
0.423*** (0.0586) |
| S&P 500 index returns | −0.00186 (0.00692) |
−0.00472 (0.0361) |
−0.122*** (0.00578) |
0.00939** (0.00406) |
| Delinquencies over loan-loss reserves | −0.000914*** (0.000249) |
0.000107** (5.27e-05) |
−5.82e-06 (0.000262) |
−1.17e-05** (5.12e-06) |
| Loan-loss reserves over total assets | 2.293*** (0.271) |
−1.506** (0.720) |
−0.483** (0.191) |
−0.556*** (0.140) |
| Difference between AAA and BBB corporate yields | 0.820*** (0.131) |
0.520 (0.600) |
0.137 (0.0989) |
0.0328 (0.0676) |
| Constant | −0.172*** (0.00961) |
−0.196*** (0.0427) |
0.0678*** (0.0134) |
0.0845*** (0.0166) |
| R2 | 0.12 | 0.0008 | 0.08 | 0.04 |
| Observations | 129,207 | 194,906 | 129,207 | 194,906 |
Notes: Regressions were run on quarterly, bank-level data from 2000:Q1 to 2018:Q2 using Newey West standard errors with three lags to correct for autocorrelation and heteroskedasticity. Standard errors are in parentheses. Significance is indicated by the following: *** p<0.01; ** p<0.05; and * p<0.1.
Sources: Commercial bank data were obtained from Reports of Condition and Income (Call Reports). S&P500 returns and corporate yields were retrieved through Haver Analytics.
A few patterns stand out.
- The results for total noninterest income show that bank size, net interest margin, and the term spread are important factors in banks’ choices.
- Larger banks that are part of a bank holding company tend to have a higher proportion of noninterest income than smaller banks, and that holds true before and after the crisis.
- Banks with a higher net interest margin—those with a higher spread between the interest they charge on their loans and what they pay on deposits—tended to have more noninterest income before the crisis. After the crisis, however, these banks tended to have lower noninterest income.
The term spread, the difference between long- and short-term Treasury rates, has a positive effect before the crisis, meaning banks used more noninterest income when the term spread was high. This result is consistent with the net interest margin results in that banks profit from a steeper yield curve (long rates higher than short rates) because they borrow at short-term interest rates (taking in deposits) and lend at long horizons (car loans, mortgages, commercial loans, etc.). Thus, a high spread between what banks can make on loans and what they pay on deposits is correlated with higher use of noninterest income, as is a higher spread between short rates (usually related to deposit rates) and long rates (related to loan rates). This suggests that in a low interest rate environment, with low term spreads, banks would also use less noninterest income. The connection disappears after the crisis, however.
The results for service charges show some interesting differences relative to those for total noninterest income.
- First, while net interest margin again has an important effect both before and after the crisis, a higher net interest margin is associated with the bank using fewer service charges, both before and after the crisis. This lends further support that the interest-replacement theory is holding for service charges.
- Somewhat offsetting this support, however, is the impact of the term spread, which is positive for service charges both before and after the crisis. That is, banks use more service charges in times of high long rates and low short rates, which is often when you would also expect to see a high net interest margin and expect to see services charges used less.
- Loan-loss provisions have a negative effect in both periods.
- Finally, what was the impact of the rules requiring customers to opt-in to certain fees? It appears any impact was swamped by other factors. When we include an indicator variable for dates after the rule was implemented, we see a 1.1 percent increase in service charges, consistent with the growth we saw in figure 3.
Conclusion
The traditional view that banks make money by issuing loans and collecting interest is only part of a bigger story. Noninterest income has been, and remains, an important source of revenue for banks of all sizes. The financial crisis ushered in some changes to their reliance on this source of revenue, however.
Overall noninterest income as a share of bank revenue is lower than before the crisis, in part because of the collapse in securitization. After the crisis, though, banks with a low net interest margin tended to rely more on noninterest income. It thus appears plausible that they were making up for lost interest income due to the low-interest-rate environment ushered in by the financial crisis.
Furthermore, the data suggest that banks may also be relying more on noninterest income since the crisis, once we concentrate on service charges and exclude the parts of noninterest income most affected by the collapse of the financial markets, such as securitization, trading, and real estate. When we focus on these data, we see that banks increased their reliance on service charges when their net interest margins were low, both before and after the crisis.
How these trends of apparent interest replacement will play out if interest rates increase from historically low levels remains to be seen.
Footnotes
- The drop in noninterest income’s share is consistent with results from other studies that have looked at the issue. Stiroh (2004), found noninterest income both volatile and correlated with interest income, and. Calomiris and Nissim (2014) suggest that noninterest income has become less valuable to banks since the financial crisis, in part because of its variability. Laeven and Levine (2007) find that banks which engaged in a diversity of activities had lower stock prices, which supports the diseconomies of scope argument in Mester (1992). However, these papers’ focus on total noninterest income may be misleading, as some components directly affected by the crisis, such as securitization, saw a large drop while others such as service charges did increase in the low interest rate environment. In our sample, noninterest income is also more variable than interest income. At the aggregate level, the ratio of noninterest income in total assets has a standard deviation of 0.1, while the standard deviation of interest income to total assets is less, 0.06 (over the years of 2000 to 2018), and this holds true for banks of different size classes as well. During the same time frame, the correlation between interest and noninterest income is 0.84, and the correlation between interest income and service charges is 0.74. In a portfolio setting, these correlations would not indicate much diversification benefit. Return
- The information in the charts come from Call Reports, forms banks use to disclose this information. Call Reports define service charges as income generated by maintenance fees, overdraft fees, and inactive account fees. This category made up approximately 8.6 percent of noninterest income in 2018:Q1. However, the “other” category in the Call Report contains items that consumers would most likely consider as service charges, such as fees from sales of checks, safe deposit box fees, and ATM fees, components we believe are in the same spirit as service charges, so we include these in our definition of service charges. After subtracting these components from “other” and adding them to service charges, this category’s share of noninterest income rises from 8.6 percent to 25.3 percent in 2018:Q1. Return
References
- Calomiris, Charles W., and Doron Nissin. 2014. “Crisis-Related Shifts in the Market Valuation of Banking Activities.” Journal of Financial Intermediation, 23: 400–435.
- DeYoung, Robert, and Gokhan Torna. 2013. “Nontraditional Banking Activities and Bank Failures during the Financial Crisis.” Journal of Financial Intermediation, 22: 397–421,
- DeYoung, Robert, and Tara Rice. 2004a. “How Do Banks Make Money? A Variety of Business Strategies.” Federal Reserve Bank of Chicago, Economic Perspectives, Q4: 52–67.
- DeYoung, Robert, and Tara Rice. 2004b. “How Do Banks Make Money? The Fallacies of Fee Income.” Federal Reserve Bank of Chicago, Economic Perspectives, Q4: 34–51.
- Board of Governors of the Federal Reserve System. 2009. “Federal Reserve Announces Final Rules Prohibiting Institutions from Charging Fees for Overdrafts on ATM and One-Time Debit Card Transactions.” Press release, (November 12).
- Feldman, Ron J., and Jason Schmidt. 1999. “Noninterest Income: A Potential for Profits, Risk Reduction and Some Exaggerated Claims.” Federal Reserve Bank of Minneapolis, Fedgazette (October).
- Laeven Luc, and Ross Levine. 2007. “Is There a Diversification Discount in Financial Conglomerates?” Journal of Financial Economics, 81: 331–367.
- Mester, Loretta J. 1992. “Traditional and Nontraditional Banking: An Information-Theoretic Approach.” Journal of Banking and Finance, 16: 545–566.
- Stiroh, Kevin J. 2004 “Diversification in Banking: Is Noninterest Income the Answer?” Journal of Money, Credit, and Banking, 36: 853–882.
The views authors express in Economic Commentary are theirs and not necessarily those of the Federal Reserve Bank of Cleveland or the Board of Governors of the Federal Reserve System. The series editor is Tasia Hane. This work is licensed under a Creative Commons Attribution-NonCommercial 4.0 International License. This paper and its data are subject to revision; please visit clevelandfed.org for updates.
Suggested Citation
Haubrich, Joseph G., and Tristan Young. 2019. “Trends in the Noninterest Income of Banks.” Federal Reserve Bank of Cleveland, Economic Commentary 2019-14. https://doi.org/10.26509/frbc-ec-201914
This work by Federal Reserve Bank of Cleveland is licensed under Creative Commons Attribution-NonCommercial 4.0 International


- Share