

Why Are Interest Rates So Low?
Interest rates have been at historical lows for some time now. There are many possible reasons why that is so. We make use of recent work done at the Federal Reserve Bank of Cleveland that allows us to look at individual components of interest rates and see which are exerting the biggest influence. Knowing why rates are where they are now helps to predict where interest rates will likely be in the near future.
As anyone following the financial news, refinancing a mortgage, or even checking their savings account knows, interest rates remain at historically low levels. But interest rates can be, and have been, much higher. Rates on the three-month Treasury bill hit nearly 15 percent in early 1982, when Olivia Newton John topped the charts with “Physical” and Ozzie Osbourne gained notoriety for biting the head off a bat. Now, while you were uploading your video of the “Harlem Shake,” and Kelly is the Osbourne most in the public eye, rates are down below one-tenth of one percent, a rate that, prior to the crisis, hadn’t been seen since Glenn Miller topped the charts with “Chattanooga Choo Choo.”
What is keeping interest rates so low? The question can be answered on many levels, and though some people are quick to assign credit (or blame) to the Federal Reserve, China, or the current administration, more practical answers follow from eschewing the politics and looking at the question from an investment standpoint.
In this Economic Commentary we take that approach, making use of recent work done here at the Federal Reserve Bank of Cleveland, which breaks interest rates apart into the various factors that determine what those rates will be. Looking at these components allows us to see which are exerting the biggest effects and helps to predict where interest rates will likely be in the near future.
Breaking Up Is Hard to Do
A variety of components contribute to the level of interest rates, and looking at each one separately will give us a good idea of the factors behind low rates.
One of the largest contributors to the level of interest rates is credit risk. This reflects the difference between risky and riskless debt—between debt that might not be paid back and debt that almost certainly will be repaid. Lenders demand a higher interest rate for taking on credit risk, something the financial trade calls a risk premium. Many of the interest rates consumers normally deal with have this sort of risk—rates on credit cards, mortgages, and auto loans. We won’t talk much about credit risk in this Commentary, because nailing down riskless debt will tell us a lot about what is driving interest rates.
Since the credit risk premium is on top of the interest rate charged for riskless debt, the first step is to understand what moves that riskless rate around. We will concentrate on U.S. Treasury securities, taking them as riskless, which still seems a safe assumption, though perhaps not as blatantly obvious as in the days before the fiscal cliff and the downgrade by Standard & Poor’s.
The next big contributor to rates is inflation. This reflects the difference between real and nominal interest rates. With ordinary Treasury bonds, people lend money to the U.S. government, but when they get their money back (with interest), each dollar they receive is worth less because of inflation. Thus, adjusting for inflation, the real rate of interest they receive is less than the nominal, or dollar, rate of interest.
This means that the nominal interest rate can be separated into the real rate plus the expected inflation rate. In other words, if investors hope to get a real return of 3 percent on what they lend, and they expect inflation to be 2 percent, they charge 5 percent interest. That’s why times of high interest rates often correspond to times of high inflation.
The separability of the nominal rate into the real rate and expected inflation also suggests a quick way to gauge market expectations of inflation: look at the difference between nominal and real treasury bonds. The U.S. government issues both kinds, so looking at the difference between the interest rate on nominal treasury bonds and TIPS (Treasury Inflation Protected Securities), which are protected against inflation and thus offer a real rate of return, provides an estimate of expected inflation, at least among the bond-buying public.
This difference in rates is often called the breakeven inflation rate, because at that rate you would break even between holding TIPS or holding nominal bonds. Higher inflation would make TIPS a better deal, and lower inflation would mean nominal bonds had the higher payoff.
There’s a problem with this approach to uncovering inflation expectations, however. Future inflation is uncertain, and people don’t like the risk associated with being wrong about it. If investors buy a nominal bond, they bear inflation risk—with TIPS, being protected against inflation, they don’t. To compensate for this risk, nominal bonds have an extra component besides the real rate and expected inflation. In other words, the interest rate on the nominal bond is the real rate, plus the expected inflation rate, plus a risk premium for unexpected inflation.
This risk premium has several consequences for measuring expected inflation. First, the TIPS breakeven measure is not quite right. In general, it overstates inflation expectations because it includes the risk premium. Furthermore, it is unclear what it means if the breakeven inflation rate increases. Is it because people confidently expect higher inflation, or because they are more worried about how variable prices will be? Another problem with the breakeven rate is that because it is the difference between two different bonds, differences in those bonds can distort the measured expected inflation rate, be they tax differences or changes in liquidity. Indeed, in the financial crisis, a shift to the safest assets (flight to quality) created a strong demand for the more liquid nominal treasury bonds, driving their yield down and making the breakeven rate unnaturally low.
There are ways around these problems, but they lack the simplicity of the breakeven rate. For example, one measure of expected inflation can come from a derivative known as an inflation swap, which avoids the problem of two different bonds, but it still does not correct for the inflation risk premium. That correction requires making more assumptions about what form the risk takes and how much people dislike the risk. In other words, it takes an economic model. One approach taken at the Cleveland Fed to such modeling (previously described here and here) combines data on interest rates from nominal treasury securities, inflation swaps, and survey measures of inflation.
As might be imagined, this approach is fairly complicated to implement, but in contrast to Avril Lavigne’s 2007 lament, there are some benefits from being “complicated.” The first is that, by using a model, you get a better, purer measure of inflation expectations, along with a measure of the inflation risk premium. Secondly, drawing information from multiple sources captures aspects of the problem single sources would miss. And finally, using a model enforces and exploits a form of consistency: the inflation that consumers observe ought to be similar to what investors observe, and traders should arbitrage away any big differences between the inflation expectations built into nominal Treasury debt and other instruments, such as inflation swaps.
Eight Miles High and Falling Fast
The Cleveland model of inflation expectations gives estimates for a number of interest rate components: expected inflation, the real interest rate, the inflation risk premium, and the term premium on real rates (explained below). A look at these components over the past five years does provide some insight into why interest rates are so low right now (figure 1).
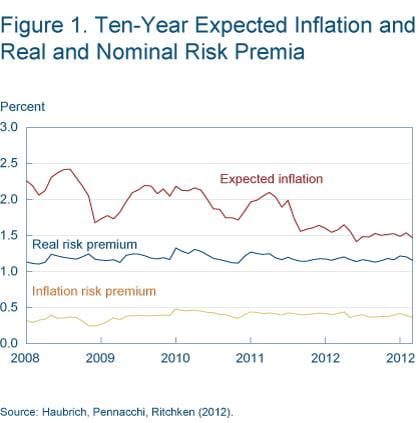
Source: Haubrich, Pennacchi, Ritchken (2012).
One reason for lower interest rates is that expected inflation has fallen. Since the middle of 2010, inflation expectations have moved downward, by about half a percentage point. In fact as late as May of 2011, expectations of inflation over the next ten years were over 2 percent. Now, by having dropped a bit in the past few months, they are a bit below 1.5 percent.
The low expected inflation provides a perspective on the impact of recent monetary policy. A common concern about the various quantitative easing programs of the Federal Reserve (officially termed LSAP, for Large-Scale Asset Purchases, and MEP, Maturity Extension Program, but better known as QE1, 2, and 3, and Operation Twist) is that expanding the Fed’s balance sheet will increase the money supply, leading to excessive inflation. The financial market apparently does not share this concern: expectations not only have fallen, but remain at low absolute rates.
A second reason interest rates are low is that the real interest rate has seen even larger decreases than expected inflation. In fact, a lower real rate accounts for the bulk of the decrease in nominal interest rates (according to the Cleveland Fed model). As figure 2 shows, in March of 2011 the real rate was at 1 percent, and having gone negative for a while is now barely above zero. Note that this estimate is what the model predicts real rates should be, so it does not match up exactly with the real rates seen in the TIPS market, where rates are solidly negative. Put another way, investors are looking at bonds that will pay $1,000 (protected for inflation) in ten years and paying more than $1,000 dollars for them.
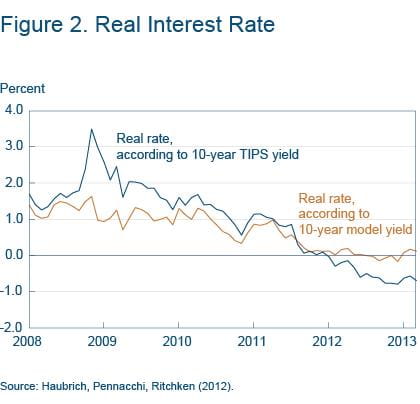
Source: Haubrich, Pennacchi, Ritchken (2012).
Figure 1 also shows that the risk premium for inflation has remained fairly steady over the past five years, and, if anything, is currently on the low side of its range. A quick troll through the blogosphere will uncover people obsessed with deflation and others expecting a return to the hyperinflation of the Weimar Republic. Such uncertainty should manifest itself in a high risk premium if it is shared by investors. Clearly, it is not. The low premium also means that we can’t attribute the decline in interest rates to people becoming less worried about inflation extremes.
The inflation risk premium, though fairly steady, is large enough to make a difference, however—ignoring it means the breakeven rate overstates expected inflation by about one-half of one percent. Back in the early 1980s that wouldn’t have made much of a difference, but now, with the Federal Open Market Committee setting an inflation objective of 2 percent, half a percent makes a difference!
Bills, Bills, Bills
Another way of breaking up interest rates into components is to make use of the relationship between interest rates on short- and long-term bonds. There should be a connection, because investors have the choice of buying a two-year bond, or buying a one-year bond and rolling that over into another one-year bond. Arbitrage should keep those interest rates close. Economists call this the expectations hypothesis, that long rates should be the average of expected future short rates. Of course, it doesn’t always work out this way, and the difference is called the term premium, which again arises because of risk and uncertainty—we don’t know for sure what rates will be in the future.
This line of thinking tells us that current interest rates could be low because future short-term rates are expected to be low or because the term premium is low. The tricky part is that we don’t directly observe expectations of short-term rates—so once again we need a model to extract the term premium. The Cleveland model separately produces two parts of the term-risk premium, one due to inflation uncertainty and one due to real rate uncertainty, which can then be combined (that is, added together) for the overall term premium.
Figure 3 shows the two components of the term premium (repeated from figure 1) and their sum, the total term premium. Though the total varies a bit, there is not a dramatic falling off since 2008. So again, it looks like the dominant changes in interest rates will be expectations of nominal rates (themselves combining real rates and inflation) rather than in the term premium.
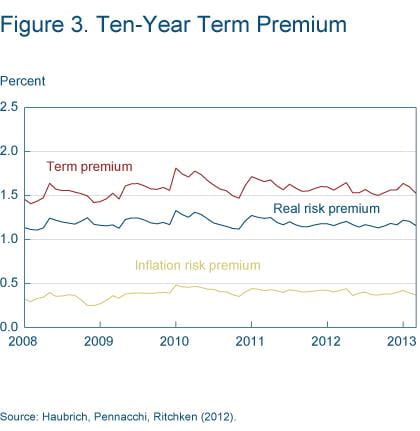
Source: Haubrich, Pennacchi, Ritchken (2012).
Blowin’ in the Wind
Being able to split interest rates into components gives us useful information about what is affecting interest rates. It can help us judge whether rates are likely to deviate significantly from their recent trend. Of course, it won’t tell us everything. It won’t answer more basic questions about what determines real rates, what determines inflation, or what determines the risk premium. But answering those deeper questions also demands a clear view of the facts, and understanding the underlying components of interest rates advances that goal. Understanding how inflation expectations, real rates, and risk contribute to interest rates can be a crucial aid in making decisions, be they individuals looking to buy a house or move for a job, or a central bank deciding on monetary policy.
Recommended Reading
- “Inflation Expectations, Real Rates, and Risk Premia: Evidence from Inflation Swaps,” Joseph G. Haubrich, George Pennachi, and Peter Ritchken, 2012. Review of Financial Studies, vol. 25, no. 5, pp. 1588–1629.
- “The Future of Inflation,” Joseph G. Haubrich, 2011. Federal Reserve Bank of Cleveland, Economic Commentary.
- “Inflation: Noise, Risk, and Expectations,” Joseph G. Haubrich and Timothy Bianco, 2010. Federal Reserve Bank of Cleveland, Economic Commentary.
- For a related but different view from Chairman Ben S. Bernanke, see “Long-Term Interest Rates,” March 1, 2013, Annual Monetary/Macroeconomics Conference: The Past and Future of Monetary Policy, sponsored by Federal Reserve Bank of San Francisco, San Francisco, California.
The views authors express in Economic Commentary are theirs and not necessarily those of the Federal Reserve Bank of Cleveland or the Board of Governors of the Federal Reserve System. The series editor is Tasia Hane. This work is licensed under a Creative Commons Attribution-NonCommercial 4.0 International License. This paper and its data are subject to revision; please visit clevelandfed.org for updates.
Suggested Citation
Haubrich, Joseph G. 2013. “Why Are Interest Rates So Low?” Federal Reserve Bank of Cleveland, Economic Commentary 2013-04. https://doi.org/10.26509/frbc-ec-201304
This work by Federal Reserve Bank of Cleveland is licensed under Creative Commons Attribution-NonCommercial 4.0 International


- Share