

CRA Lending in the 4th District
The Community Reinvestment Act (CRA) has come under scrutiny as one of the suspected contributors to the current financial crisis.
Introduction
The Community Reinvestment Act (CRA) has come under scrutiny as one of the suspected contributors to the current financial crisis. Enacted in 1977 to address the lack of access to credit in low- and moderate-income communities, the CRA encourages regulated financial institutions to meet credit needs in the communities they serve, consistent with safe and sound lending practices. Critics of the CRA suggest that banks were forced by the legislation's requirements to lower lending standards and provide loans to low- and moderate-income individuals regardless of their creditworthiness. This, in turn, pushed non-CRA-regulated banks to adopt similarly lax underwriting standards and apply them to all borrowers in the market.1 Such criticisms have prompted many to take a closer look at this landmark legislation.
A conference in February 2009 at the Federal Reserve Bank of Cleveland convened banking, regulatory, and community development experts to discuss two things: whether the CRA contributed to the current financial crisis, and what changes might be necessary to the CRA going forward. An analysis of CRA-related lending at the national level prompted us to examine what is happening specifically in the Fourth Federal Reserve District - which encompasses Ohio and parts of Kentucky, Pennsylvania, and West Virginia - so that we can contribute to the local CRA discussion.2 The findings from this analysis were shared at the February forum, along with the national data from the Federal Reserve Board of Governors.
Examining what happened in the Fourth District is important because the national perspective on this crisis does not tell our story. Unlike the stronger markets, such as Florida and California, our region did not experience a huge run-up in housing prices, had only minimal gains in or declining population, and saw stagnant or decreasing employment. Solutions developed to address the current challenges in both the mortgage and housing markets must take into account these market differences, because what works in a stronger region may not work here.
Our examination of CRA lending in the Fourth District found that, similar to findings at the national level, CRA-regulated institutions provided a relatively small share of all loans within the district and an even smaller percentage of the riskier high-cost loans. But we also found some intriguing differences. When we narrowed our focus to particular counties in our district, we saw that the extent of high-cost lending by independent mortgage companies was much greater in the two Ohio counties we examined than in Pennsylvania's Allegheny County.
Data and definitions
This analysis uses the 2006 Home Mortgage Disclosure Act (HMDA) data, which includes information on mortgage lending and borrower characteristics. The 2006 data represent the last full year of HMDA data prior to the turmoil in the mortgage markets. We focus the analysis on first-lien home purchases and refinances for 1-4 family units. Specific to this analysis, the HMDA data provides information on whether the loan was made within a bank's CRA assessment area or outside the assessment area. In addition, the data tell us whether a loan was made by a depository institution, an affiliate or subsidiary of a depository, or an independent mortgage company.
Under the CRA, insured depository institutions are evaluated on the lending they do in low- and moderate-income (LMI) neighborhoods and to low- and moderate-income borrowers within the banks' assessment areas. This evaluation is known as the lending test and accounts for 50 percent of a large bank's performance rating.3 Low- and moderate-income areas are defined as census tracts where the median income of the tract is less than 80 percent of the MSA's median income. Low- and moderate-income borrowers are defined as borrowers whose income is less than 80 percent of the Metropolitan Statistical Area's (MSA) median income. Assessment areas, which are defined by the banks themselves, must include geographies where the banks have main offices and branches and generally must consist of one or more contiguous MSAs.
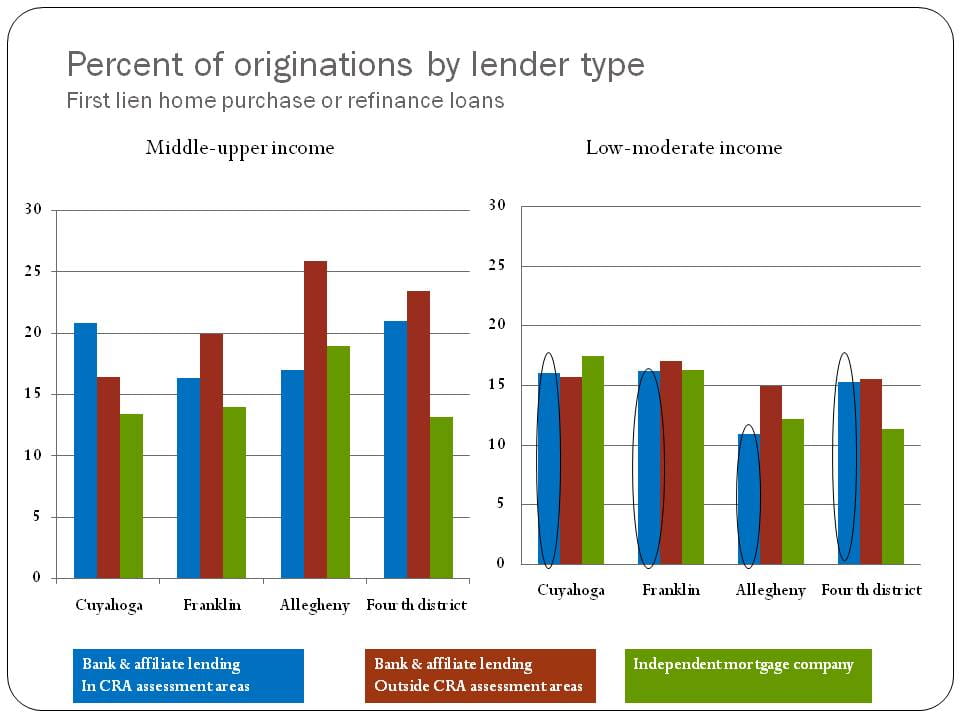
Chart 1.
Percent of originations by lender type
What we found in the 4th District
We focus our analysis on three of the most populous counties in our district: Cuyahoga County, Ohio, which is home to Cleveland; Franklin County, Ohio, home to Columbus; and Allegheny County, Pennsylvania, home to Pittsburgh. The majority of home purchase and refinance loans are provided by depository institutions and their affiliates or subsidiaries. In all three counties, this figure reaches nearly 70 percent, and it reaches 75 percent in the Fourth District overall. Independent mortgage companies provided about 30 percent of all loans, a share that was consistent across all three counties we examined. In the Fourth District, independent mortgage companies originated about 25 percent of all loans. When we look at who is obtaining these loans, the data show that in both Cuyahoga and Franklin counties nearly 50 percent of the borrowers either live in LMI tracts or have LMI incomes. In Allegheny County, we found that 38 percent of the loans were made in LMI areas or to LMI borrowers. In the Fourth District, 42 percent of the loans were made in LMI areas or to LMI borrowers, compared with 34 percent nationally.4
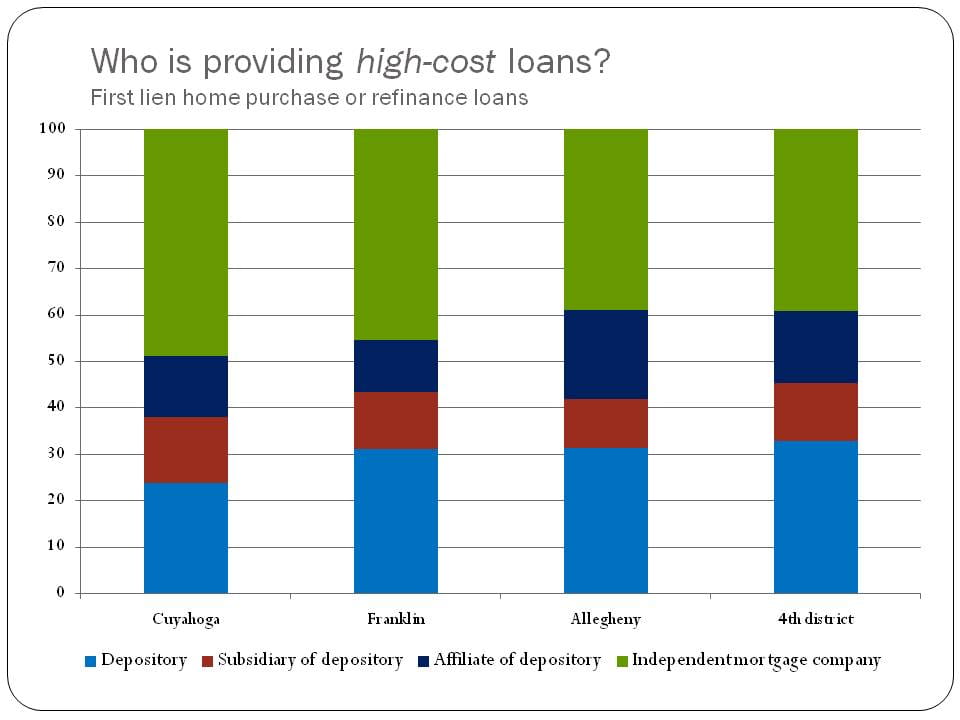
Chart 2.
Who is providing high-cost loans?
So, who is lending to whom in the Fourth District communities? Chart 1 illustrates loans made by lender type and income group. Loans made to middle- and upper-income borrowers and areas are wholly unrelated to CRA evaluations and are not the focus of this analysis. Loans made to LMI borrowers or areas, on the other hand, could be covered by the CRA, and thus are the focus of our analysis. The circled bars in the chart show the percentage of loans that are CRA-related: in other words, these loans were made by banks and affiliates5 within their assessment areas and were made to LMI borrowers or within LMI areas. As the chart indicates, about 16 percent of the home purchase and refinance loans made in Cuyahoga, Franklin, and the Fourth District are CRA-related. In Allegheny County, we see that a smaller percentage (11%) of the lending was CRA-related and that more of the LMI lending was done by banks and affiliates outside their assessment areas.
Next, we narrow the focus from looking at all loan originations to just high-cost loans.6 Why are these particular loans of such great interest? Research has found that high-cost or subprime loans go into default at a higher rate than prime loans.7 As Chart 2 shows, nearly half of the high-cost loans in both Cuyahoga and Franklin counties were made by independent mortgage companies (IMCs), which are not federally regulated institutions. In Allegheny County and the Fourth District, IMCs originated about 40 percent of the high-cost loans. In contrast, insured depository institutions provided just over 20 percent of the high-cost loans in Cuyahoga County and over 30 percent in Franklin, Allegheny, and the Fourth District.
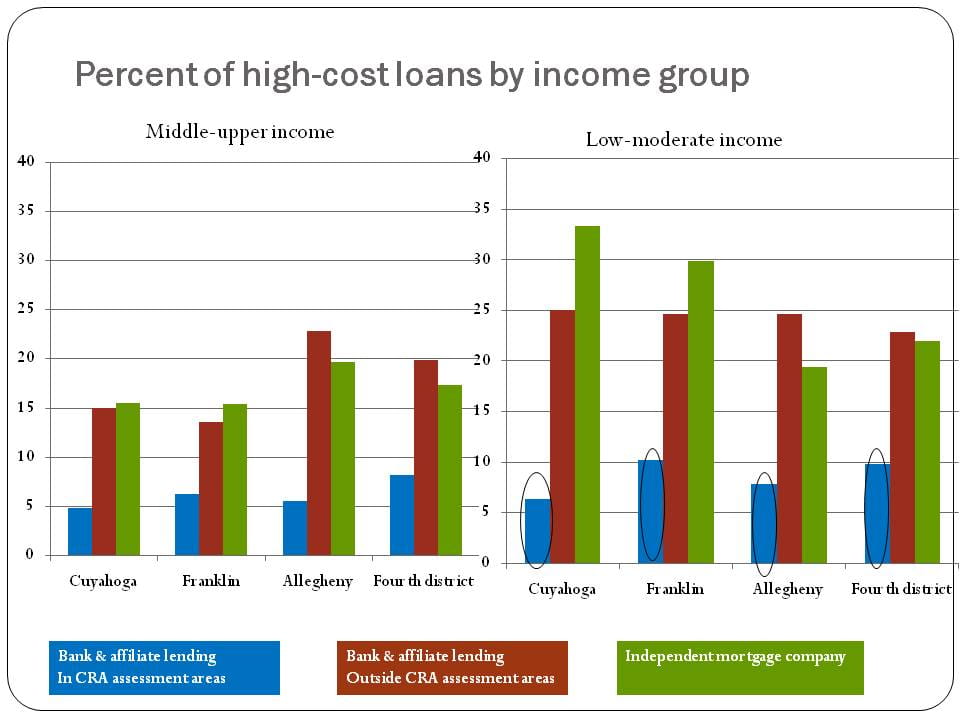
Chart 3.
Percent of high-cost loans by income group
Who is receiving high-cost loans in the Fourth District? Mostly, it is borrowers who have low or moderate incomes or who live in LMI communities. Two-thirds (65%) of the high-cost originations in Cuyahoga County were made to LMI borrowers or in LMI areas, compared to 55 percent in both Franklin County and the Fourth District and 52 percent in Allegheny County. Nationally, this figure was 44 percent. The large percentage of high-cost loans to LMI borrowers may not be surprising, given that higher-priced loans are provided to those who pose a greater credit risk. What is surprising are the notable differences across the counties.
In Chart 3, the distribution of high-cost loans is broken down by lender type and income group. What immediately stands out is the large percentage of high-cost loans being originated by independent mortgage companies in LMI areas and to LMI borrowers, particularly in Cuyahoga County. More than 33 percent of all high-cost loans in Cuyahoga County are originated by IMCs and to LMI borrowers or areas. What is also evident from the analysis is the small percentage of high-cost loans being originated by CRA-regulated banks in LMI areas or to LMI borrowers in their assessment areas. This is true across the three counties and in the Fourth District. (See circled bars in Chart 3.) Even in the middle- and upper-income areas, CRA-regulated institutions are doing very little high-cost lending. Interestingly, in both Allegheny County and in the Fourth District, a larger share of the high-cost lending is done by banks and affiliates outside their assessment areas compared to Cuyahoga and Franklin Counties, where IMCs are more dominant.
Chart 4.
High-cost lending to low-moderate income borrowers
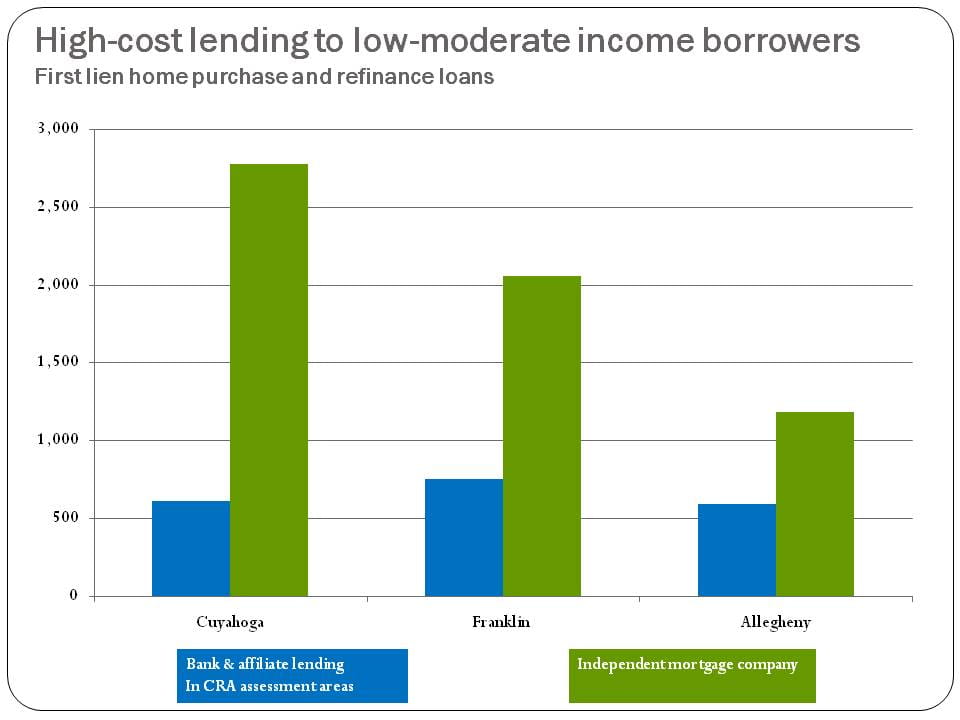
To take this analysis one step further, we focus on high-cost lending to LMI borrowers only. In the preceding steps of this analysis, our LMI category included both LMI borrowers and borrowers living in LMI communities (regardless of income). In this next examination of the data, we exclude from the analysis loans made to middle- and upper-income borrowers who are living in LMI communities. What this does is sharpen our focus to only LMI borrowers, as these borrowers are most at risk for default or delinquency. What stands out is the volume of lending by independent mortgage companies to the lowest-income borrowers (see Chart 4). In Cuyahoga County, IMCs originated five times as many high-cost loans to LMI borrowers as did the CRA-regulated banks, and in Franklin County, three times as many. In contrast, in Allegheny County IMCs originated just twice as many high-cost loans as CRA-regulated institutions. Exploring how and why IMCs dominated high-cost lending in these Ohio counties to the extent that they did could well yield some interesting and revealing findings.
Spatial distribution of high-cost lending
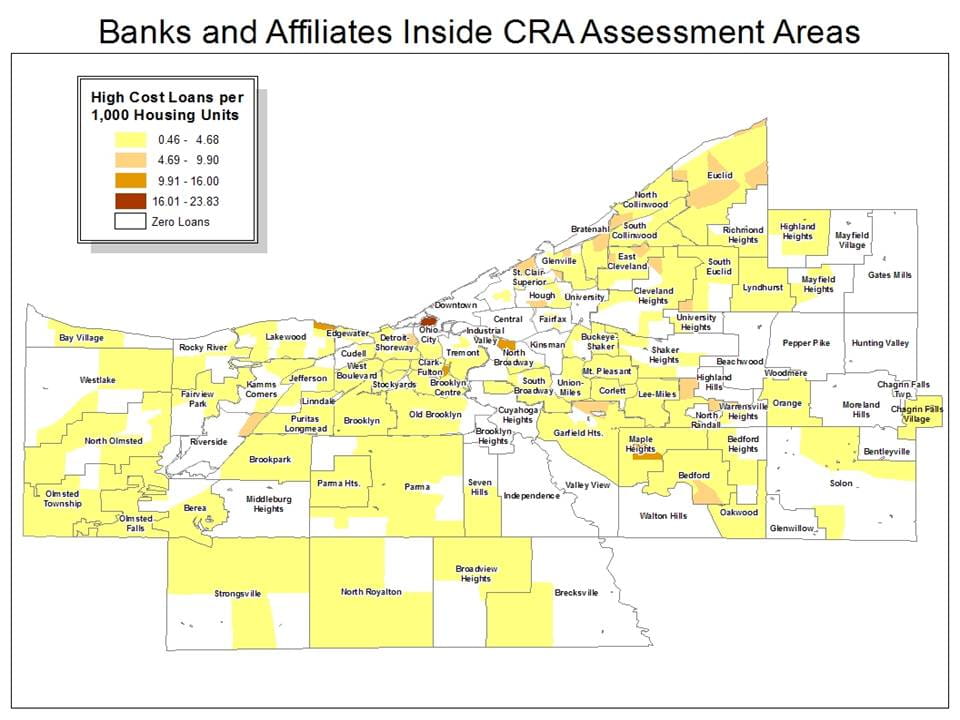
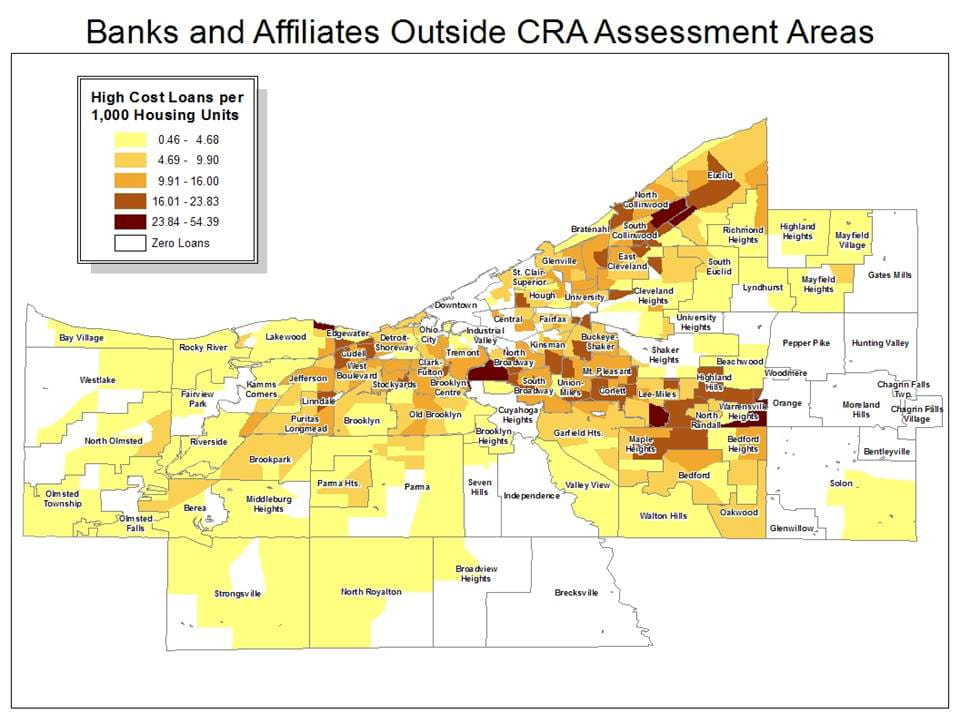
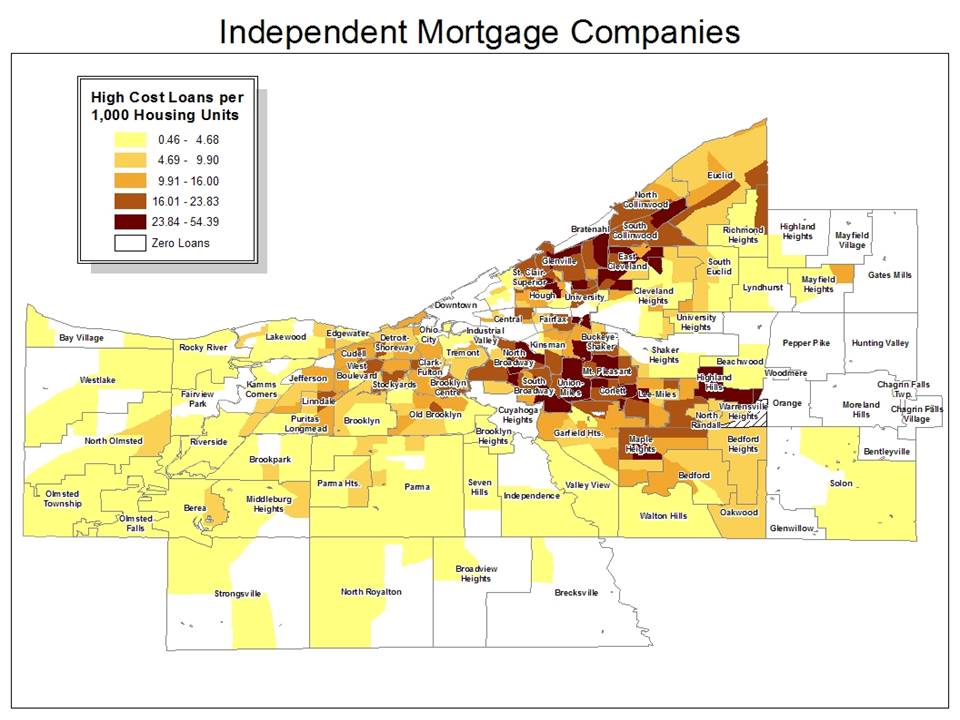
Finally, we illustrate the spatial distribution of high-cost lending in Cuyahoga County, labeled by some as the epicenter of the foreclosure crisis. Collectively the maps show rates of high-cost lending per 1,000 housing units. Map 1 shows high-cost lending by CRA-regulated banks and affiliates within their assessment areas, which is widely distributed across the county. In fact, this map shows very few areas with high rates. Map 2 illustrates high-cost lending rates by banks and affiliates outside their assessment areas. Here we see some areas with higher rates of high-cost lending, which appear to be more concentrated in certain areas within the county. The last map shows high-cost lending by IMCs. Map 3 shows more areas with the highest rates of high-cost lending (shown in the dark red) than the previous two maps. Also, the highest-rate areas appear to be surrounded by other high-rate areas. What this means is that IMC lending appears to be much more concentrated than lending by other types of lender.
Map 1.
Banks and Affiliates Inside CRA Assessment Areas
Map 2.
Banks and Affiliates Outside CRA Assessment Areas
Map 3.
Independent Mortgage Companies
What's next?
What have we learned from this analysis, and how might this knowledge be applied? As the data show, CRA-regulated institutions provided only a small percentage of the high-cost loans in our district, a finding that is consistent across all income groups. Independent mortgage companies, in contrast, provided a large share of the high-cost lending specifically to LMI areas and borrowers. This was particularly evident in Cuyahoga and Franklin counties. Given the nation's current financial crisis, there is considerable discussion underway about regulatory reform, including CRA reform. A recently issued publication by the Federal Reserve Banks of Boston and San Francisco contains essays espousing a range of views from leading experts on the topic of the future of the CRA. Some argue that the CRA should expand its authority to include lending by IMCs and by banks and their affiliates outside of their assessment area. Some go further and suggest the CRA should apply to all consumer financial products and their providers. Most agree that the legislation is in need of revisions and updating to better accommodate significant changes in the financial services landscape since 1977. The Federal Reserve Bank of Cleveland, along with all the Federal Reserve Banks and the Board of Governors, will continue to provide data analysis and research, as well as hold forums conducive to shaping a future policy framework for this legislation.
Footnotes
- Wallison, Peter J. "Cause and Effect: Government Policies and the Financial Crisis." American Enterprise Institute for Public Policy Research Financial Services Outlook, November 2008, available at http://www.aei.org/publication/cause-and-effect-2/.
- Randall Kroszner (2009). "The Community Reinvestment Act and the Recent Mortgage Crisis," Revisiting CRA: Perspectives on the Future of the Community Reinvestment Act, pp 8-11.
- In addition to the lending test, a large bank's performance is also rated on the investment test (25%) and the service test (25%). For information regarding CRA examinations, see http://www.federalreserve.gov/newsevents/testimony/braunstein20080213a.htm
- Analysis prepared by Neil Bhutta and Glenn Canner at the Board of Governors of the Federal Reserve System. Available at http://www.federalreserve.gov/newsevents/speech/20081203_analysis.pdf
- It is up to the depository institution to decide whether to include its affiliate lending as part of its CRA evaluation.
- High-cost loans are defined as loans whose rates exceed by at least 3 percentage points the difference between the APR on a loan and the rate on Treasury securities of comparable maturity.
- Kristopher S. Gerardi and Paul S. Wllen (2008). "Subprime Mortgages, Foreclosures and Urban Neighborhoods." Federal Reserve Bank of Boston Public Policy Discussion Paper No. 08-6.
The views expressed in this report are those of the author(s) and are not necessarily those of the Federal Reserve Bank of Cleveland or the Board of Governors of the Federal Reserve System.
- Share