

Subprime Loan Report for Cleveland and the Fourth District
This report compares data on the performance of subprime home mortgage loans in the Cleveland metropolitan area and the Fourth Federal Reserve District. Overall, the performance of subprime loans in Cleveland has been weaker than in other parts of the Fourth District.
This report compares data on the performance of subprime1 home mortgage loans in the Cleveland metropolitan area and the Fourth Federal Reserve District.2 Overall, the performance of subprime loans in Cleveland has been weaker than in other parts of the Fourth District.
The following six findings characterize the subprime market for Cleveland:
- Subprime loans represent a small share of home mortgage loans but make up a disproportionate share of non-current loans [those that are past due, in bankruptcy, in foreclosure, or real-estate owned (REO)].
- The percentage of subprime loan originations peaked in 2005 before falling sharply in 2006.
- The percentage of subprime loans reported as being used for investment increased between 2000 and 2007.
- Subprime loans originated after 2005 are deteriorating at a faster rate compared with previous vintages throughout the district. Adjustable-rate mortgages (ARMs) have fared considerably worse than their fixed-rate counterparts.
- The percentage of subprime loans that were current fell from 2001 to 2007.
- Unlike in the nation as a whole, the loan deterioration problem in the Cleveland metro area is not a consequence of a reversal of rapid home-price appreciation.
In addition, when compared to Ohio and the Fourth District states overall (Ohio, Pennsylvania, Kentucky, and West Virginia), Cleveland was struck harder by the decline of the subprime market. In Cleveland,
- a larger share of loans were subprime,
- a larger share of loans were non-performing in the subprime market,
- a larger share of loans were reported as being for investment properties, and
- subprime loans of vintages 2005 through 2007 defaulted at higher rates over time.
While subprime loans represent a small share of home mortgage loans throughout Fourth District states, they comprise a disproportionate share of non-current loans.
Nationally, at the end of March 2008 roughly 2.5 percent of all outstanding home mortgage loans were in the foreclosure process and nearly 6.4 percent were at least one month past due.3 While subprime loans account for only 12 percent of the home mortgage loan market, fully half of all U.S. foreclosure starts were from subprime loans.
Here in the Fourth District states, subprime mortgage loans represented less than 13 percent of the home mortgage loans in the First American Loan Performance (LP) dataset,4 which is consistent with national averages. However, subprime loans accounted for more than half of all loans at least 90 days past due, 58 percent of loans in foreclosure, and nearly two-thirds of loans in REO status (see Figure 1).5
Figure 1. Subprime Loan Performance as of March of 2008
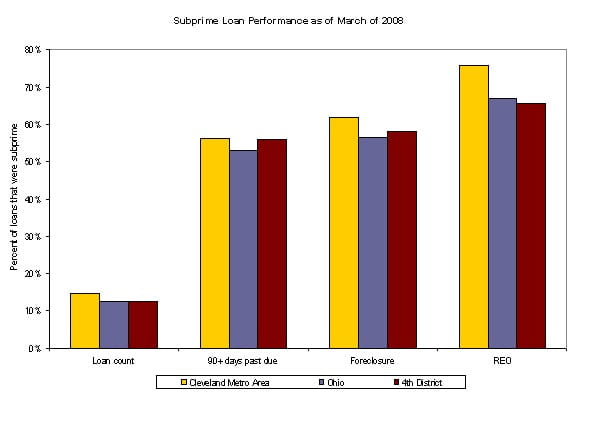
The Cleveland metro area had a slightly higher share of subprime loans (15 percent) compared with the Fourth District states. More than 56 percent of loans at least 90 days past due were subprime, nearly 62 percent of loans in foreclosure were subprime, and more than three-fourths of loans in REO status were subprime (see Figure 1).
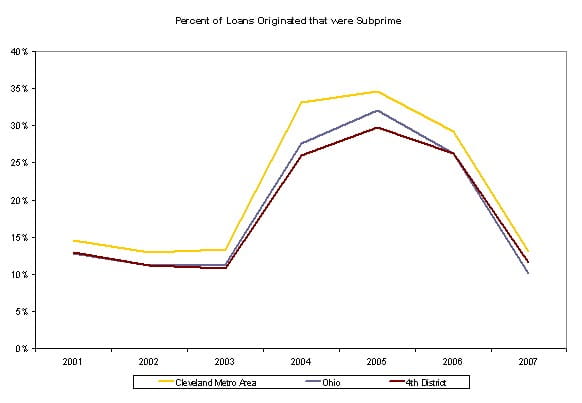
The percentage of subprime loan originations in the Fourth District states peaked in 2005 before falling sharply in 2006.
As illustrated in Figure 2, between 2001 and 2003 the number of subprime loan originations in Cleveland increased by nearly 40 percent, and the number of prime loan originations jumped by more than 50 percent. Subprime originations continued to increase rapidly between 2004 and 2006 before falling during the credit crunch in 2007. From 2001 through 2007, the Cleveland metro area consistently had a slightly higher percentage of subprime loans than either Ohio or the Fourth District states.
Figure 2. Percent of Loans Originated that were Subprime
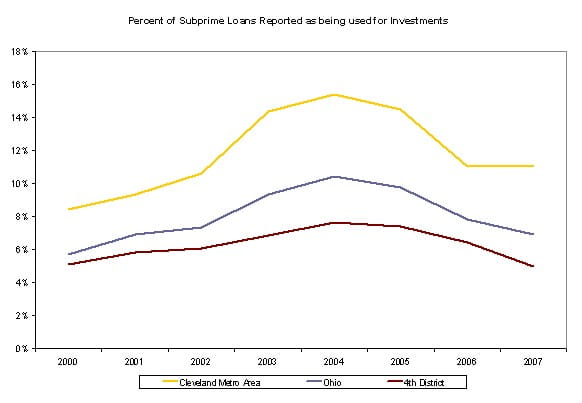
The percentage of subprime loans reported as being used for investment increased between 2000 and 2007.
While the vast majority of borrowers indicated that they intended to occupy the houses they were buying, considerably more subprime home mortgage loans in the Cleveland metro area were used for investment properties during the housing boom than in Ohio or the Fourth District states (see Figure 3).
Figure 3. Percent of Loans Reported as being used for Investments
Subprime loans originated after 2005 are deteriorating at a faster rate compared with previous vintages throughout the District. Adjustable-rate mortgages have fared considerably worse than their fixed-rate counterparts.
In the Cleveland metro area, not only are more loans defaulting6 over time, but the rate at which these loans are defaulting is rising. Since 2003 the area has seen consistent increases in the percentage of loans that are defaulting relative to the number of months since the loan was originated (see Figures 4 and 5). Loans originated between 2005 and 2007 have been defaulting at higher rates in Cleveland than in any of the Fourth District states, including Ohio.
Figure 4. Subprime Adjustable Rate Mortgage Default Rates in the Cleveland Metro Area
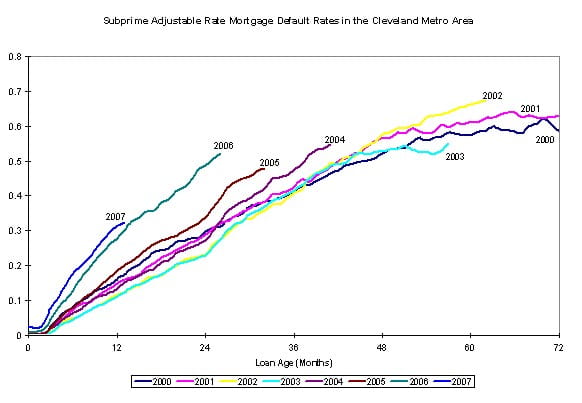
These increases are evident in both subprime fixed-rate and adjustable-rate mortgages. However, it is important to note that the ARMs have fared considerably worse than the fixed-rate mortgages.
Figure 5. Subprime Fixed Rate Mortgage Default Rates in the Cleveland Metro Area
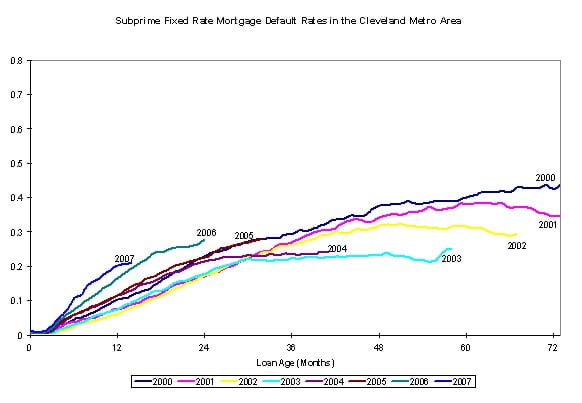
The percent of subprime loans that were current fell from 2001 to 2007.
While the percentage of subprime loans that were current in the Fourth District states decreased 9.5 points between 2000 and 2007, Cleveland’s drop was the most precipitous (see Figure 6). In the Cleveland metro area, the percent of loans that were current tumbled 16 percentage points, from 78 percent in 2000 to 62 percent in 2007. In this same time period, the total percentage of loans that were not current nearly doubled.
Figure 6. Average Percent of Subprime Loans that were Current

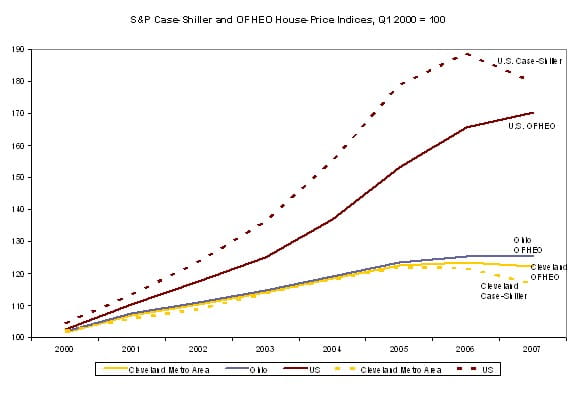
Unlike the nation as a whole, the loan deterioration problem in this area is not a consequence of a reversal of rapid house-price appreciation.
While the aggregate U.S. market saw rapid increases in housing values between 2000 and 2007, Ohio and the Cleveland metro area saw modest appreciation at best. According to data from the Office of Federal Housing Enterprise Oversight (OFHEO), U.S. housing values grew by more than 70 percent over that time period, while the markets in Ohio and the Cleveland metro area saw less than half that level of appreciation.7 The Case-Shiller index8 shows an even starker gap between the levels of house-price appreciation in U.S. and Cleveland metro area (see Figure 7).
Figure 7. S&P Case-Shiller and OFHEO House-Price Indices, Q1 2000 = 100
Conclusion
This report aims to deepen understanding of mortgage foreclosure trends as a first step toward drafting sensible policy solutions. Clearly, the data indicate that Cleveland has been disproportionately affected by subprime lending. However, the degree to which differing regulatory, investor, and pricing environments played roles in housing market problems at the regional level still needs to be clarified. Upcoming reports in this series will examine the performance of prime and subprime loans in other communities in the Fourth District.
Footnotes
- In general, subprime mortgages are made to borrowers with blemished credit histories or to those who provide incomplete documentation of their income and assets. At its simplest, subprime lending can be described as high-cost lending. “The Evolution of the Subprime Mortgage Market.” Federal Reserve Bank of St. Louis Review, January/February 2006, 88(1) pp. 31-56.
- The main dataset analyzed in this report is from First American LoanPerformance (LP) (see footnote 4). The data extracted from LP was for the Cleveland-Elyria-Mentor Core Based Statistical Area (CBSA). For the purpose of this report, this area is referred to as the Cleveland metro area.
- “Delinquencies and Foreclosures Increase in Latest MBA National Delinquency Survey.” Mortgage Bankers Association, June 5, 2008. Available athttp://www.mortgagebankers.org/NewsandMedia/PressCenter/62936.htm.)
- The analysis in this report comes from estimates using First American LoanPerformance (LP) Data. The data source includes an estimated 80 percent of prime loans and 45 percent of subprime loans nationally but it is not possible to verify that the sample is an accurate representation of other levels of geography. The data are adjusted to account for these sample weights. Data are provided to LP by eight of the 10 major loan servicers. All data designations (prime/subprime, current/delinquent, etc.) are made by the individual servicers and are not based on criteria set by LP. Where relevant, the Mortgage Bankers Association (MBA) definitions are used.
- In order to evaluate the outcomes of loans originated in the Fourth District it is helpful to define what outcomes are possible. Loans are considered “current” if the borrower is not behind on payments. Loans can become delinquent and return to a “current” status if the missed payments are repaid. Borrowers can also file for bankruptcy, the lender can initiate foreclosure proceedings or, once the foreclosure process has concluded, the loan can fall into real-estate owned (REO) status. For the purpose of this report, delinquency, bankruptcy, foreclosure, and REO are mutually exclusive.
- For the purposes of this paper, a loan is considered to be in default if it is at least two payments behind.
- The raw data was extracted from Haver Analytics based on OFHEO information.
- The Case-Schiller index includes mortgages of all types and sizes but has limited geographic coverage compared with the OFHEO index. However, the OFHEO index’s data comes from “conforming mortgages,” which means it misses properties financed with large or subprime loans.
The views expressed in this report are those of the author(s) and are not necessarily those of the Federal Reserve Bank of Cleveland or the Board of Governors of the Federal Reserve System.
- Share