

10 Things to Know About the Shape of Ohio's Skilled Workforce
A region’s economic performance is closely linked to the skills and knowledge of its workforce. Using college attainment as a measure of workforce skills, we examine overall trends in higher education to get a sense of where Ohio stands relative to other states. The data reveal that Ohio has made some progress, especially in improving educational attainment in its younger workers. At the same time, Ohio lags in a number of other dimensions, in particular, in its overall level of college attainment and in attracting educated workers into the state.
A region’s economic performance is closely related to the quality of its human capital—the knowledge and skills that its workforce possesses. Many studies have shown that U.S. states and metropolitan areas with a high proportion of highly skilled workers grow faster in terms of income, productivity, and population than less skilled regions.
This Commentary looks at the development of Ohio’s human capital base, focusing specifically on high-skilled, college-educated labor. The share of college graduates in the adult population (25 years or older) is a standard metric used to proxy for the high-skill nature of the workforce in a region. To be sure, it is not a comprehensive measure of skill. Individuals without college degrees may have developed strong skills through work experience and nondegree training programs. In addition, there are likely to be differences in the quality of acquired skills that are not picked up by relatively coarse educational attainment metrics. Still, the college attainment variable works reasonably well as a measure of human capital—it is positively correlated with the long-run economic growth of U.S. regions and stands up to a number of robustness tests.
We examine overall trends in college attainment for Ohio. The data reveal that Ohio has made progress, especially in improving educational attainment in its younger workers, but it also lags in a number of other dimensions, especially in attracting educated workers into the state.
The human capital of a region depends on a range of factors including (but not limited to) the educational infrastructure of the state, the industries that operate within its borders, and the ability to retain and attract highly skilled workers. We present 10 features that describe the current state of development of Ohio’s workforce skills, and its near-term outlook.
1. Ohio’s ranking in college attainment rates among the 50 states has been static for the last three decades, hovering around the 25th percentile.
In 2010, for example, 24.6 percent of Ohioans aged 25 and older had earned a four-year college degree (compared to the national average of 28.2 percent), placing Ohio at 39 in the rankings.1 Like other states, Ohio has increased its college attainment rates over time, but it has not improved its relative position among the states. This stability of rank is not found in all states. States such as Pennsylvania and Illinois have seen marked increases in their college attainment rates, both in absolute and relative terms, each improving by 15 places since 1980. Alternatively, certain Mountain and Southwestern states have seen their relative positions decline. (See figure 1.)
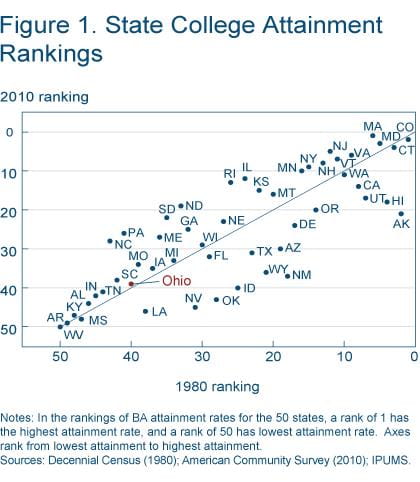
Notes: In the rankings of ba attainment rates for the 50 states, a rank of 1 has the highest attainment rate, and a rank of 50 has lowest attainment rate. Axes rank from lowest attainment to highest attainment.
Sources: Decennial Census (1980); American community Survey (2010); IPUMS.
2. Ohio’s younger working cohorts are doing better.
Ohio’s youngest working cohort (ages 25–34) had relatively low college attainment rates in 1980, ranking 39th in the nation. By 2010, Ohio had moved up to the 25th spot, with 29.4 percent of the younger cohort having at least a four-year college degree. Moreover, this younger cohort does even better in terms of advanced degrees. As of 2010, 8.6 percent of Ohioans aged 25–34 have advanced degrees, placing Ohio 17th among the 50 states. While not as dramatic, there has also been a steady improvement in Ohio’s educational attainment rankings for the 35–44 age category as well. (See figure 2.)
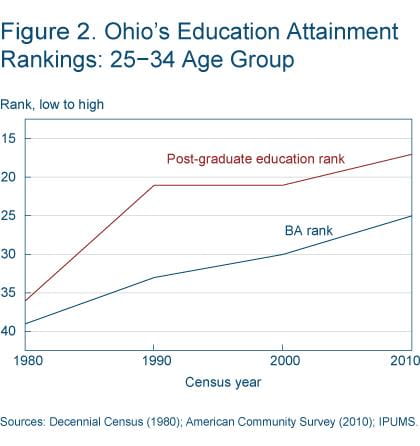
Sources: Decennial Census (1980); American Community Survey (2010); IMPUS
3. Two factors have kept Ohio’s overall ranking stable despite the improved college attainment rates of its younger cohorts: the falling educational attainment rates of its older cohorts and the slower population growth of its younger cohort.
The educational rankings of individuals 55 or older in Ohio have fallen over time, bringing down the state’s overall rankings. Meanwhile, population growth in Ohio’s younger cohorts has trailed the nation as whole. As the baby-boom generation has aged over the last several decades, the share of the population in the younger cohort has declined across the country. In Ohio, the decline has been steeper than in the majority of other states, so that the younger cohort makes up a relatively smaller share of Ohio’s population. Their smaller share mutes the effect of the cohort’s education gains on Ohio’s overall college attainment. (See figure 3.)
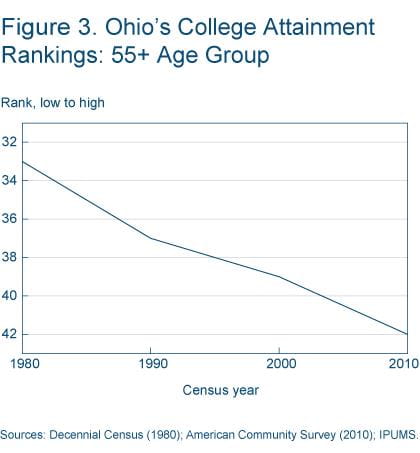
Sources: Decennial Census (1980); American Community Survey (2010); IMPUS
4. The pipeline of skilled workers in Ohio looks solid.
In the 18–24 age bracket, 48.5 percent of Ohioans in 2010 are either in college or have already earned a college degree. This places Ohio in the middle of the distribution, with a ranking of 22nd among the states. While the number of individuals in the pipeline is strongly correlated with subsequent educational attainment of the relevant cohort, it is not a simple one-to-one relationship. Not all those individuals in college will earn a four-year college degree—some will earn an associate’s degree and others will leave college without any degree. Highly educated workers are also more likely to move across states, so that some states will be net importers of the college educated while others will be net exporters.
5. Immigration boosts Ohio’s educational attainment.
On average, foreign-born residents of Ohio have much higher educational attainment rates than native-born residents. For individuals over 25, the college attainment rate for people born in the United States living in Ohio is 23.8 percent, while for the foreign-born it is 39.5 percent. This is not the typical pattern, as the foreign-born have somewhat lower college attainment rates than the native-born for the United States as a whole. The impact of the high rate of college attainment of the foreign-born on overall college attainment in Ohio is somewhat muted because Ohio has a relatively low percentage of immigrants in the population. Only 4.9 percent of Ohio’s 25-and-over population was born outside the United States, compared to an average of 10.9 percent in the other 49 states. (See figure 4.)
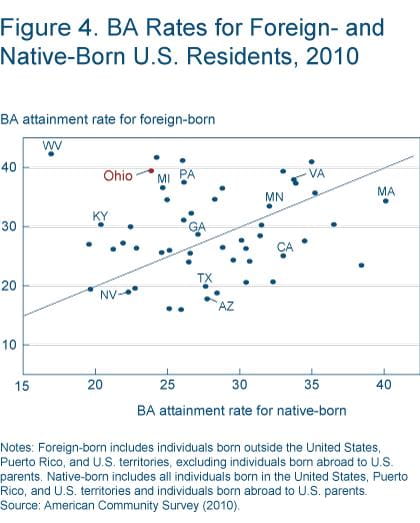
Notes: Foreign-born includes individuals born outside the United States, Puerto Rico, and U.S. territories, excluding individuals born abroad to U.S. parents. Native-born includes all individuals born in the United States, Puerto Rico, and U.S. territories and individuals born abroad to U.S. parents.
Source: american Community Survey (2010).
6. Younger international immigrants into Ohio are, on average, even more educated.
The bachelor’s degree (BA) attainment rate of individuals aged 25–34, not born in the United States but residing in Ohio in 2010 is substantially higher than the BA attainment rate of U.S. natives living in Ohio (46.9 percent vs. 28.2 percent). Foreign-born residents make up 6.5 percent of the 25–34 age group and 10.3 percent of those with a college degree in that group. In addition, foreign-born residents are particularly important in fields requiring academic backgrounds in science, technology, engineering, and math (STEM). As of 2010, they made up 21.3 percent of Ohio’s STEM workforce in the 25–34 cohort.
7. Domestic migration patterns have generally worked to reduce Ohio’s educational attainment.
From 2006 to 2010, the outflows from Ohio of individuals aged 25 years and older with BAs exceeded the inflows of those with BAs. For every four BAs that came into Ohio from other states, roughly five left to go to other states. A similar net outflow pattern is found for the young cohort, as well.
8. Over the long run, Ohio’s net outflow of high-human-capital individuals is not driven by an above-average proportion of skilled individuals leaving the state; rather, it reflects the low rate of migration of such individuals into Ohio from other states.
The proportion of individuals aged 25–54 with a BA who were born in Ohio but no longer reside in the state in 2010 is somewhat lower than the average exit rates of the rest the states—47.3 percent vs. 51.9 percent. (Educated people are quite mobile.) At the same time, only 29.8 percent of individuals with a BA who currently reside in Ohio were born in one of the other 49 states, Puerto Rico, or U.S. territories, compared to an average of 51.3 percent in the other states. It is not a brain drain story, per se. Instead, it is a lack of brain gain from outside the state. Now, this pattern is not limited to Ohio. In fact, it is common in states with low rates of population growth. (See figure 5.)
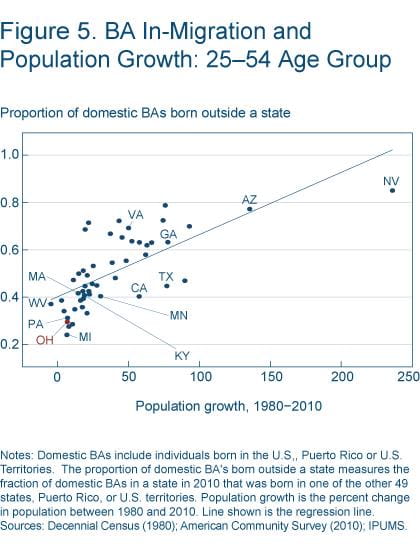
Notes: domestic BAs include individuals born in the U.S., Puerto rico or U.S. Territories. The proportion of domestic BA;s born outside a state measures the fraction of domestic BAs in a state in 2010 that was born in one of the other 49 states, Puerto rico, or U.S. territories. Population growth is the percent change in population between 1980 and 2010. Lone shown is the regression line.
Sources: Decennial Census (1980); American community Survey (2010); IPUMS
9. Industry structure plays an important role in explaining Ohio’s educational attainment patterns, though not a dominant one.
The difference between Ohio’s college attainment rate and that of the top 10 states in 2010 was substantial—24.6 percent vs. 35.1 percent. About one-third of this difference is due to differences in industry composition between Ohio and the most educated states. Particularly important is the fact that Ohio has significantly lower employment shares in the professional and financial services industries and in public administration. These are typically industries that employ a high fraction of college-educated workers. The fact that Ohio has a greater share in manufacturing industries actually plays a relatively minor role in driving the underlying differences.
10. Ohio has lower college attainment rates across a wide range of industries compared to the most educated states.
Out of the 99 three-digit NAICS industries, only 6 industries in Ohio have college attainment rates that exceed those of the most educated states—and these industries all have relatively small employment shares in Ohio. This means that that the most educated states have higher college attainment rates in both high- and low-skill industries compared to Ohio. (See figure 6.)
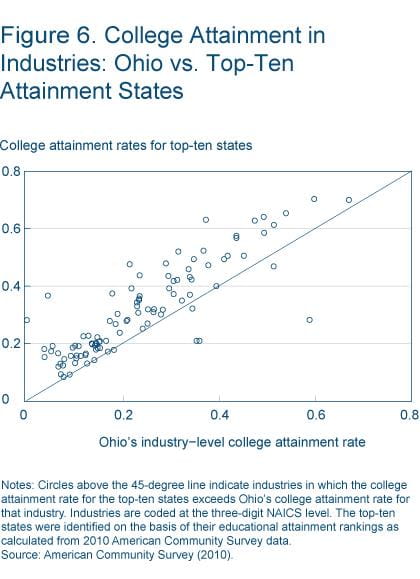
Notes: circles above the 45-degree line indicate industries in which the college attainment rate for the top-ten states exceeds Ohio's college attainment rate for that industry. Industries are coded at the three-digit NAICS level. The top-ten states were identified on the basis of their educational attainment rankings as calculated from 2010 American community Survey data.
source: American community Survey (2010).
Conclusion
Ohio remains a relatively low-ranked state based on the overall college attainment rate of the adult population. At the same time, there is some good news. Ohio’s young working cohort is moving up the rankings, Ohio’s education pipeline looks solid, and the state does attract a very skilled set of immigrants. However, one should be cautious in inferring the path of the future human capital stock simply from changes in the youngest cohort. To be sure, if one looks at Ohio’s young working cohort in 1990, it was ranked 33rd among the states. Not spectacular, but better than the state’s overall ranking at that time. However, over the next 20 years this cohort’s college attainment rankings slipped to 37th, in part due to domestic migration.
Certainly, Ohio’s recent gains are encouraging. But such improvements can dissipate over time, as highly skilled workers respond to shifts in labor demand within and outside of the state, as well as to changes in regional amenities or other economic factors.
Footnote
- In rankings based on the U.S. Census Bureau’s published data, Ohio ranks 38th out of the 50 states. Here, the statistics are produced using the 2010 American Community Survey microdata file, which yields slightly different state rankings. Return
Reference
- Integrated Public Use Microdata Series: Version 5.0 [Machine-readable database], Steven Ruggles, J. Trent Alexander, Katie Genadek, Ronald Goeken, Matthew B. Schroeder, and Matthew Sobek, 2010. Minneapolis, Minn.: Minnesota Population Center [producer and distributor].
The views authors express in Economic Commentary are theirs and not necessarily those of the Federal Reserve Bank of Cleveland or the Board of Governors of the Federal Reserve System. The series editor is Tasia Hane. This work is licensed under a Creative Commons Attribution-NonCommercial 4.0 International License. This paper and its data are subject to revision; please visit clevelandfed.org for updates.
Suggested Citation
Dunne, Timothy, and Guhan Venkatu. 2012. “10 Things to Know About the Shape of Ohio's Skilled Workforce.” Federal Reserve Bank of Cleveland, Economic Commentary 2012-06. https://doi.org/10.26509/frbc-ec-201206
This work by Federal Reserve Bank of Cleveland is licensed under Creative Commons Attribution-NonCommercial 4.0 International


- Share