
Opportunity Occupations in Ohio: Identification, Online Postings, and Employer Education Preferences
In September 2015 the Federal Reserve Banks of Philadelphia, Cleveland, and Atlanta published an analysis of “opportunity occupations” in the nation’s largest metropolitan areas, opportunity occupations being those jobs that are generally accessible to an individual without a four-year college degree and that pay a decent wage. Using national administrative and survey data for occupation-specific education requirements, we and our co-authors found that 27 percent of national employment in 2014 can be considered an opportunity occupation. However, when using a different data source—real-time online job ads—to capture the educational preferences of employers, this share declined to 20.3 percent. We also found considerable variation in the share of opportunity occupations across metro areas, as well as differences in the degree to which employer education preferences restricted employment opportunities across metros. Read Identifying Opportunity Occupations in the Nation’s Largest Metropolitan Economies.
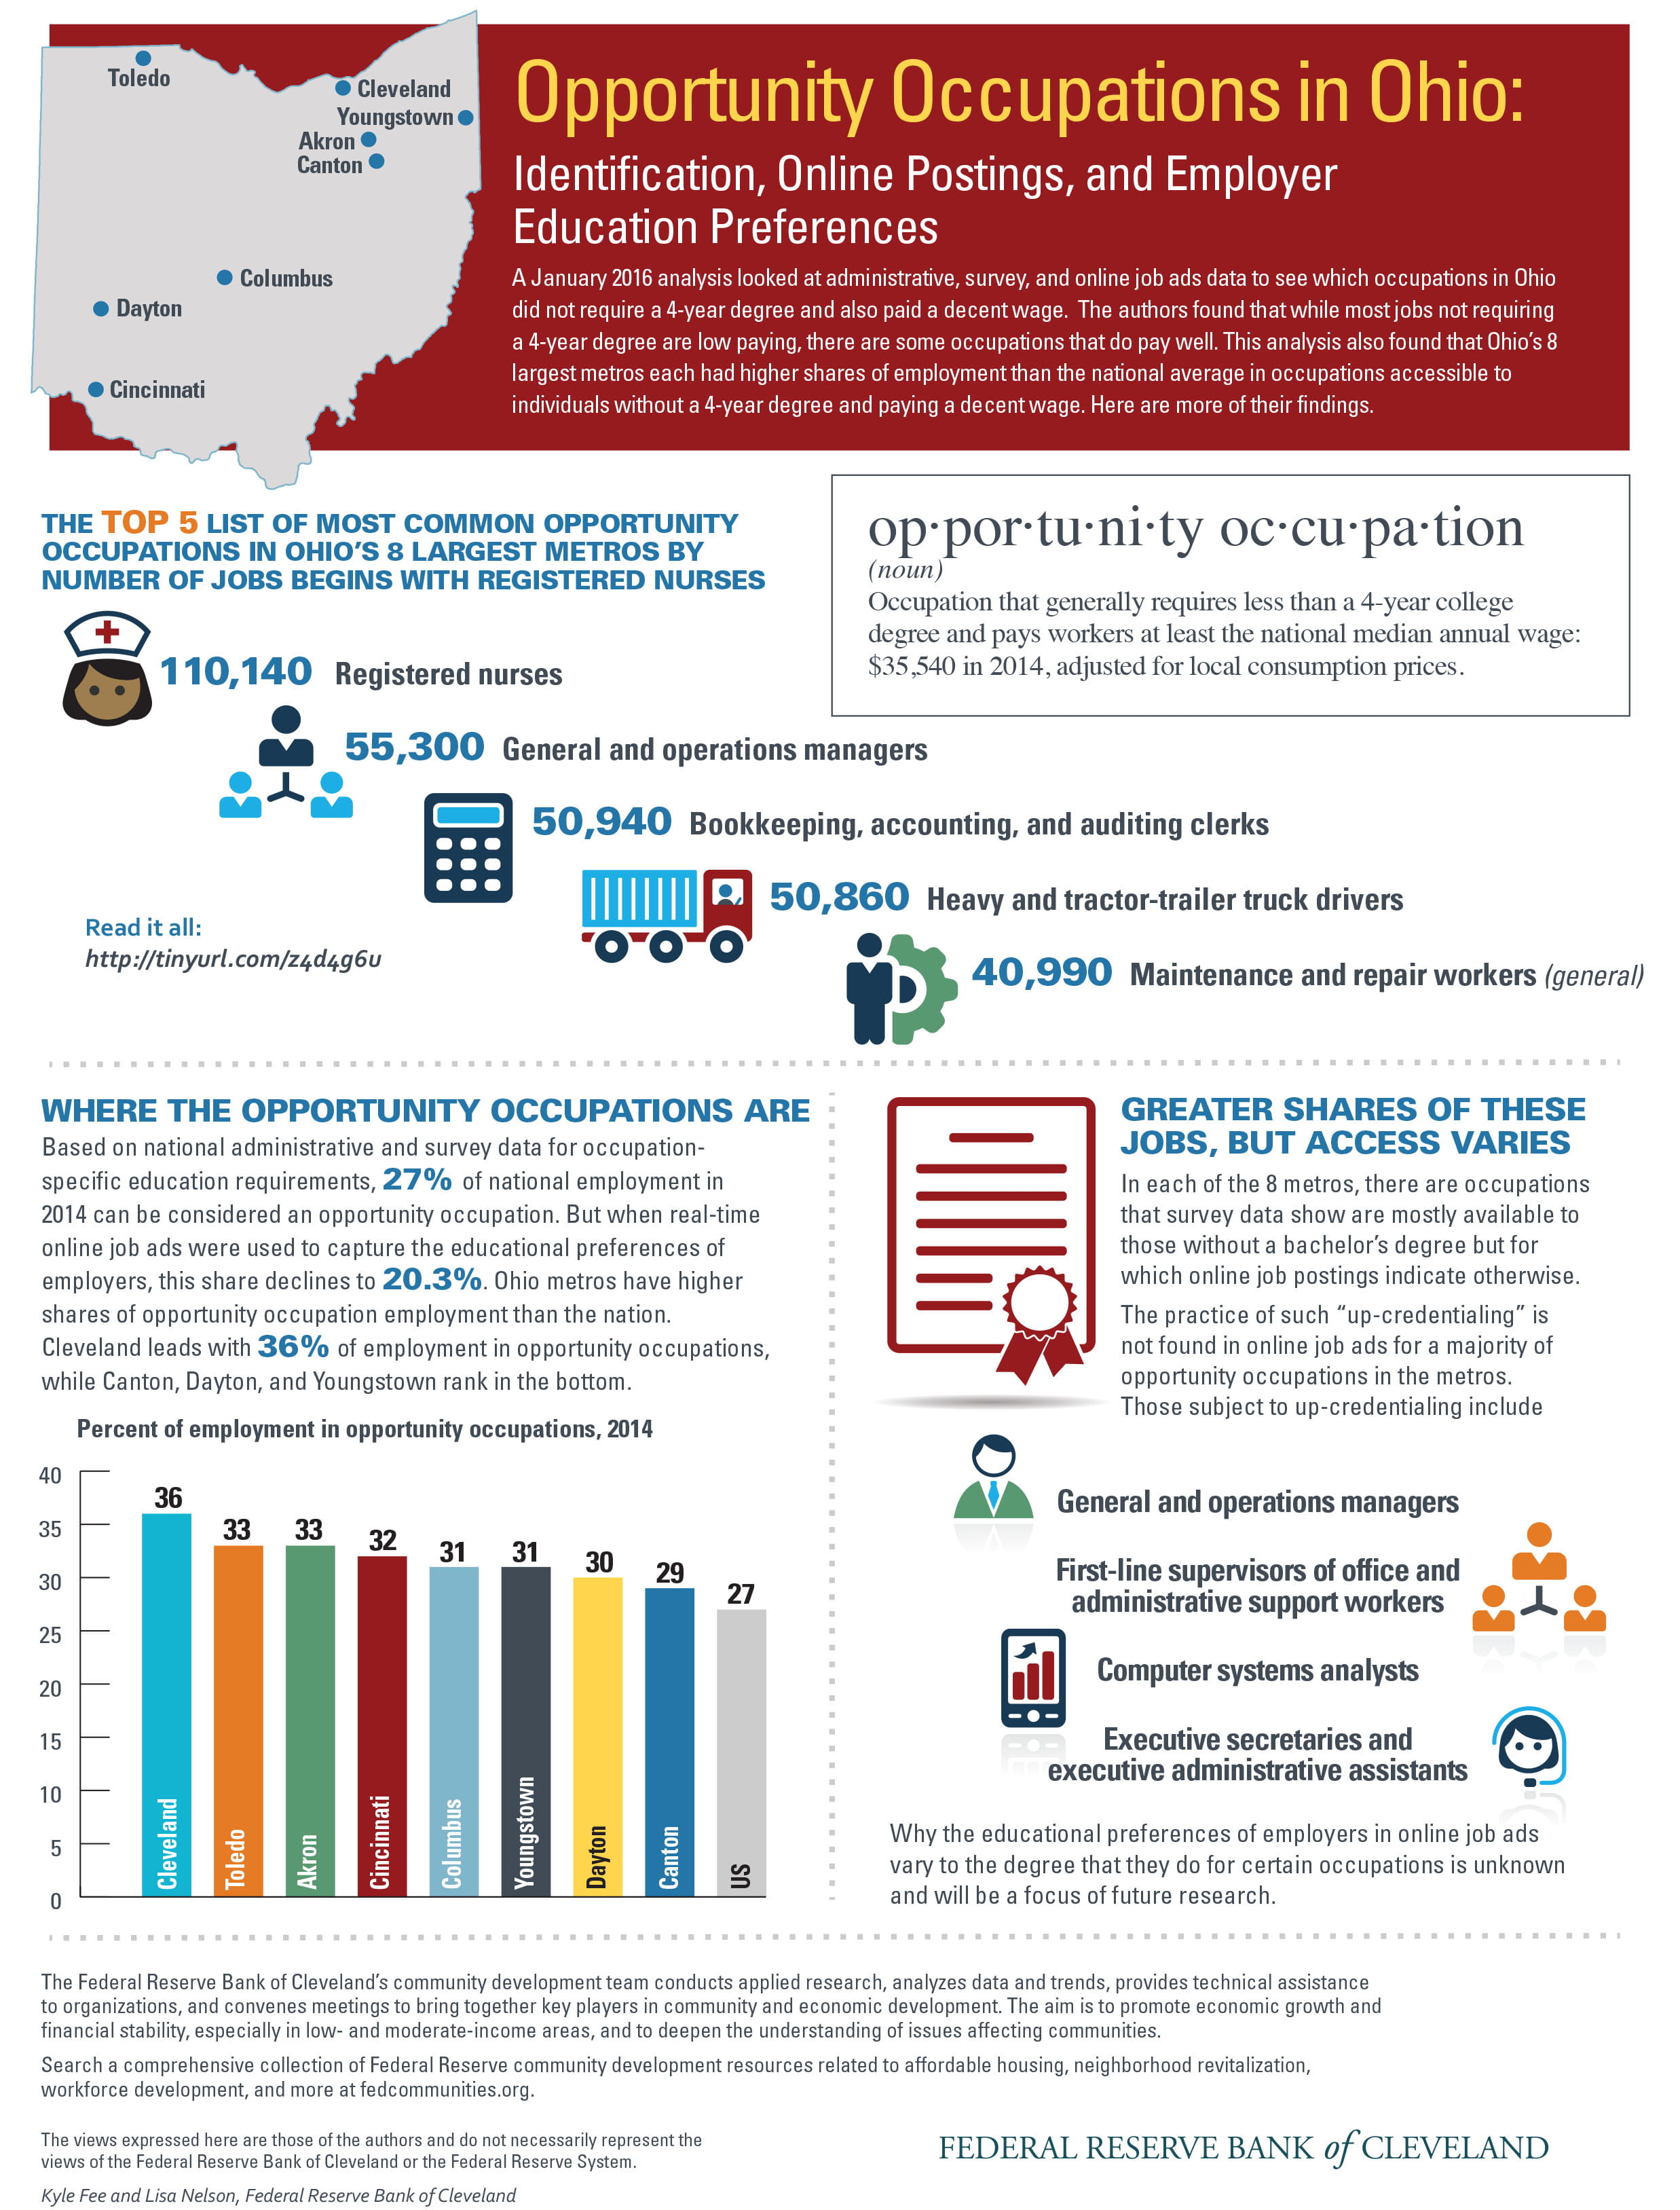
In September 2015 the Federal Reserve Banks of Philadelphia, Cleveland, and Atlanta published an analysis of “opportunity occupations” in the nation’s largest metropolitan areas, opportunity occupations being those jobs that are generally accessible to an individual without a four-year college degree and that pay a decent wage. Using national administrative and survey data for occupation-specific education requirements, we and our co-authors found that 27 percent of national employment in 2014 can be considered an opportunity occupation. However, when using a different data source—real-time online job ads—to capture the educational preferences of employers, this share declined to 20.3 percent.1 We also found considerable variation in the share of opportunity occupations across metro areas, as well as differences in the degree to which employer education preferences restricted employment opportunities across metros. (Read Identifying Opportunity Occupations in the Nation’s Largest Metropolitan Economies here.)
Introduction
In this report we take an in-depth look at opportunity occupations in the eight largest Ohio metro areas: Akron, Canton, Cincinnati, Cleveland, Columbus, Dayton, Toledo, and Youngstown. Our aim for this analysis is to provide an update to workforce professionals on recent trends in the labor market for job seekers without a four-year degree, while also laying the groundwork for further research on opportunity occupations. Our future research seeks to understand why the share of opportunity occupation employment varies across the top 100 metro areas. In addition, we will investigate the prevalence of employers seeking higher levels of education than is required for an opportunity occupation, or “up-credentialing.” In keeping with these dual objectives, we include practical and research implications throughout our findings.
First, we identify those occupations in Ohio that are accessible for someone without a four-year college degree and that pay a better wage than the national median. Then, we examine the rates at which different occupations are posted online and analyze employer education preferences for opportunity occupations via online job ads. Finally, we offer some concluding thoughts and next steps.
Data and Methods
There are a few key points to make regarding the data and methods we used to identify opportunity occupations in this report; for a complete methodological discussion, see the “Data and Methods” section of Identifying Opportunity Occupations in the Nation’s Largest Metropolitan Economies.2
Data on employment, wages, and location quotients come from the Bureau of Labor Statistics Occupational Employment Statistics (May 2014). We used three different datasets to determine the education level for a specific occupation. The first is from the Bureau of Labor Statistics’ (BLS) Employment Projections program and reflects the typical level of education needed to enter an occupation. The second dataset is from the Employment & Training Administration’s Occupational Information Network (O*NET) program. The occupation-specific education levels in this dataset are based on survey responses of incumbent workers and occupation experts and reflect the level of education a new hire would need to perform the job. We consider an occupation to be accessible to a worker without a four-year degree if at least 50 percent of the O*NET survey respondents do. The third dataset is from Burning Glass Technologies (BGT). This dataset is created from information extracted from online job ads from more than 40,000 job sites and reflects the educational preferences of employers. We assume that an occupation is available to a worker without a four-year degree if more than 50 percent of the job ads specify a high school diploma or an associate’s degree as the minimum level of education. It is also important to note that both the BLS and O*NET datasets are national in scope, while the BGT dataset allows for an occupation’s required education to differ across metros.
An occupation’s median annual wage must exceed a local minimum threshold for it to be considered decent-paying. According to the Bureau of Labor Statistics, the national annual median wage for all workers—$35,540 in 2014, adjusted for local consumption prices—serves as that wage threshold. This threshold is arbitrary, and does not reflect a level of self-sufficiency for families of varying sizes and compositions. The adjustment for local consumption prices can and does cause some occupations to be classified as opportunity occupations in some metros but not in others.
Table 1 illustrates how the data are used to classify opportunity occupations. Looking at the first two columns, we see that first-line supervisors of production and operating workers in both the Youngstown and Columbus MSAs meet the wage threshold for an opportunity occupation: the annual median wage for this occupation exceeds the opportunity occupation wage threshold. According to the O*NET data, 76 percent of the survey respondents indicated the job was accessible to those without a bachelor’s degree. This job is therefore considered an opportunity occupation using O*NET.
Looking at employer preferences, we see that in Columbus, employer preferences for education fall below our 50 percent threshold (46%), so this position would not be considered an opportunity occupation using the BGT data. In Youngstown it would be, however, since 68 percent of the job ads requested less than a four-year degree. In columns three and four, note that while secretaries and administrative assistants meet the education requirements for an opportunity occupation in both the Cleveland and Canton metros using either O*NET or BGT, the annual median wage does not exceed the wage threshold in Canton; therefore this position is not considered an opportunity occupation in that metro.
Findings
Section One Findings: Identifying Opportunity Occupations in Ohio’s Largest Metros
In this section, we look at all of the occupations in eight Ohio metros available to someone without a four-year degree to determine which ones qualify as opportunity occupations. Once we have identified opportunity occupations, we document the share of employment in opportunity occupations in each Ohio metro, offer some insights into why some metro areas have higher shares of opportunity-occupation employment, and highlight the commonality and concentration of these opportunity occupations across the eight metros in the state.
Finding 1a: Most jobs requiring less than a four-year degree in Ohio’s eight largest metros are low paying.
Table 2 lists the top 20 largest occupations requiring less than a four-year degree in Ohio. Many of the occupations on this list reside in the service sector and most are low-paying. Of these 20, more than half—13—do not meet our wage threshold to qualify as an opportunity occupation. Moreover, the 13 occupations that do not meet the local wage threshold account for 74 percent of the total employment in this table, which suggests that a majority of the jobs for someone without a four-year degree are in low-paying occupations. While only seven occupations listed here are considered opportunity occupations, there are others that qualify, although at lower levels of employment.
Practical Implication:
A majority of occupations available to someone without a four-year degree are low-paying; however, there are some occupations that do provide a decent paycheck. Job-seekers and workforce development professionals should be aware of which occupations provide better paychecks than others for workers without a four-year degree.
Finding 1b: Administrative surveys and online job ads tend to agree on the level of education needed for an opportunity occupation, with some differences.
Table 3 lists the 30 largest opportunity occupations in Ohio’s eight metro areas. Registered nurses top the list, followed by general and operations managers; bookkeeping, accounting and auditing clerks; heavy and tractor-trailer truck drivers; maintenance and repair workers, general; and secretaries and administrative assistants, except legal, medical, and executive. The third column of table 3 lists the dataset that considers an occupation to be an opportunity occupation. While there are some discrepancies among the BLS, O*NET, and BGT datasets, most occupations are considered to be an opportunity occupation in all three datasets.
Practical Implication:
The finding that the education needed for most opportunity occupations is generally consistent across administrative surveys and online job ads indicates that employer education preferences tend to align with public sources. However, the presence of some differences highlights the need to consult multiple sources of data to fully understand the education requirements associated with an occupation.
Research Implication:
Those occupations considered to be opportunity occupations in the BLS and O*NET datasets but which are not in the BGT dataset provide a sample to investigate the practice of “up-credentialing,” wherein employers seek higher levels of education than typically required for an opportunity occupation.
Finding 1c: Ohio’s largest metros have a higher share of employment in opportunity occupations than the national average.
Table 4 shows the share of total employment that is considered to be an opportunity occupation according to the BLS and O*NET datasets. In general, Ohio has a higher share of employment in opportunity occupations than the national average. The Cleveland metro area has the highest share of opportunity occupation employment in the state with 36 percent, while Canton, Dayton, and Youngstown each have roughly 30 percent of employment in opportunity occupations. Given the similarities between the shares of BLS and O*NET, further findings will focus on the O*NET-designated opportunity occupations.

Finding 1d: The share of opportunity occupations varies across Ohio metro areas.
Chart 1 shows the distribution of employment by wages and O*NET education. Again, Cleveland is at the high end with 36 percent of employment in opportunity occupations, while Canton, Dayton, and Youngstown round out the bottom. Interestingly, in all eight Ohio metros, opportunity occupations account for more of the high-wage employment than occupations that require a four-year college degree. Also of note is that Canton, Toledo and Youngstown have lower shares of high-wage, bachelor’s-degree-required employment than the other metro areas.
"In all eight Ohio metros, opportunity occupations account for more of the high-wage employment than occupations that require a four-year college degree."
Practical Implication:
Ohio’s having a larger share of employment in opportunity occupations than the national average suggests there may be more opportunities for an adult without a four-year degree to obtain a decent-paying job in this state than elsewhere.
Finding 1e: Most of the top opportunity occupations are found in all eight Ohio metro areas, although a few occupations do not exceed local wage thresholds.
Table 5 lists the number of Ohio metro areas wherein an occupation is considered an opportunity occupation. Most opportunity occupations are found in all eight metro areas, with some exceptions. With the O*NET data, the education needed for an occupation is fixed across metro areas; thus, for an occupation not to be considered an opportunity occupation it must fail to meet the local wage threshold. Interestingly, in some metro areas, several occupations fail to meet or surpass this threshold by only a few hundred dollars while in other metros these occupations are well short of the local wage threshold. For example, jobs in the secretaries and administrative assistants’ category are not considered opportunity occupations in Canton, Cincinnati, and Youngstown because they fail to meet the local wage threshold by $2,031, $563, and $3,610, respectively. It should be noted that there are 133 instances (5 percent of all possible MSA-occupation combinations) where the annual wage for the occupation is $1,000 higher or lower than the local wage threshold.
Finding 1f: The interaction between a metro area’s cost of living and its wage distribution helps to explain that MSA’s share of opportunity occupations.
Table 6 lists the regional price parity (RPP) index value, local wage threshold, and median annual wage for each Ohio MSA. A higher RPP value indicates a higher cost of living in a metro area. Operationally, metros with lower costs of living have lower local wage thresholds to meet for an occupation to be considered an opportunity occupation. Conversely, metros with higher costs of living have higher local wage thresholds that must be met for an occupation to be identified as an opportunity occupation. For example, Akron, Cleveland, and Youngstown all have similarly low RPP values that equate to the lowest local wage thresholds of roughly $31,500. However, the distribution of wages in these three metros results in different shares of opportunity occupations because metros with higher annual median wages naturally have a greater share of employment above the local wage threshold. Given this, it should be no surprise that Cleveland, with the lowest RPP value and the highest annual median wage among the eight metros, has the highest share of opportunity occupations. Conversely, when the local wage threshold is lower than annual median wage, the opposite happens: opportunity occupation shares tend to be lower, as in Canton and Youngstown.
Practical Implication:
While some occupations fail to meet local wage thresholds to qualify as opportunity occupations in some metros, it does not mean that they are not good-paying jobs. Rather, an area’s cost of living and an employee’s total hours worked are what determine a good-paying job in this framework.
Research Implication:
A metro’s opportunity occupation share of employment is a function of an area’s cost of living and its wage distribution, the latter being reflective of the area’s industrial structure, which in turn influences the economic environment and cost of living in an area. The above analysis suggests that there are certain metros where lower costs of living overlap with higher-than-average wage distribution profiles due to industry structure, and produce higher shares of employment in opportunity occupations. Additional research on metro level variation in the share of employment in opportunity occupations could explore the industrial structure and cost of living in a metro area.

Finding 1g: Opportunity occupations are more concentrated in Ohio’s eight metro areas compared to the nation.
Chart 2 depicts the share of opportunity occupation employment that is found in higher concentrations (location quotient > 1.25) locally than at the national level. A location quotient is a way of quantifying how concentrated a particular occupation is in a region when compared to the nation – values of greater than one indicate more concentration or specialization when compared to the nation. For example, in the Cleveland MSA, the location quotient for registered nurses is 1.44 which indicates that this occupation is 1.4 times more concentrated in Cleveland than in the nation (see Appendix 1). In Canton, Toledo, and Youngstown, more than 40 percent of opportunity occupation employment is in occupations that are more concentrated in the local area than nationally. On the other hand, in Cincinnati and Columbus less than 30 percent of opportunity occupation employment is found in higher concentrations than nationally. Most Ohio metros have more opportunity occupation employment in locally concentrated occupations than the national average.
Finding 1h: Each of Ohio’s eight metros has a unique set of highly concentrated opportunity occupations.
Table 7 lists the 10 most concentrated opportunity occupations in each Ohio metro. While there are too many occupations to highlight, it is clear from the list that highly concentrated opportunity occupations vary from MSA to MSA. It is also apparent that the most concentrated opportunity occupations in Ohio’s metro areas tend to be production-based, with the exception of Columbus, where it appears the most concentrated opportunity occupations align with business services. These highly concentrated, or “high location quotient,” occupations tend to be at much lower levels of employment when compared to most common opportunity occupations noted above, yet they indicate what occupations are clustered in each of the eight metros.
Practical Implication:
High location quotient occupations are considered to be “tradable”; in other words, the goods and services associated with an occupation are for consumption outside the local area. These occupations serve the important purpose of bringing money from outside the region into the local economy. Moreover, many of these highly concentrated opportunity occupations are skilled trades that are integral to production processes.
Research Implication:
Differences in the share of opportunity occupation employment that is concentrated in a metro and the concentration of different opportunity occupations across metros point to the need for further analysis on the industrial structure of a metro area as it relates to a metro’s share of opportunity occupation employment.
Section Two Findings: Differences in Online Job Postings
In this section, we take those occupations identified as opportunity occupations and see how likely it is for job ads to be posted online for a particular occupation. This type of information can be useful not just to the jobseeker looking to gain employment in an opportunity occupation, but can also aid a researcher contemplating research design.
"Job seekers without a four-year degree [and] able to overcome one barrier to employment by accessing the internet [face] another barrier: opportunity occupations are posted online at lower rates than jobs with higher levels of education."
Finding 2a: Opportunity occupations are posted online at lower rates than those occupations that require a four-year degree.
Table 8 shows the median and average posting rate for opportunity occupations; higher-wage, bachelor’s-degree-required occupations; and low-wage occupations in eight Ohio metros. Both the average and median posting rate for higher-wage, bachelor’s-required occupations are higher than those for opportunity occupations, meaning that these occupations are posted online more frequently. In fact, bachelor’s-degree-required occupations are posted at almost double the rate of opportunity occupations. This is consistent with other research that finds “the main source of bias in job ads data is due to differences in internet access among job applicants, which varies by education level.” 3 Additionally, opportunity occupations tend to be posted at rates similar to those occupations paying lower wages.

Finding 2b: Opportunity occupations are posted online at varying rates.
However, there is considerable variability in the posting rates of opportunity occupations. Chart 3 displays the online posting rates for the most prevalent opportunity occupations. The disparity in posting rates is quite apparent from the graph. Heavy and tractor-trailer truck drivers have the highest online posting rates at 62 online postings per every 100 jobs that currently exist, whereas police and firefighters have the lowest online posting rates among opportunity occupations. The nature of a specific occupation is likely informative as to how many job ads are posted on online. For example, high worker turnover along with strong demand for workers that are in short supply is likely the reason for the high online posting rates of heavy and tractor-trailer truck drivers. On the other hand, regularly scheduled training programs with a surplus of workers looking to enter the firefighter profession, along with a strict geographic footprint, tend to limit the need for posting those job ads online.
Practical Implication:
Even if job seekers without a four-year degree are able to overcome one barrier to employment by accessing the internet, another barrier remains in that opportunity occupations are posted online at lower rates than jobs with higher levels of educations. In general, the limited online posting rates of opportunity occupations highlight the need for job seekers to consult additional sources of job listings when looking for employment in an opportunity occupation. Similarly, online posting rates for opportunity occupations and lower-wage occupations also present an additional challenge of sorting through the multitude of postings to find those opportunity occupations.
Research Implication:
Researchers should be aware that jobs are posted at different rates when relying on information embedded in job ads to perform analysis. Moreover, not all job ads provide complete information. In addition, while not presented here, occupation-specific posting rates vary by metro area; the industry and firm composition, for example, along with other factors likely influence the posting rate of an occupation in a given metro area. These potential biases should make a researcher working with online job ads exercise caution when designing research and interpreting results.
Section Three Findings: Employer Education Preferences
In this section, we explore whether the practice of up-credentialing—a process whereby employers may require a bachelor’s degree for jobs which historically have not needed one—may be evident. Initially, we identified what share of metro employment is no longer accessible to someone without a four-year degree. Next, we aggregated job postings data across the years (2011 through 2014) and eight metro areas to produce an estimate of employer education preferences to see how many opportunity occupations are subject to up-credentialing. Finally, we look to see if employer education preferences have changed from 2011 to 2014 as labor markets have recovered from the Great Recession.

Finding 3a: Employer education preferences are less restrictive in Ohio’s eight metros than in the nation.
What we found in our analysis is that using employer education preferences extracted from online job ads to signal the education required for an occupation tends to lower the share of employment that is deemed an opportunity occupation in a metro area. Chart 4 shows the share of opportunity occupation employment according to O*NET and BGT data along with the difference between those employment shares. Employer education preferences expressed in job ads lowers the share of opportunity occupations across all eight Ohio MSAs. Stated differently, employer preferences for higher education levels than is considered necessary by administrative surveys results in certain jobs not being considered opportunity occupations in each of eight Ohio metros we examined. However, online employer preferences tend to be less restrictive in Ohio’s eight metros when compared to the nation’s 100 largest metros, as suggested by the national average. Columbus, which sees opportunity occupation employment fall 7 percentage points due to employer preferences for higher levels of education, is the most restrictive metro in Ohio. Conversely, employer preferences are least restrictive in Canton, Toledo, and Youngstown.
Finding 3b: Employer education preferences suggest that not all opportunity occupations are available to someone without a four-year degree.
Table 9 shows the percent of job ads requesting less than a bachelor's degree for the most prevalent opportunity occupations in Ohio. While most occupations in this table exceed 50 percent, those occupations with less than 50 percent would not be considered an opportunity occupation based upon employer education preferences expressed in job ads. Occupations not accessible to those without a bachelor’s degree include: general and operations managers; first-line supervisors of office and administrative support; computer systems analysts; first-line supervisors of production and operating workers; sales representatives, wholesale and manufacturing, technical and scientific products; and human resource specialists.
"Those opportunity occupations with the most disagreement in employer education preferences across the eight metros include registered nurses; general and operations managers; licensed practical and licensed vocational nurses; first-line supervisors of production and operating workers; and computer user support specialists."
Finding 3c: Employer education preferences for the same opportunity occupation vary across Ohio’s eight metros.
Comparing the MSAs with the highest and the lowest share of job ads requesting less than a four-year degree reveals that employer education preferences for the same opportunity occupation vary across Ohio metropolitan areas (last column, table 9). The smaller the difference between the MSAs with the lowest and highest shares of job ads indicates there is more agreement in employer education preferences across the metros and the bigger the difference, the less agreement across the MSAs. Those opportunity occupations with the most disagreement in employer education preferences across the eight metros include registered nurses; general and operations managers; licensed practical and licensed vocational nurses; first-line supervisors of production and operating workers; and computer user support specialists.
Finding 3d: The practice of up-credentialing is more likely to happen in certain opportunity occupations.
Table 10 lists the most common opportunity occupations in Ohio metros that are out of reach to someone without a four-year degree according to BGT. Across all 281 opportunity occupations, only 59 occupations are subject to up-credentialing in online job ads. Some of the larger opportunity occupations subject to the practice of up-credentialing include general and operations managers; first-line supervisors of office and administrative support workers; computer systems analysts; executive secretaries and executive administrative assistants; and first-line supervisors of production and operating workers. (Appendix 2 has the 10 largest opportunity occupations subject to up-credentialing broken out by metro area.)
Finding 3e: If an opportunity occupation is subject to up-credentialing in one metro area, it is likely to be the case in other metro areas.
The last three columns of table 10 indicate that if an opportunity occupation was subject to up-credentialing in one metro area, it was likely to be happening in other metro areas. On the other hand, some opportunity occupations are only subject to up-credentialing in one or two metro areas.
Practical Implication:
The practice of up-credentialing is not found in online job ads for a majority of opportunity occupations in our study metros. Evidence of up-credentialing is limited to 59 out of 281 opportunity occupations, or roughly 20 percent. However, the variation in employer education preferences across these metros may cause some up-credentialing to take place in select occupations in a few metros while not occurring in other metro areas. Yet, it is more likely for an opportunity occupation to experience up-credentialing in all metro areas if it’s happening in one metro.
Research Implication:
Those opportunity occupations that do experience up-credentialing should be further investigated to look for patterns among the occupations. If employer education preferences in all metros indicate up-credentialing is taking place, does this signal an overall change in the day-to-day activities of an occupation or does it indicate the need for industry certifications or other credentials?
Finding 3f: Employer education preferences have eased over time for some opportunity occupations, but not for all.
Table 11 reports the difference in the share of job ads requesting less than a four-year degree between 2011 and 2014 for each of the most common opportunity occupations. A negative number indicates that employer preferences for higher levels of education have increased from 2011 to 2014 while a positive number indicates employer preferences for higher levels of education have declined. For most of the opportunity occupations, employer education preferences have become more accessible to those without a bachelor’s degree while employer education preferences for registered nurses, police and sheriff’s patrol officers and first-line supervisors of production and operating workers have become less accessible to those without a bachelor’s degree from 2011 to 2014.
Finding 3g: Employer education preferences for registered nurses have increased in all Ohio metro areas.
Given that registered nurses comprise the largest opportunity occupation, it is useful to understand what is happening with employer education preferences over time. Table 12 lists the percent of job ads requesting less than a four-year degree for registered nurses in 2011 and 2014 for eight Ohio metros. Across all of the metro areas, employer preferences for bachelor-degreed registered nurses have increased from 2011 to 2014. The largest change in employer preferences is found in Dayton, with the share of job ads requesting a four-year degree increasing from 28.8% to 45.7%. Also of note is that Cleveland’s share of nursing job ads requesting less than a four-year degree in 2011 was already close to the 50 percent cut-off for the definition of an opportunity occupation. By 2014, employer education preferences in Cleveland suggest a registered nurse is no longer an opportunity occupation, given just 44 percent of the job postings are accessible to those without a four-year degree.
Practical Implication:
Easing employer education preferences may reflect improving labor markets; however, increasing employer educational demands for registered nurses is a complex issue. Registered nurses are currently the largest source of employment for someone without a four-year degree to earn a decent paycheck; however, the shift toward higher levels of education is consistent with the National Academy of Medicine’s recommendation to increase the percentage of bachelor-degreed nurses. While this analysis cannot explain the reasons behind the significant changes in employer preferences for education among registered nurses, these trends are suggestive of the education demands for those seeking to enter the nursing field.
Conclusion
Our analysis shows that in Ohio’s eight metros there are larger shares of opportunity occupations when compared to the nation. This holds true whether we use the education data from the survey of incumbent workers and occupation experts (O*NET) or the employer preferences from online job ads. But like the nation, the overall shares of opportunity occupations tend to be lower when using online job ads.
"The process of up-credentialing is not prevalent for most of the opportunity occupations in Ohio’s metros, which may bode well for job seekers without a four-year degree."
Overall, for most occupations if it is considered an opportunity occupation in O*NET, it is also considered an opportunity occupation according to the online job ads. So, the process of up-credentialing is not prevalent for most of the opportunity occupations in Ohio’s metros, which may bode well for job seekers without a four-year degree. But those job seekers may have to look harder to find them. In each of our eight metros, there are occupations—such as general and operations managers and computer systems analysts—that according to O*NET data are mostly available to those without a bachelor’s degree, but for which online job postings indicate are mostly unavailable to those without a four-year degree. Also, accessibility varies across metros for the same occupation. A jobseeker with less than a four-year degree looking for work as a first-line supervisor of production and operating workers may have more success in one Ohio metro than in another.
We do not know why the educational preferences of employers in online job ads vary from O*NET requirements to the degree that they do for certain occupations. It could be the mix of employers posting jobs online. It could be that administrative surveys are not reflective of the actual skill sets necessary to fulfill employers’ demands. Or, employers may be requiring higher levels of education as a proxy for certain skills they are seeking. This will be a focus of future research. Furthermore, additional Federal Reserve research will examine what factors can help explain the differences we observe in the opportunity occupation shares across the nation’s largest metros.
Footnotes
- Wardrip Keith, Kyle Fee, Lisa Nelson and Stuart Andreason. Identifying Opportunity Occupations in the Nation’s Largest Metropolitan Economies. Federal Reserve Banks of Atlanta, Cleveland, and Philadelphia, 2015. Return
- Wardrip, cited above. Return
- Carnevale, Anthony P., Tamara Jayasundera, and Dmitri Repnikov. Understanding Online Job Ads Data: A Technical Report. Washington, D.C.: Center on Education and the Workforce, Georgetown University, 2014. Return


The views expressed in this report are those of the author(s) and are not necessarily those of the Federal Reserve Bank of Cleveland or the Board of Governors of the Federal Reserve System.
- Share